BUYOUTS AND BEYOND:
Politics, Planning, and the Future of Staten Island’s East Shore After Superstorm Sandy
By
Alexander F. Brady B.A. Comparative Literature
Princeton University, 2010
SUBMITTED TO THE DEPARTMENT OF URBAN STUDIES AND PLANNING IN PARTIAL FULFILLMENT OF THE REQUIREMENTS FOR THE DEGREE OF
MASTER IN CITY PLANNING AT THE
MASSACHUSETTS INSTITUTE OF TECHNOLOGY JUNE 2015
©2015 Alexander F. Brady. All Rights Reserved.
The author hereby grants to MIT permission to reproduce and to distribute publicly paper and electronic copies of this thesis document in whole or in part in any medium now known or hereafter created.
Signature of Author ____________________________________________________________________________________ Department of Urban Studies and Planning May 18, 2015 Certified by ____________________________________________________________________________________________
Professor Lawrence J. Vale Department of Urban Studies and Planning Thesis Supervisor Accepted by ___________________________________________________________________________________________
Professor Dennis Frenchman Chair, MCP Committee Department of Urban Studies and Planning
BUYOUTS AND BEYOND:
Politics, Planning, and the Future of Staten Island’s East Shore After Superstorm Sandy
By
Alexander F. Brady B.A. Comparative Literature
Princeton University, 2010
Submitted to the Department of Urban Studies and Planning on May 18th, 2015 in Partial Fulfillment of the
Requirements for the Degree of Master in City Planning ABSTRACT
In the aftermath of Superstorm Sandy, two separate, federally funded programs began purchasing storm-damaged homes from voluntary sellers in the low-lying, working-class communities of Staten Island’s East Shore. New York State’s, offered in three specific, geographically bounded neighborhoods, requires that the land procured be preserved as open space. The City’s acquires any substantially damaged properties, with the goal of redeveloping them as more resilient housing. I began my research by asking why these parallel and sometimes competing programs had been established for the East Shore. What I uncovered was a deeply political, ad-hoc process resulting from a complex series of interactions between and among residents and their elected officials, each lobbying for their own priorities.
While I explore this process in depth, I also pursue additional questions suggested by my findings. I was consistently told that each program’s primary goal was to meet residents’ immediate needs; thus, each was designed to respond to individuals or groups of homeowners, rather address the community as a whole. Yet when they were announced, each was also framed in terms of future land use: with the State’s to create “buffer” areas protecting inland neighborhoods, and the City’s providing an opportunity to rethink the East Shore’s small lots, narrow streets, and insufficient infrastructure, a legacy of its history as a community of summer bungalows. Now that the government has begun to acquire land, however, these future-oriented goals have encountered numerous challenges—from disagreements over the appropriate agency to own and maintain the open space, to a potential loss of one of the few areas of the city providing an affordable homeownership option.
In this context, I examine the post-Sandy planning processes that did take place in New York and their relationship to the acquisition programs, in comparison to similar planning and acquisition processes in New Orleans, LA and Cedar Rapids, IA. Ultimately, and particularly in light of the slow process of disbursing federal aid, I ask whether an engaged, participatory planning process is really a barrier to meeting immediate needs, or whether a properly designed process can yield better outcomes for both the victims of disaster and the neighborhoods they leave behind. Thesis Advisor: Lawrence J. Vale
BUYOUTS AND BEYOND:
Politics, Planning, and the Future of Staten
Island’s East Shore After Superstorm Sandy
ACKNOWLEDGEMENTS
First and foremost, I’d like to thank all those who gave generously of their time to share their thoughts and experiences with me in my interviews; without them, this thesis would not exist. Thanks to my advisor, Larry Vale, for the care and insight he brought to his feedback, for helping to keep me on track, and for holding me to his high standards in both puns and alliteration. To my reader, Michael Marrella, for carving out the time for a 100-page thesis in the midst of a very busy schedule, his critical eye, the access he provided to me, and for hiring me last summer, which set me on this long and winding path. Thanks to my thesis group for letting me know when I had to stop sharing interesting facts and start telling them what I was going to write about, and to all the friends and family without the support of whom this effort surely would not have been possible.
TABLE OF CONTENTS
Chapter One: Introduction 8
Methods and Sources 13
Chapter Two: A Hostile History 14
A Beach Within Reach 14
A Hostile History 19
Barriers to Barriers 24
Marshalling the Marshes 26
A Future Shaped by the Past 27
Chapter Three: The Superstorm 30
Sandy’s Surging Seas 30
Dealing with Disaster 33
Chapter Four: Parcels that Mother Nature Owns 38
Gaining the Governor 41
Reviewing Retreat 43
Chapter Five: A Safer, More Resilient, and Overall More Vibrant Place 48
Beginning to Build it Back 48
Blaming Bloomberg 52
Adjusting Acquisition 53
Questing for Clusters 58
The Affordable East Shore 61
Moving Forward 62
Chapter Six: Planning After Disaster 64
Planning New York 64
Learning from Others 70
Bringing New Orleans Back 72
Room for the Cedar River 78
Chapter Seven: Conclusion 84
What Now? 84
Why Plan? 89
Postscript 98
Notes 100
FIGURE LIST
Figure 1.1: The East Shore of Staten Island 9
Figure 1.2: Post-Sandy Planning and Acquisition Processes 10 Figure 2.1: Staten Island Topography, East Shore Highlighted 15
Figure 2.2: Dutch Settlements 15
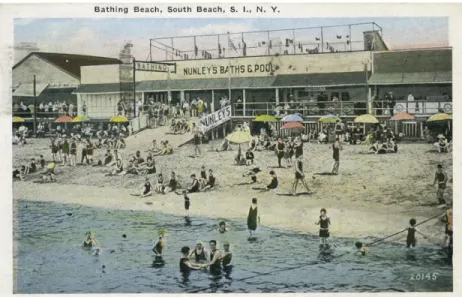
Figure 2.3: Bath House at South Beach 16
Figure 2.4: South Beach, 1917 16
Figure 2.5: Midland Beach Bungalows 17
Figure 2.6: Urbanization in Hurricane SLOSH Zones 17
Figure 2.7: Oakwood in a 1950 Storm 20
Figure 2.8: Rescues During 1992 Nor’easter 20
Figure 2.9: Oakwood After a 1930 Fire 21
Figure 2.10: East Shore Wildfire Incidence 21
Figure 2.11: Below-Grade Ocean Breeze Bungalows 22
Figure 2.12: Proposed Levee and Subsequent Townhouse Development 23
Figure 2.13: Staten Island Bluebelt Watersheds 26
Figure 3.1: Historic Surge Graph 31
Figure 3.2: Sandy Surge Map 31
Figure 3.3: New York Bight 31
Figure 3.4: Destroyed Bungalow 32
Figure 3.5: Sandy Inundation 32
Figure 3.6: Building Damage 32
Figure 4.1: New York State Coastal Risk Map 42
Figure 5.1: South Beach Levee Proposal 50
Figure 5.2: Bluestone Group Model Home Floorplan 50
Figure 5.3: Mayor Bloomberg and Patricia Dresch 51
Figure 5.4: Bungalow Elevation 54
Figure 5.5: Cedar Grove Study Area 55
Figure 5.6: Narrow, Ponded Streets in Cedar Grove 55 Figure 6.1: Map of SIRR initiatives for East and South Shores 65 Figure 6.2: Map of NYRCR initiatives for East and South Shores 67 Figure 6.3: Councilmen Oddo and Ignizio Visit New Orleans 70
Figure 6.4: New Orleans “Green Dot” Map 71
Figure 6.5: New Orleans Recovery Planning Timeline 72
Figure 6.6: NORA Dispositions 76
Figure 6.7: Cedar Rapids Inundation Map 78
Figure 6.8: Cedar Rapids Public Process 79
Figure 6.9: Cedar Rapids Recovery Alteratives 80
Figure 7.1: Coastal Home Values 92
Figure 7.2. South Beach Home Values 92
“Once this area was a popular summer vacation spot… Today it is a stark landscape that looks as if the sea had risen up and swept most of it away.”1
These words were penned by Steven Weisman, a journalist for The New York Times, in April of 1971. He was writing of the Arverne neighborhood, a 50-block stretch of New York City on the ocean side of the Rockaway peninsula in Queens, previously home to 800 or 900 “old wooden bungalows.” Despite Arverne’s beachfront location, however, it wasn’t the Atlantic but the government that had cleared the homes, as part of an urban renewal plan designed to address the area’s substandard housing and infrastructure. In the days, months, and years that followed Superstorm Sandy’s arrival in New York City on October 29, 2012, much the same words could have been written about another corner of New York harbor, some fifteen miles away: the East Shore of Staten Island. The East Shore, an extremely low-lying portion of the Island bounded by Fort Wadsworth to the northeast and Great Kills to the southwest, also first came to prominence in the early twentieth century as a beach resort for vacationing New Yorkers. Thousands of summer bungalows were built in the area; later, many were converted to year-round homes. When the storm came, a devastating combination of the area’s topography, geography, and housing typology made its four neighborhoods—South Beach, Midland Beach, New Dorp Beach, and Oakwood Beach—the locus of some of the most extreme loss of life and property in the City.
Though in this case it actually was the sea that started the job, however, the government would once again play a role in finishing it. In the aftermath of the storm, two parallel, federally funded programs began purchasing homes from East Shore residents who voluntarily chose to move on from the area. One, offered by Governor Andrew Cuomo and the State of New York—the New York Rising Buyout Program—began acquiring properties within three specific, geographically bounded areas, with the proviso that the newly public land be forever preserved as open space. The other, offered by the City of New York under first the Bloomberg and then the de Blasio administration—the Acquisition for Redevelopment pathway of the Build it Back program— acquired properties with the intention to redevelop the acquired parcels as new, safer housing. I began my research by asking the question of why these two separate processes, working toward
CHAPTER ONE:
Introduction
divergent ends, had been established for the East Shore. In doing so, I hoped to better understand the decision to retreat from some areas while reinvesting in others.
The answer I uncovered was deeply political, resulting from a complex series of
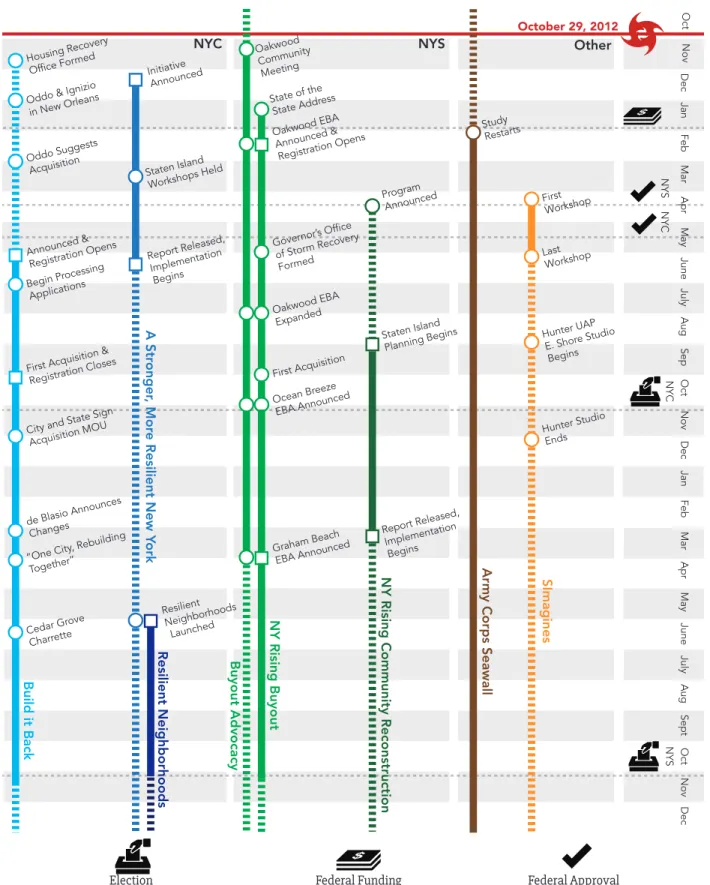
interactions between residents and their elected officials. While the City, State, and outside groups all launched a number of formal planning processes, each of these unfolded largely independently of one another, and the acquisition programs themselves were only loosely affiliated with any of them. Still, their simultaneous progression created a number of key points of conflict and harmony; while for the sake of clarity I will examine each in turn, it is important to remember that in actuality much of this work was developed in response to or competition with alternative programs (see Figure 1.2, following page).
The East Shore is somewhat of an unusual case study in acquisition. The literature on disaster recovery and climate adaptation is replete with studies examining how policymakers might go about convincing or incentivizing residents to consider relocation. Unlike virtually everywhere else in the City, however, many residents of the East Shore needed no convincing, quickly coming themselves to the conclusion that their best option was to leave their homes behind and make a new life for themselves on higher and drier ground. As I chronicle in the second chapter, this decision was due in no small part to a long history of environmental struggles in the area—from wildfires and freshwater flooding to previous hurricanes and the repeated failure of coastal protections to guard against them.
In some cases, these residents banded together to mount a campaign pressuring their officials to provide them with the option of decamping from their former neighborhoods en masse.
Nov Dec Jan Feb Mar Apr May June July Aug Sep Oct Nov Dec Jan Feb Mar Apr May June July Aug Sept Oct Nov Dec Oct Build it Back Housing Recovery
Office Formed
Oddo & Ignizio in New Orleans Oddo Suggests Acquisition Announced & Registration Opens Begin Processing Applications
First Acquisition & Registration Closes
City and State Sign Acquisition MOU
de Blasio Announces Changes
“One City, Rebuilding
Together” Cedar Grove Charrette A Str onger , Mor e Resil ient New Y ork Resil ient Neighborhoods Initiative Announced Staten Island Workshops Held Report Released, Implementation Begins Resilient Neighborhoods Launched Program Announced Staten Island Planning Begins Report Released, Implementation Begins
NY Rising Community Reconstruct
ion First Workshop Last Workshop Hunter UAP E. Shore Studio Begins Hunter Studio Ends SImagines Ar my Corps Seawal l Study Restarts NY Rising Buyout Governor’s Of fice of Storm Recovery Formed Oakwood EBA Expanded First Acquisition Ocean Breeze EBA Announced Graham Beach EBA Announced Buyout Advocacy Oakwood Community Meeting State of the
State Address
Oakwood EBA Announced & Registration Opens NYS NYC NYC NYS
NYC NYS Other
Fig 1.2: Post-Sandy Planning and Acquisition Processes. Build it Back, far left, is New York City’s acquisition program. New York Rising Buyout, center left, is the State’s. Neither was ostensibly a “planning” process, and each unfolded in parallel to the City’s and State’s processes (as well as federal and community or non-profit sponsored processes). Graphic by author.
Election Federal Funding Federal Approval
Finding an initially unsympathetic response from the City, these residents deliberately worked around local officials to have their case heard at the State level. Ultimately, their efforts—combined with the Governor’s conviction that the increasingly visible realities of climate change demanded a rethinking of coastal land use—led to the New York Rising Buyout Program. In other areas interest was more scattershot but local officials, particularly at the borough level, saw in acquisition an opportunity both to meet their constituents’ needs and potentially to achieve significant land use changes of their own, addressing long-standing deficiencies in neighborhood infrastructure and advancing the goals of regularization and de-densification that had been embodied in the Island’s Lower Density Growth Management Area zoning regime prior to the storm.
I begin to delve into this process in the third chapter, covering it in further detail in the third and fourth. In the course of answering my initial question, however, I surfaced others. At least when they were first announced, both of the City’s and the State’s programs made some claim to be working toward an alternative future for the East Shore. The New York Rising Buyout plan was focused on ceding the acquired parcels “back to Mother Nature,” not only to remove residents from harm’s way but to use these re-naturalized areas as a coastal buffer, protecting neighborhoods farther inland or absorbing the stormwater that presents a significant additional challenge to the area.2 According to Staten Island Borough President James Oddo, meanwhile,
the Acquisition for Redevelopment Program was meant not only to provide an opportunity for “folks impacted by Sandy to begin to take back control of their lives,” but also for these residents “to see their home community transformed into a safer, more resilient, and overall more vibrant place.”3 Yet throughout my research, I was consistently told that the programs were, first and
foremost, conduits of financial relief for distressed and displaced homeowners. In this context, land use issues were specifically identified as a secondary goal, if at all. While the rationale for this approach is understandable—with the program’s designers focused on meeting the immediate needs of a disaster-ravaged population—it also has situated both the City and the State in sometimes difficult positions.
As I detail in the fourth chapter, outside of Oakwood Beach, the first neighborhood to be included in the State’s program and the site of the highest rates of participation, working around those who have chosen not to sell may significantly constrain the State’s ability to meaningfully repurpose the area beyond simply allowing natural communities to opportunistically recolonize the land. Further, even if all of the area’s residents were eventually interested in moving, problems would remain: despite launching the buyout at the State level over City opposition, the State has attached no funding for remediation, construction, operation, or maintenance to the parcels, and has no interest in being the long-term steward of the land. Challenges loom in the nearer term, as well. Until the moment if and when all homeowners in a given buyout area agree to sell, servicing these neighborhoods will also represent a significant burden on city resources, as maintaining roads and providing a safe water supply for a limited number of homeowners will become more difficult and expensive. Significantly depopulating the area, meanwhile, removes housing stock from a city in the grips of an acute housing crisis, and may negatively impact remaining businesses and community institutions that depend on a robust local population for support.
Meanwhile, the City’s Acquisition for Redevelopment program has encountered hurdles of its own, which I explore in the fifth chapter. While the has City considered using the tool to enact the kind of community-scale transformation alluded to by Borough President Oddo, a number of issues have stymied this ambition. These range from the necessity for a level of community
participation even less present in the City’s program than the State’s, to the high financial cost and low projected return of demolishing and reconstructing a low-density residential neighborhood in need of major infrastructure investments. Working with individual parcels, however, may be no easier of a proposition. The same historical development pattern that made the East Shore uniquely vulnerable to Superstorm Sandy has left a legacy of small lots and narrow streets that make it difficult to even maneuver construction equipment in the area, let alone fit a legally sized, up-to-code, resilient structure on one of the parcels on which a bungalow once sat. Finally, if these problems were to be successfully addressed, the question of what population this new housing would serve is an open one (one that, incidentally, helped to define the multi-decade struggle to redevelop in Arverne, where “disagreement… focused on the kind of occupants for whom the new housing should be built: families with moderate incomes or those that are more affluent.”)4 The
neighborhood bungalows, despite and in fact at least in part due to their myriad problems, were an affordable typology that defined the area as one of the City’s working class waterfronts. Where lots may be combined or new building and neighborhood typologies devised, it is unclear exactly who will have the means to occupy the resultant development.
In light of all of these challenges, I came to ask two questions in my conclusion. First, looking forward, I ask how some of the negative impacts associated with these programs can be mitigated. Second, looking backward, I ask what role planning can and should play in addressing the intricacies of post-disaster retreat and redevelopment at all. Understanding that these
programs have a dual purpose in furthering both individual and family recovery and broader-scale land use change, I ask: what were the obstacles to giving these longer-term implications their due; how might planning process have played a role in achieving better outcomes, potentially toward both goals; and how can these processes and outcomes be better fostered in the future?
In answering this last question, it is useful to adopt the terminology of the “design moment,” explicated by Jacob Wagner and Michael Frisch in their examination of the physical planning response to Hurricane Katrina in New Orleans. Writing on the many plans that proposed to reshape the city after the storm, the authors describe the design moment as “a period of time in which particular events occur that result in a process of urban restructuring that is physical, social and conceptual… a critical juncture in the history of a city in which the most basic components of a city’s character—its social fabric and urban form—are fundamentally altered [emphasis original].”5 In trying to understand the quality of this moment, the authors explain, “the
language… is revealing: organic growth versus planned districts; piecemeal versus comprehensive reconstruction; the ad hoc versus the orderly; top-down versus local control—the list of
descriptors, while numerous, are often mere synonyms for a binary juxtaposition of the planned versus the unplanned response to urban design and rebuilding in the wake of a disaster.” In reality, however, “the process is often far more nuanced than these ‘either/or’ constructions of the design problem suggest.”6
As I explain in the sixth chapter, which seeks to draw lessons about New York by
comparing the City’s experience with that of others that have undergone significant flood events, the most dramatic initial proposals advocating for retreat from heavily damaged New Orleans neighborhoods failed at least in part because they were top-down, orderly, and comprehensive, deaf to the concerns of marginalized neighborhoods and developed in the absence of their meaningful input. Yet the ad hoc, local process in New York was, as Wagner and Frisch suggest, both not entirely so—as it relied no only citizen activism but competition between different levels
of government and a pre-existing agenda pitting residents in denser, low-lying areas against those in the wealthier uplands—and, though relatively “successful” in terms of program uptake, has generated problems of its own for the residents left behind. Ultimately, drawing in part from the experience of post-flood planning in Cedar Rapids, Iowa, I ask whether a more engaged, participatory process might have helped all parties involved better achieve their goals, and echo Wagner and Frisch’s question of whether “adequate and transparent planning processes [are] ‘too slow’ or just… inconvenient in the context of disaster recovery?”7
It is, I believe, a question worth asking. While immediate needs inarguably take primacy in the wake of a disaster, a hurricane’s imprint on the landscape can reverberate for many
generations past the lives of its immediate victims. “Whether by accident or intention,” as Wagner and Frisch warn, “the decisions made during a design moment can shape the physical form of a city for decades, or even centuries, to come.”8
Methods and Sources
To answer these questions, I relied primarily upon conversations with those involved. I conducted formal interviews with 25 individuals, including: residents of the affected areas; project managers and policy makers for the buyouts and acquisitions and other related projects on the East Shore, such as the Army Corps seawall, Mid-Island Bluebelt, and the SImagines planning process; experts on issues of coastal land use and managed retreat; researchers who have studied the communities of the East Shore after Sandy; and individuals who have overseen similar processes in New Orleans and Cedar Rapids, Iowa. In addition, I had informal or off the record conversations with a number of other colleagues, academics, and professionals in order to further inform my work.
To supplement this information, I familiarized myself with case studies and literature on acquisition and buyout programs, climate adaptation, and disaster recovery; examined the official Action Plans, reports, and speeches associated with the City’s and State’s programs; and combed through dozens of local news articles that provided both factual details and insight into the statements and motivations of policymakers, such as the Mayor and the Governor, with whom I was not able to speak directly. What follows is a synthesis of the facts, opinions, concerns, and aspirations that I gathered from these sources.
A Beach Within Reach:
“A railroad… will develop an enormous Summer-resort travel”1
To understand the present situation of the East Shore, it is instructive to look first to the area’s history. The story properly begins many, many years ago—indeed, millennia ago—in approximately 18,500 BCE. It was at this time that the Laurentide Ice Sheet, a massive glacier that spanned a significant portion of the present-day northern United States and Canada, arrived in what is now New York City. As the Laurentide advanced across the continent, it accumulated soil, rocks, boulders, and other geological debris, transporting this material along with it before depositing it in a heap at the ultimate extent of its leading edge, where its advance was halted. The area of higher elevation that this deposit created—with hills on Staten Island marking some of the highest elevations on the East Coast—is known as a terminal moraine, and it runs through New York in an undulating line stretching roughly from Tottenville in Staten Island to the southern end of Alley Pond Park in northeastern Queens. The glacier sat in this spot, moving neither forward nor back, for approximately 2,500 years. When it ultimately began to retreat, its meltwaters carried material down off the southern slope of the moraine, creating a flat expanse of new land in what had previously been the ocean. This area, known as a glacial outwash plain, underlies much of what today constitutes the neighborhoods of the East Shore. Closer to the coast, some portions of the region lie at even lower elevations—on land that was made not by glaciers, but humans, as builders filled in wetlands during New York’s continual quest to open up new land for development.2
The development of this area can be understood to have occurred in four distinct phases. The first begins with the first European settlement on the Island, which was on the East Shore. In 1661, the Dutch constructed the village of Oude Dorp (Old Town) at present day South Beach.3
For hundreds of years, settlement in the area remained mainly on higher ground or at the edge of the wetlands, and consisted primarily of villages—each their own independent municipality— oriented around fishing, shell fishing, and farming. Toward the end of the nineteenth century, however, as New York City grew, the East Shore, with its unspoiled beaches and woodlands just a
CHAPTER TWO:
A Hostile History
short ferry ride away, entered the second stage of its development: as a summer getaway.
While Staten Island featured hotels and resorts for vacationing New Yorkers as early as the mid-1800s, it was not until the arrival of improved transportation, in the form of the Staten Island Rapid Transit Railroad Company, that they were spurred to the great heights that they would achieve by the early years of the following century. In 1880, the newly formed Railroad Company published a column in TheNew York Times arguing that a lack of efficient overland transit had hampered the Island’s development. While the ferry provided a decent connection to New York at St. George, they contended, “the difficulty has been to provide communication along the east and north shores of the island to save the boats from the expense of doing the omnibus work of delivering the people at the foot of the several avenues.” By following their plan to construct a rapid transit line around the Island’s northeastern tip, along the edge of Fort Wadsworth and down to South Beach, this problem could be circumvented, thereby allowing South Beach to “develop an enormous summer-resort travel, as this beach possesses far greater natural advantages than Coney Island, can be made more accessible, and for still salt-water bathing especially will be much preferred by the thousands who shrink from the rough buffeting of the surf.”4
Bids to build the system were tendered in 1883, and construction began shortly
thereafter.5 The South Beach section of the
line began operation in 1886 and, within a short time, the predictions of the boosters largely came true.6 In 1890, a reporter for The
New York Times remarked that “South Beach, on Staten Island, has grown wonderfully in popularity in the last few years. It is about forty minutes ride… by the Staten Island Ferry boats and rapid transit trains.”7 In the same
year, an outfit organized under the name
Fig 2.1: Staten Island Topography, East Shore Highlighted. Lionel Pincus and Princess Firyal Map Division, The New
York Public Library.
Fig 2.2: Dutch Settlements. Lionel Pincus and Princess Firyal Division, The New York Public Library. Note location
of Old and New Towns on high ground outside of flatlands labelled “Banc de L’Ouest.”
of the South Beach Land Company, Limited, embodied the spirit of the times when they incorporated with the objective to “buy, improve, and sell land in Richmond County, erect docks, wharves, piers, slips, basins, elevators, houses, warehouses, stores, bowling alleys, hotels, a theatre, a clubhouse, a casino, boathouses, a skating rink, grounds for baseball, cricket, lawn tennis, lacrosse, and other outdoor sports.”8 With
these and other development schemes underway, South
Beach soon became a major regional attraction.
In 1899, one year after the five boroughs were unified as New York City, the Southfield Beach Railroad Company was incorporated, with the goal of extending the reach of the rail service and accompanying development from South Beach two miles further south to Midland Beach.9 In 1901, meanwhile,
the Midland Railroad
Terminal Company received a grant from the State Land Board for “about seventy-six acres of land under water at Midland Beach… on condition that people shall have free use of the beach. The company,” read the notice, “is to erect piers, wharves, and buildings”—an early instance of landfill operations in the area.10 By the following year, TheNew
York Times was reporting that more than 7,000 people had visited Midland Beach and 6,000 South Beach on a single Sunday in May.11
As the resorts became more popular, developers also began to buy land for the construction of summer bungalows, where families could spend the night for the season. In 1908, the Reilly Realty Company purchased twenty-two acres in Oakwood with 300 feet of frontage on the ocean to “make a bungalow and tent colony.”12 Nearby, Emiel Fox—for whom present-day Fox Beach, a
section of Oakwood, is named—constructed 12 summer bungalows in 1912. By the 1930s, Fox’s bungalows numbered in the hundreds, and were accompanied by a swimming beach, a pier, a
Fig 2.3: Bath House at South Beach. Irma and Paul Milstein Division, The New York Public Library.
Fig 2.4: South Beach, 1917. Lionel Pincus and Princess Firyal Map Di-vision, New York Public Library. Note South Beach Station, lower left; bungalows camps, far right; and land owned by “Staten Island Beach
hotel, and a dancing pavilion.13
Similar development was
happening up and down the East Shore. In 1930, between Midland Beach, Graham Beach, and Woodland Beach—all owned by one James G. Graham— approximately 10,000 people rented bungalows, and the bungalows at the South Beach colony alone numbered in the thousands.14
Indeed, the period between 1920 and 1930
represents the first major peak of development in the area. In 2010, Professor Alan Benimoff of the College of Staten Island conducted a study of urbanization in Staten Island’s “SLOSH zones”—areas designated by a model of the National Weather Service to be in danger of inundation by sea, lake and overland surges from hurricanes (SLOSH)—a significant proportion of which are located on the East Shore. After construction rates of less than one hundred homes annually in the years 1900 to 1920, Benimoff’s data displays a steep jump to more than a thousand homes built in the
two highest-risk zones of the Island from 1920 through 1929.15
By the following decade this fervor had died off somewhat. Beginning in the 1950s, however, though new construction was still relatively quiet—indeed, perhaps partly due to this fact—a third important phase in the area’s development began. With nationwide housing shortages spurred in part by returning soldiers from the Second World War, families began to winterize the East Shore’s bungalows for year-round use. Many of these homes, never intended to be anything more than seasonal residences, were still housing families up until the time that Sandy struck, passed down from generation to generation and grandfathered into compliance despite their failure to meet modern building and zoning codes.16
The fourth and final phase of development in the area begins in the lead up to, and aftermath of, the opening of the Verrazano Narrows Bridge—the first to connect Staten Island to another borough—in 1964. The Island had previously been linked to New Jersey with the
Fig 2.5: Midland Beach Bungalows. Irma and Paul Milstein Division, The New York Public Library.
opening of the Goethals Bridge and Outerbridge Crossing across the Arthur Kill in 1928, and the Bayonne Bridge across the Kill Van Kull in 1931. Each new opening brought with it speculative purchases and promises of a development boom. In 1928, a typical commentator remarked that “it is almost impossible to predict the scope of Richmond’s future growth. Public officials, business men and realtors,” he continued, “state that the island will have within a few years a population of 1,000,000.”17 When this growth did not materialize, others found the Bayonne connection
likelier “to do more for the real estate market generally than have [the previous two]… because the new bridge is nearer Manhattan and also because it provides the first direct highway between Richmond and Manhattan.”18 As of a 1959 article anticipating the Verrazano, however, the
population of the “semi-isolated” borough still lay out only 191,555. Experts at that time predicted that the forthcoming connection—the Island’s first “quick, convenient interchange with its four sister boroughs”—might induce a tripling of population by 1980.19
While this astronomic level of growth never quite materialized, new development and population gain after the opening of the Verrazano was substantial. Indeed, the population of the Island had nearly doubled by 1980, is now 250 percent larger than the 1959 figure, and increased by twenty-four percent between 1990 and 2010 alone—making it the fastest growing county in the state during this period.20 The scope of the changes brewing were recognized as early as 1966, when
the City Planning Commission released a special report outlining a development policy for the borough. “The need for urgency,” the Commission began in its report, “is apparent. The completion of the Verrazano Bridge, the growth of the Metropolitan Region, the virtual disappearance of vacant land in the rest of the City have all placed great development pressures on Staten Island. These are pressures that will not be stayed. They call for prompt and effective policy measures by the City to insure some rational control over the destiny of our ‘last frontier.’”21
Unfortunately, by all accounts, these policies never arrived. The following 30 years saw a steady climb in urbanization in Staten Island’s SLOSH zones, escalating to a dramatic second peak in the decade between 1980 and 1990, when 1,800 new homes were built in these areas, with 1,200 in the most vulnerable zone alone.22 Between the years of 1953 to 1973, meanwhile, it is estimated
that more than one-fifth of the total wetlands present in the five boroughs in the mid-1800s was lost—an area of 17,000 acres, or approximately one and a half times the size of Manhattan.23
Much of this activity played out in the marshes of Staten Island, with both greenfield development and bungalow tear-downs occurring at a rapid pace. A feel for the changes taking place, and a testament to the growing interest in the area, can be derived from reading a trio of New York Times
articles from the 2000’s, following a decade where the number of housing units on the Island increased by 17 percent.
Profiling Midland Beach in 2011—“Low Prices, Slow Traffic, Copious Sand”—correspondent Joseph Plambeck discusses how renovations to the beach and a new boardwalk helped to spur a development boom in the 1990s, when “developers tore down many of the area’s characteristic bungalows.” This push, according to Plambeck, led to two types of housing stock interspersed throughout the neighborhood, side by side: “small one-story bungalows, often with just one bedroom and built decades ago, and two-story brick semidetached homes or town houses built much more recently, many in the last 10 years.”24 Meanwhile, at South Beach in 2009—“Why Ask
for the Moon? They’ve Got the Beach”—Plambeck reiterated that “it was about 10 years ago that developers stepped in, replacing much of the housing stock of small bungalows with two-family colonials or town houses” and that “the changes in the later ’90s caused home prices to jump.”25
Further down the beach in Oakwood in 2002—“Oakwood, Staten Island: City Streets, Country Feel, and a Beach”—another reporter describes how “old summer bungalows winterized for year-round living are being torn down for town houses,” 250 homes had been built in the low-lying areas over the previous 5 years, and the price for a three-bedroom house in the neighborhood had nearly doubled over the same period.26
Around the same time—in the face of the rapid redevelopment described above— Mayor Bloomberg convened a task force to study overdevelopment in Staten Island, concerned not primarily with flooding or the low-lying areas in particular but with the preservation of neighborhood character throughout the island, as well as the new development’s impact on infrastructure and quality of life. In 2004, the team’s recommendations were adopted as the Lower Density Growth Management Area (LDGMA), a zoning overlay covering the entire island that attempts to reduce density and control growth primarily through higher site design and setback standards.27 By this time, the real estate market had also already cooled somewhat, at least on
the East Shore. While the changes wrought in the prior decades were widespread, by the time Superstorm Sandy arrived 62 percent of the housing stock in the area had still been constructed before the opening of the Verrazano in 1964.28
Moreover, despite the increased interest, the underlying problems of the East Shore hadn’t changed. Before going on to detail the local schools and transportation options, the 2002 Times
article on Oakwood Beach takes the time to note that “throughout the years, the beach area has often been plagued by flooding, but in the past two years the problem has been addressed. The Army Corps of Engineers replaced a berm that was eroding and planted trees and bushes, and it repaired floodgates near the sewage treatment plant.”29 Of course, the area’s coastal protections
would prove inadequate to guard against the unprecedented levels of storm surge that came with Superstorm Sandy—even a smaller storm in 2010 brought up to two feet of flooding above grade (and reports of six feet of flooding in basements) to Oakwood—and the majority of the other East Shore neighborhoods had barely any protection at all.30 Indeed, even at the time of their
construction the repairs of the early 2000s were viewed as a temporary fix, and even this limited measure took years of chronic flooding and advocacy to attain.
A Hostile History:
“When it was wet, they would flood, when it was dry they would burn.”31
The environmental drawbacks of habitation on the East Shore have been known for some time. As early as 1871, a special commission decrying the slow growth of Staten Island compared to other New York suburbs released a “Report of a Preliminary Scheme of Improvements,” suggesting an elaborate but never realized plan for the drainage of the low-lying marshlands in an effort to eradicate malaria.32 The first, and most obvious, challenge was acute flooding. Among the earlier
instances in the bungalow colony era, a major storm struck the area in November 1932. An article in TheNew York Times detailing the damage sustained in the borough prefigures the tribulations the Island would experience during some 80 years later, stating that “Staten Island, parts of which were more exposed to the battering of the heavy surf than was Manhattan, suffered more than the other boroughs.”Focusing specifically on the East Shore, the article relates that “thousands of Summer bungalows at South, Midland, New Dorp, Oakwood and Great Kills were flooded and badly damaged… and at Midland Beach, the lowest shore-front section on the island, twenty-eight
families, including many women and children, were rescued in rowboats and by mules and trucks early yesterday morning.”33 Three
years later, another November storm flooded hundreds of
bungalows at Midland Beach, with “half a dozen of them… in danger of being washed away” and the police once again rescuing families from their homes.34
In 1950, again in
November, fifteen hundred East Shore families were rescued from flooded homes, after a storm surge left water standing between two and six feet deep in the colonies. This time, as a New York Times
article surveying the damage explains, “the center of the trouble appeared to be at Ocean Breeze where 300 families were occupying small dwellings.” The report goes on to call attention to the winterization phenomenon, as well, noting that “many of the thousands of cottages along the shore were unoccupied, but others had been insulated and equipped with furnaces for winter living because of the housing shortage.”35 Similar events requiring
evacuations of 700 people or more occurred in 1953 and 1955.36 In a
more contemporary example, the rowboats were brought out once again to rescue desperate families in Oakwood Beach after a Nor’easter in 1992, and, particularly given damage to coastal defenses sustained during that storm, significant flooding came to Oakwood again in 1994 and 1996.37
As if this were not enough, the area is also prone to devastating wildfires. As human development has moved into wetland areas of the Island, so has the Phragmites australis, an invasive Eurasian reed species that was brought from Europe to New York in the late 19th century.38
Over time, the plant has steadily been crowding native wetland vegetation out of its former habitat, with the help of the degradation and fragmentation associated with increased development. Once established, the reed can grow up to 20 feet tall; during dry periods, Phragmites stands provide an
Fig 2.7: Oakwood in a 1950 storm. “Scenes from the Metropolitan Area,” 1950.
extraordinary quantity of fuel just waiting for a spark.
Major fires were reported on the East Shore as early as 1930, when a May blaze burned 82 summer houses in the area and scorched another 200, with “only a shift of the wind in the late afternoon sav[ing] 3,500 bungalows at South Beach and Oakwood Beach.”39 In the wake
of a three alarm fire in the area in 1931, meanwhile, firemen reported that “boys caused such outbreaks every Saturday during the dry weather.”40
Thousands of smaller or larger outbreaks of fire have been documented over the intervening years—including 103 serious, multiple-alarm brushfires between 1996 and 2010—and the entirety of the East Shore has been designated a high risk area subject to a coordinated City, State, and Federal Community Wildfire Protection Plan.41 In the space
of three months in 2010 alone, a six-alarm fire burned for eight hours in Great Kills park; a
five alarm fire burned 100 acres of in
Oakwood; and smaller fires broke out in Midland and New Dorp Beaches. In each of the first two instances, nearly 250 firefighters responded before the blaze was brought under control.42
At the same time, many areas of the East Shore struggle on a continual basis not from these acute and extreme events but from chronic flooding due to moderate rainfall and tidal action, without storm surge playing a significant role. While this issue was being discussed publicly as soon as significant development existed in the area—in 1937 a group of residents around New Creek, in Midland Beach, complained that neighborhoods were being “inundated when strong easterly or southeasterly winds blow”—it is widely held that the scale of the problem was
intensified with the explosion of development in wetland areas around the time of the construction of the Verrazano Bridge.43 This is due not only to the fact that new construction has placed more
people in low-lying areas, but that it has often actually exacerbated the risk for pre-existing homes Fig 2.9: Oakwood after a 1930 fire. “Scenes in the Areas,” 1930.
14 Ma p 2 --Fire O cc urre nc e Ma p.
Fig 2.10: East Shore Wildfire Incidence. Community Wildfire Protection Plan.
as well, pushing water off of new, raised roads and home sites onto these parcels.
This problem was recognized in the City Planning Commission’s Staten Island Development report of 1966, in which the commissioners remarked that “flood plain and drainage problems are particularly apparent in the Graham Beach, Midland Beach, and Oakwood Beach areas. These difficulties are exacerbated when homes which are built below the finally approved grades are threatened by run-off from legally conforming streets.”44 The City was itself facilitating the
development boom that spurred this problem, however, having sold 37 acres of “swampy land” that had been acquired in rem in Oakwood Beach at auction in 1959 and another parcel of similar size again in 1965—with a more than fourteen-fold increase in price per square foot that the land commanded between the two sales.45
While the Commission did recommend and end to City “sales of land which is substandard (marshy, etc.) and which would incur high public costs to service,” and took the position that “every effort must be made to develop a drainage system on the marshy east shore that will protect existing development which was built below grade,” they also recognized a perception that
would haunt the City’s dealings with the Island through to the present day, and would become particularly palpable in the wake of Superstorm Sandy.46 “In the scale of things,” the report’s
authors wrote, “the Staten Island development problem is not the single most important issue confronting the City of New York at this time. It cannot be assigned unlimited fiscal and manpower resources, nor should it. If it is to be dealt with along with the City’s other massive problems, it would have to be assigned a priority too low to be of any effective use.” They recommended, instead, that a local body be appointed to oversee the development problem, headed by the new office of Staten Island Development Coordinator.47 It does not appear that this position was ever
created.
Of course, since the sixties, the issues in the area have only been magnified. In some areas, the problem described by the Commission—with streets actually above the grade of the homes that front them—is quite a visible demonstration of the impact of continued development. In others, new construction has affected existing properties in a less immediately noticeable way, by creating higher burdens on existing stormwater drainage systems and decreasing the
naturally absorptive power of wetlands. The New York Rising Community Reconstruction (NYRCR) Plan for the East and South Shores of Staten Island, a State-initiated resiliency planning effort inaugurated after Sandy, identified five key factors that made the area so particularly vulnerable during the storm, of which the aforementioned problems were two. The report cites the impact of “development in wetlands and areas that would have served as natural drainage Fig 2.11: Below-Grade Ocean Breeze bungalows. Author’s Photograph.
reduced the ability for the landscape to absorb storm and flood waters.” In addition, the authors explain that “storm drain systems are inadequate or non-existent in many areas.” This is due at least in part to the fact that “rapid development and lack of planning during a period of extreme growth led to overdevelopment across Staten Island,” meaning that “while new homes were constructed infrastructure did not—and in most cases has not—kept up with pace of new development.”48
Some, like planner and economist Professor Jonathan Peters of the College of Staten Island, a blame the City for a lax regime of oversight in allowing vulnerable parcels to be developed, contending that “smaller development on parcels [in sensitive areas] often slipped under the radar,” “developers were often granted variances to facilitate construction,” and “the tangle of federal and state law, and city code was difficult to interpret and enforce.”49 In 2005, when a City
official with the mayor’s office visited Oakwood, he found issues at least with this enforcement component, discovering “obvious” evidence of wetlands being filled in contravention of State law.50
Former Department of Environmental Protection Commissioner Albert Appleton has remarked on this phenomon, as well, contending that the marshy areas of the East Shore were “aggressively targeted by home developers in the seventies and eighties,” who built septic tanks for areas that were not served by sanitary sewers despite the high water table and adopted a policy of “build first and pay a fine later” in response to ineffectual enforcement of freshwater wetland regulations from the New York State Deparment of Environmental Conservation.51
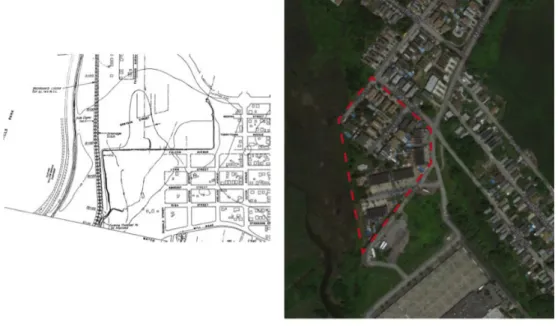
Whether or not the regulations were properly calibrated and enforced, however, for many years the City was not even following the recommendation in its own report of 1966 suggesting that it cease making flood-prone, city-owned land available for development; in 1997, the City sold off a wetland parcel in Oakwood Beach to a developer of townhouses. As Appleton recounts, this was common practice—the city “routinely sold land to developers without environmental restrictions, anxious for the revenue from such sales and also believing that promoting residential development on Staten Island was a way to keep middle class families in the City.” 52 This parcel was not only
just another piece of marshland reclaimed for development, however, but lay in the path of a
Fig 2.12: Proposed Levee (left, Schuerman, 2013) and Subsequent Townhouse Development (right, Google Maps), with Parcel Outlined.
proposed U.S. Army Corps of Engineers levee to protect the neighborhood, which was scrapped after the development was approved.53 This brings us to the third vulnerability identified by the
NYRCR report, beyond the unique circumstances of the storm’s path, timing, and intensity and the approximately one and a half feet of sea level rise that had occurred over the past 200 years: “inadequate... [and] discontinuous natural and manmade coastal protection systems along the shoreline.”54
Barriers to Barriers:
“A report would be published soon.”55
The issue of structural flood protections for East Shore communities has been one of continuing debate and scattershot implementation—starting studies, stopping studies, building temporary protections, enacting temporary repairs to temporary protections—for the better part of a century. Locals were petitioning the Army Corps for flood protection around New Creek in Midland Beach as early as 1937. “Houses have been built in the territory between South and Midland Beaches and inland from Garretson to Grant City in terrain which the engineers consider a tidal flat,” a report on the hearing explained. “Some of the flat has been filled in, but most of it is lowland and is inundated when strong easterly or southeasterly winds blow.” In a response that would become all-too-familiar to residents of the area in the ensuring decades, the article summarizes the Army Corps’ response in one sentence: “Major Hyde said that a report would be published soon.”56
Comprehensive planning began in earnest in 1954, when, after a series of damaging storms, the Army Corps began studying coastal protections for several areas of the New York City shoreline. After a reinvigoration following 1960’s Hurricane Donna, the Army Corps released its first comprehensive report on the East Shore in 1964, recommending a 15-foot levee for Oakwood Beach and Midland Beach, as well as a less intensive set of dunes, levees, and jetties for the entire thirteen-mile stretch of the East and South Shores fronting the Atlantic, between Fort Wadsworth and Tottenville. With no action taken, however, the Corps revisited the issue in 1976, this time recommending that the full levee be extended north from Midland to Fort Wadsworth, encompassing the entirety of the East Shore.57 In the depths of the financial crisis that gripped New
York through much of the 1970s, however, the City was not interested in providing the 10 percent contribution toward the cost of the project that the federal government would have required, at a cost of $2 to $3 million.58 Renewed funding did not arrive until 1995, and the process to update
the study did not begin before 2000. The new study’s target completion date was initially set for 2004, but later pushed back to 2006. According to Corps spokesperson Chris Gardner, however, that year funding came to “a complete grinding halt,” before the study could be completed. The study received new funding in 2008 and further funding from the federal stimulus in 2009, with a target release date of 2013.59 Finally, with the infusion of federal funds disbursed in the wake of
Superstorm Sandy, it seems the study has received enough support and attention to be completed. A draft version of Phase I, covering the East Shore, is due in the spring of 2015, with a final version slated for release a year later. What’s more, the necessary funds to construct the project have already been allocated at both the national and local levels (an estimated cost of $500 million, with 65 percent funded by the federal government and 35 percent split between the City and the State).60 In the interim, the Army Corps has used disaster recovery funding to build a temporary
berm along the entire beachfront of the East Shore, completed in 2013.
With the promised comprehensive solution proceding in fits and starts at best prior to Sandy, communities have attempted to receive more localized protection. Thanks in part to vocal local advocates, Oakwood has constructed more than most; still, however, its residents’ struggles are illustrative. In August 1955, with Hurricane Connie looming and concerns about erosion that had already occurred at the beach, Staten Island Borough President Albert Moniscalco ordered the construction of a ten-foot-high, mile-long “sand dike” at the end of Kissam Avenue. While the barrier survived that storm, however, it failed two months later, sending flood waters surging into 200 homes. In a press conference following the breach, the Mayor said that the city “would seek to solve the Oakwood Beach problem both on a temporary and a permanent basis… [and confer] on the possibility of getting state or Federal funds, or both, for the permanent job.”61
By 1992 the neighborhood had received a timber seawall, but the structure was destroyed in that year’s nor’easter. In the wake of the storm, the neighborhood officially organized its first flood advocacy group, the Flood Victims Committee, actively lobbying to receive better protections. Though a plan to replace the damaged seawall in response to this pressure was in the works as early as 1995, however, the original scope of the project, after many delays, had to be revised after the City’s aforementioned sale and the subsequent development of the parcel.62 Meanwhile, the
same nor’easter damaged the modern descendant of the Kissam Avenue sand dike and another nearby sea wall at operated by the Parks Department, and they were degraded further by a storm in 1996. These latter facilities were rebuilt, and the dike raised, in the late 1990s; around the same time, the Army Corps began construction on the nearby 780 foot long, 10-foot high levee to serve as a temporary solution to the breach of the other sea wall, which was completed in 2000. In 2009, however, one of the area’s brushfires, burning 40 acres, set the Parks Department’s wall ablaze.63
In 2010, before the Department was able to repair the structure, a March storm sent waves both through the holes that had been seared through the structure and over the sand dike, causing up to two feet of flooding in Oakwood. Finally, on October 26, 2012, the Staten Island Advance Editorial Board published an article applauding two local councilmen’s recent success in including funding for a revetment and beach grass
plantings to replace
in the 2013 municipal budget for the Parks Department. With $500,000 allocated, the project was scheduled to be completed in the spring of 2014. Superstorm Sandy arrived three days later.64
Marshalling the Marshes:
“The only viable solution to Staten Island’s chronic flooding problems.”65
In this history of overdevelopment, environmental challenges, and struggles to obtain adequate infrastructure, however, at least one program does stand out—an award winning and oft-cited model for sustainable development known as the Staten Island Bluebelt. The Bluebelt’s fundamental premise is simple. As Albert Appleton, the DEP Commissioner who inaugurated the program, put it: “nature has been managing floodwater successfully for a long time.”66 Under this
premise, the Bluebelt program identifies wetland parcels critical to a given watershed, purchases them if they are not already under city ownership, preserves or restores them, and directs
stormwater runoff into them—after routing it through “best management practices,” or BMPs, that reduce the velocity of the incoming flow and help to remove contaminants before they enter the natural system.
Appleton was appointed Commissioner of the New York City Department of Environmental Protection in 1990, a time when “Staten Island was in an uproar over residential flooding in newly developed neighborhoods, but the cost and time required to provide all of those neighborhoods with traditional storm sewers would have been prohibitive,” partly because the Island’s low-density development pattern produced much less water and sewer tariff revenue than it cost to service the borough. Fresh off his experience assisting with the development Staten Island Greenbelt, a popular program that had preserved sensitive areas in the Island’s heights, and influenced by work that both Ian McHarg and Frederick Law Olmsted had done examining
ways that the Island’s many ecological assets could be integrated with human development, Appleton proposed the Bluebelt program soon after being
appointed.67 Appleton may or may not have
been aware that his idea was not entirely new. The Planning Commission’s “Policies, Programs, Priorities” report seems to have alluded to a similar concept 24 years earlier, when a special study was undertaken by the Borough President to determine if “other means to handle the natural run-off can be substituted for conventional storm sewers in these [East Shore] areas… [in which] it may prove possible to create natural drainage ponds which might have recreational features as well.”68
In this case, things moved remarkably quickly. Starting on the South Shore, a quite favorable cost-benefit analysis was Fig 2.13: Staten Island Bluebelt Watersheds. New York City
completed on a test watershed, and approvals were granted on the first pilot project that same year. Within three years, DEP had purchased many acres of privately held, vacant wetland parcels, and the system covered the watersheds of three different stream corridors. Today, the vision for the natural drainage network of the South Shore is completely built out.69 Compared to
the coastal protections, there are a number of reasons why this a solution to chronic, stormwater flooding may have been achieved more quickly. Chief among these are likely the much smaller scope and cost, more amenable to an incremental approach; and the ability to proceed with local jurisdiction and funding, without relying on the federal government. Important, too, however, are the environmental preservation achieved as a side benefit of the project and, as per Appleton, the widespread support of local residents. According to Professor Peters’ report, both of these last two factors had played a role in slowing the progress of coastal protections—as environmental groups and residents alike had registered objections to elements of the 1976 Army Corps plan.70
Work to expand the system to the East Shore, however, has progressed more slowly. Planning for this section of the network—dubbed the Mid-Island Bluebelt—began approximately 10 years ago and, once complete, would encompass three discrete projects in the Oakwood Beach, New Creek, and South Beach watersheds. As Dana Gumb, who was recruited from the Department of City Planning to implement the Blubelt program in its inaugural year and remains its director to this day, explains it, while eminent domain was used to acquire the properties on the South Shore, that has become much more difficult for the Mid-Island project. “It was so much easier to buy property down here [on the South Shore],” he related. “We condemned it, we took it by eminent domain, there was a reasonable settlement, and people got their money and everybody was happy. Here [on the East Shore]—I don’t know what happened, whether attorneys… got involved. It’s become very difficult, the prices are going through the roof… So we’re trying very hard to do as many negotiated sales as we possibly can.”71 Like the Army Corps study, the Bluebelt expansion
has been reinvigorated in the wake of Sandy. Though it serves primarily to protect from freshwater flooding, which was not a significant issue during the storm, it has been tied into both the renewed levee proposal and, as I will explain in the next chapter, the acquisitions and buyout programs rolled out to East Shore homeowners.
A Future Shaped by the Past
The East Shore’s history has loomed large in the wake of Superstorm Sandy—determinitive, in many ways, of both the path that recovery in the area has taken thus far and the options
available to residents of the region moving forward. Perhaps the most oft-cited of these influences is the area’s prior experience with both daily environmental struggles and periodic disaster. Both in the literature on retreat generally and in observations about the situation on the East Shore in particular, many contend that a prior history of repetitive loss is and was instrumental in shaping residents’ willingness to consider and even advocate for acquisition. The past plays an important role in the story in others ways, too, however.
The area’s history as a summer bungalow colony not only contributed in large part to its vulnerability to the storm—as older, wooden structures were especially at risk citywide—but continues to shape the landscape of potential interventions in the region, as the small lots, poor infrastructure, and narrow roads that are a legacy of the resort era have in many cases placed severe limits on the redevelopment options available. One route to surmounting these constraints,
currently being considered by the City, is to attempt to combine lots to build larger, more resilient housing typologies. Here again, the past is a reminder: as much the same time of typological change, and associated demographic change, was being driven by the private market in the area throughout the 1990s. Some at the City have accordingly expressed the belief that, years from now, Sandy may not ultimately be seen as a major inflection point for the fabric of the East Shore, as any lot combination and typological change undertaken by the City as part of the recovery process will simply be an extension of the market-driven processes that had already begun decades prior. Moving forward, however, it will be important to consider whether the government should be actively contributing to this process, and whether there is any way to achieve a balance between resiliency, affordability, and neighbrhood stability.
In looking to the past, it is also worth noting that despite the myriad environmental challenges described in this chapter, it would be unfair to characterize the East Shore’s residents as foolish for having put themselves in harm’s way—a narrative that can often be promulgated in conversations about post-disaster redevelopment. Many of the area’s families have been in their homes for generations, and as many came to the area out of a desire to live by the sea as were driven there by a quest for the cheapest housing available. What’s more, over the years residents have been proferred plan after plan promising to address the situation.
As a final point, that these plans and others never materialized is important to remember in the post-Sandy context, too. One of Staten Island’s nicknames is the “forgotten borough,” and its residents have long felt aggrieved by their relationship to the rest of the City and its government. As explored earlier in the chapter, the 1966 Planning Commission report referred to the Island as the “frontier” and, despite the special attention being paid to the borough for the duration of the study, the Commission clearly stated that “if it [Staten Island’s development problem] is to be dealt with along with the City’s other massive problems, it would have to be assigned a priority too low to be of any effective use.” One of the borough’s representatives in the State Senate, Andrew Lanza, has summarized the feelings of many in describing Staten Island as “get[ting] the short end of the stick, year after year, decade after decade.” This is because, he contends, “being the smallest part of a large city, we always have to settle for crumbs. The focus is always on the other four boroughs. We have to fight twice as hard to get half as much.”71
Such sentiment drove Islanders so far as to hold a referendum on secession from the City, in 1993—which passed by a 2-to-1 margin. This adversarial relationship played and continues to play a role in residents’ perceptions of the recovery options available to them and their neighborhoods after the storm. According to some I interviewed, a lack of faith in ongoing support from City government was a motivating factor in some residents’ decisions to consider acquisition. Mistrust of the City has also played a role in how the City’s recovery program, Build it Back, has been received, and helped to exacerbate intergovernmental tensions between the City and the State. All of these issues, and others, will come to light in the chapters to come, as I begin to examine the damage wrought by Superstorm Sandy and the government’s response.
Sandy’s Surging Seas:
“The biggest wave I’ve ever seen starts coming, I started screaming, and water started coming into the house.”1
Superstorm Sandy struck New York City on October 29, 2012. While the hurricane crippled much of the region, some areas were impacted much more heavily than others—with the East Shore among the most thoroughly devastated. The historical development patterns and environmental factors outlined in the previous chapter, including these neighborhoods’ older buildings, low-lying topography, and general lack of adequate coastal protections, all contributed to the storm’s destructive impacts. So, too, did a combination of Staten Island’s geographical position within the New York Bight and Sandy’s particular timing and path as it made its way ashore. Though previous hurricanes had brought more rain and stronger winds to the City and the Island, Sandy’s storm surge—an elevated water level created by high winds piling water on top of a “bulge” in the ocean created by the low atmospheric pressure under the storm’s eye—was unprecedented, and catastrophic.
While most Atlantic hurricanes travel along the Eastern Seaboard parallel to the coastline, Sandy blew into New York Harbor almost entirely perpendicularly, an extremely rare trajectory calculated in one study as likely to recur only once every 714 years. Several factors combined to shape this unusual path, including an adjacent weather pattern preventing the storm from dissipating out to sea and a shift in the usual course of the jet stream that drove the system inland. The resulting angle of approach put the New York area in line with the massive storm’s northeast quadrant, where forward movement and internal wind speed combined to create the greatest amount of surge.2
Like many of the City’s hardest-hit areas, the East Shore is directly exposed to the Atlantic Ocean, and thus was bared to the brunt of the storm as it travelled directly inland. In addition, Sandy arrived at the peak of both the daily and the monthly tidal cycles of the Atlantic in New York Harbor, with water levels up to five and a half feet higher than the average low tide on top of background sea levels that have already risen a foot since the early 1900s due to climate change.3
CHAPTER THREE:
The Superstorm
As a point of comparison, high tide in the Atlantic corresponds with low tide in Long Island Sound—a fact that helps to account for the lesser level of devastation seen in vulnerable neighborhoods of the Bronx, northern Manhattan, and northern Queens relative to Staten Island, southern Brooklyn and Queens, and lower Manhattan.
What’s more, the peninsulas of Sandy Hook, New Jersey and Breezy Point, Queens create a funnel in the Bight that directs waters from the open ocean directly to the East Shore, increasing the height and intensity of the surge as it moves through the narrowing and increasingly shallow Lower Bay.4
All of these factors combined to make the East Shore—an already geologically and socially vulnerable area—the site of some of the greatest levels of storm surge in the City. While Sandy’s historic levels are usually reported at 14 feet, this is the reading taken from the gauge at the Battery, in lower Manhattan. In the waterways off of Staten Island, surge levels were reportedly up to five feet higher.5
This massive surge brought intense waves and coastal flooding to the East Shore, resulting in extensive loss of life and property. Overall, Staten Island saw the greatest proportion of its residents impacted of any of the five boroughs, with 16 percent of the population residing in the inundated area.6 Twenty-three
of the fatalities attributed to the storm occurred on the Island and seventeen of these, representing nearly 40 percent of the City’s total,
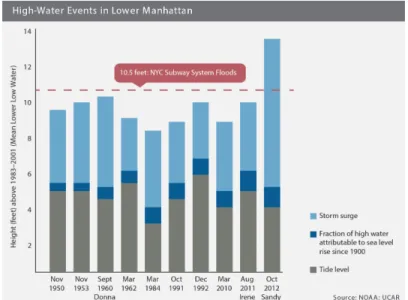
Fig 3.1: Historic Surge Graph. Special Initiative for Rebuilding and Resiliency, 2013.
Fig 3.2: Sandy Surge Map. Special Initiative for Rebuilding and Resiliency, 2013.