%NVUEDELOBTENTIONDU
%0$503"5%&
%0$503"5%&-6/*7&34*5² -6/*7&34*5²%&506-064& %&506-064&
$ÏLIVRÏPAR $ISCIPLINEOUSPÏCIALITÏ
0RÏSENTÏEETSOUTENUEPAR
4ITRE
%COLEDOCTORALE 5NITÏDERECHERCHE
$IRECTEURS DE4HÒSE
2APPORTEURS LE
MEMBRES DUJURY:
Institut National Polytechnique de Toulouse (INP Toulouse)
Sciences de la Matière (SDM)
Influence of the Processes Parameters on the Properties of The Polylactides Based Bio and Eco-Materials
Influence des paramètres de procédés sur les propriétés et éco-composites à base de polylactides
vendredi 22 juillet 2011
Arfan Ul Haq SUBHANI
Science et Génie des Matériaux
Professeur E. BADENS, Pr. Université Aix-Marseille B. CHARRIER, MC. Université Pau
Professeur A. LAMURE
Centre Interuniversitaire de Recherche et d'Ingénierie des Matériaux
E. BADENS, Pr. Université Aix-Marseille, Rapporteur B. CHARRIER, MC Université Pau, Rapporteur M. VERT, Dr. Université Montpellier I, Examinateur
N. LE BOLAY, Pr. INP Toulouse, Examinateur V. SANTRAN, D.G. ICELLTIS, Examinateur
“It is not difficult really- The secret is in knowing how”
(Edward Leedskalnin)
Dedicated to My Father and Mother
&
My Wife and Sons
Acknowledgements
There are many who have contributed in small and large ways to the completion of this dissertation and to whom I give special thanks for what they have given and what I have learned from them.
I thank my Lord and Savior for his grace and mercy that has blessed me since before I was born.
The research subject of this thesis was performed in the laboratory Institute Carnot - Centre Interuniversitaire de Recherche Ingénierie Materiaux, the team " SURF / Surfaces : Réactivité-Protection. I am first of all very grateful to Francis MAURY, Director and CIRIMAT Raja Chatila, LAAS director, for having me in their respective laboratory.
I wish to thank Francis and Alain for welcoming me in their team and for offering me this PhD exciting subject. I am deeply indebted to my supervisor Prof. Alain Lamure, who provided me an opportunity to perform this work and for his constant support, guidance and fellowship to carry out this Ph.D thesis in his supervision, and also for helping me to have better perspective in my scientific thinking. Alain, thanks for giving me your trust. Thank you for the freedom that you left me appropriating for this research topic and for your support in all circumstances. Thank you also and especially for your friendliness and the way you always focus on human relationships. I would like to express my deep appreciation for his availability even passing through a critical health condition, many valuable suggestions and discussions that led to the progress and my personal growth. Francis, I want to thank you for the advice you've provided throughout three and half years.
I would also like to express my gratitude to my two informal co-supervisors present in the jury:
first, Veronique SANTARN, DG ICELLTIS, allowed me to work with her and expand my knowledge in tissue engineering biotechnology. A lot of thanks, not only to participate in my thesis committee but also for her widespread availability throughout the thesis tenure. Thank you for your help, your invaluable advice, your encouragement, time and resources you have spent. I take along a part of your optimism. On the other hand, Nadine LE BOLAY, professor at LGC, who introduced me into the world of powder technology and size reduction processes in a very active way, consulting has always been welcome.
None of this research would have been possible without the financial support of Higher Education Commission of Pakistan and CNRS Toulouse.
I would also like to thank those who agreed to judge my work:
Ms.Nadine LE BOLAY, professor at Université Paul Sabatier, Laboratoire de Genie Chimique for her interest in this work and to honor us by accepting it to chair the commission thesis,
Ms Elisabeth BADENS, Génie Chimique Génie des procédés and Responsable Equipe Procédés &
Fluides SupercritiquesUniversité Paul Cézanne (Aix-Marseille III) for the interest in this work by agreeing to be reporters,
Mr.Bertrand Charrier, Maitre de conférence, at Universite de Pau et des Pays de l'Adour, for agreeing to review the manuscript.
I express my gratitude to both the reporters, for their interest in this work whose memory critically and benevolent permit to improve the content.
A lot of thanks to all individuals, with those I had worked in CIRIMAT, LGC and LAAS for their instant help and kindness. This work was mainly carried out within the SURF team. I want to express how
pleased I was to work with all members of SURF team, I am very grateful to the permanent (Constantin VAHLAS, François SENOCQ, Alain GLEIZES, Nadine PEBER, Corinne Lacaze-DUFAURE, Claire TENDERO, Maelen AUFRAY, Diane SAMELOR, Daniel SADOWSKI) and all other non-permanent doctoral students.
The geographical position of my office also allowed me to mix several PPB and MEMO team members and enjoy their support as a scientific point of view that morale. In this team I really enjoyed the discussions with Christian REY, Christèle COMBES, Christophe DROUET, David GROSSIN, Olivier MARSAN, Gerard DECHAMBRE, Cedric CHARVILLAT, Françoise BOSC, Dominique BONSIRVEN. I thank them for their availability in the daily routine. In this team, I also express my sympathy to Solène TADIER, Ahmed AL KATTAN, Imane DEMNATI and other members for their friendly guidance.
Within CIRIMAT, I also had the opportunity to be in contact with members of other teams at different floors. I want to thank them for their cordial welcome and assistance Bernard VIGUIER, Jacques LACAZE, Christine BLANCK, Jeanne Marie ALCARAZ, Aline PERIES, Christine Marie LAFONT, Dominique POQUILLON, Julitte HUEZ, Djar OQUAB, Eric ANDRIEU, Jean-Claude SALABURA, Ronan MAINGUY, Yannick THEBAULT, Alexander FREUND and many researchers and students. Thank you to for your availability and efficiency whenever I need you in difficulty. I will never forget the beautiful moments
I shared with my friends at CIRIMAT during these 3 years especially useful discussions with Ahmed, Lyasin, solene, and many others. I thank you for useful discussions and the interaction we shared on a daily basis. My abilities as a researcher and professional have grown from working with all of you. I have made many valuable friendships during my stay in the SURF group. I would first like to say a great thank you to Jaime Puig-Pey GONZÁLEZ and Christel AUGUSTIN, Lyacine ALOUI, Guilhaume BOISSELIER, Sabrina MARCELIN and Aneesha VARGHESE. I was also well received and much learned in the lab than at home. I really appreciate your friendship and I keep firmly in mind that "we can get in the way of happiness." It will not be fair to mention here Revathi BACSA who had always provided a moral support in difficult situations during my stay in laboratory.
During my experimentations in LAAS, my work would not have been possible without the unconditional support of the clean room team, and more particularly Laurent RABBIA and Vincent PERRUT, Their cooperation helped me working with supercritical equipment. In LGC, I would be thankful to Séverine CAMY and Jean-Stéphane CONDORET for facilitating and helping in conducting the foaming process on supercritical CO2 pilot plant. Their technical knowledge and skill enhance my abilities while working on this system.
I was also very pleased to have participated in the supervision of several projects of engineering students in ENSIACET: Selmi Erim BOZBAG, Sandrine AUSSET, Tristan DESPLECHIN, Arnaud VIEYRES, Rodrigues TIAGO, Capdevielle MARION, Hochman LÉA, Pasco OLIVIER, Alexandre FRANCOIS, Cyril BESNARD, Sophie RISSE, Erika Martínez PÉREZ and Nora GALLEGO LEIS through their internship on various projects related to polymers and foaming. Moreover, I want to thank all of INP, ENSIACET, LGC, LAAS and more especially Claude, Max, Sylvia, Ahmid, the guys in the shop, cleaning women for their hospitality, their friendliness and good humor.
Special thanks to Usman ASHRAF, Rameez KHALID, Umer HAYAT, Nadeem MIRZA and Muhammad ILYAS for your hospitality in Toulouse and moments of relaxation and discussion I had the pleasure to share with you. Rameez and Usman offered me a piece of "Sooth" when I came here and I look forward to see you again and to collect more in the coming years ...Ali, Saad and Umar Farooq, I
appreciated your availability and the time we spent talking, to think or laugh. Passing time with you has been a pleasure and I learned a lot of your experience. A very special recognition to Adeel AHMED for his solving the software problem during my thesis report writing. I would also like to thank one of my very good friend Chaudhry Tanveer AHMED who had always helped me in awkward times. I take this opportunity to express my profound gratitude to all my teachers from school to university because of whose blessings I have come so far.
Finally I would like to thank all my paternal and maternal family members and especially grateful to my parents, my sister and my brothers who always supported me and comforted in my choices. A lot of thanks to my cousins and family members back in my country. My father and mother have been counting days for many years for my return to home. My father will be very happy for realization of his dream for his son. Thank you for the example you have shown. You provided me with inspiration and instruction for how I live my life. My Mother’s continuous prayers had always given me hidden support and confidence. I am thankful for special attachment of my brothers and specially the sacrifice of Farman ul Haq Subhani, who had always been special in all respect. I thank all those without whose encouragement and support, my PhD would have been an unfilled dream.
I would not like to forget the sacrifices of my grandfather (RIP), if was alive, would have been very happy to see his grandson at his peak. If my uncle Saeed Subhani had not sacrificed for the whole family when he was young, I am sure I would have not achieved this position. Special thanks to my Cousin Ikram ul Haq Subhani for his assistance, cooperation and guidance in my university education in Lahore.
Last but not the least, special thanks to my dear wife, who shared in my thesis and my life, thoughts and my heart ... that made me laugh, smile, work, think ... and most importantly, motivated me. She had supported me in all respect during all the difficult times. My sons Shehryar and Shahmeer have been making my days happier and cheerful during my studies. It will not be appropriate if I forget to say special thanks to Kiran Sabih, the unwavering support that I have received from her and always been greatly appreciated. My success is a tribute to love and encouragement. In the end thanks to all my in-laws family and friends, near and far, who gave me friendship, prayers and moral support. I love you and I thank you for being in my life.
Publications and Conferences
The work presented in the thesis was done in collaboration with ICELLTIS a company dealing with biomaterial scaffolds for tissue and bone regeneration engineering.The physical and chemical testing of biomaterials and analysis of end product was done in the laboratory Institute Carnot - Centre Interuniversitaire de Recherche Ingénierie Materiaux (CIRIMAT).
Manufacturing of biomaterials pellets was conducted in Université Paul Sabatier CIRIMAT- Physique des Polymeres . Processing of the scaffold was done at two different ScCO2 equipments at Laboratoire de Genie Chimique and Laboratoire d'Analyse et d'Architecture des Systèmes.
During the thesis following patent,publications and communications were done.
Patent
Title: “Procédé de fabrication d’un matériau poroux-[Fr]”, “Process for manufacturing a porous material-[Eng]”Courrier : 035/10TB/EF/MG Date Deposited :5th January,2010
Nr. of Deposit: 1050037
Inventors: Alain LAMURE, Arfan ul Haq SUBHANI, Jean Stéphane CONDORET, Nadine LE BOLAY, Selmi BOZBAG, Séverine CAMY and Véronique SANTRAN.
Owners: ICELLTIS, Cap Delta- Parc technologique Delta Sud,09340 Verniolle,FRANCE.
Tel :+33.5.34.32.34.24
INPT, Institut National Polytechnique de Toulouse - 6 allée Emile Monso - ZAC du Palays - BP 34038 - 31029 Toulouse cedex 4,Tel : (+33) 5 34 32 30 00 / E-mail : [email protected] Publications
Publication,13eme Journées de Formulation de la Société Française de Chimie,Procédés et formulations au service de la santé, Nancy, France, 4th ~5th Dec., 2008,“Development of Bio-composite Foam in Supercritical Environment: Influence of Process Parameters on the Distribution of Pores of Biomaterial.”, Arfan SUBHANI, Selmi Erim BOZBAG, Veronique SANTRAN, Jean-Stéphane CONDORET, Severine CAMY and Alain LAMURE.
Publication (Accepted in Chemical Engineering and Processing: Process Intensification) Mar., 2011.
“How To Combine A Hydrophobic Matrix and a Hydrophilic Filler Without Adding a Compatibilizer. Co-Grinding Enhances Use Properties of Renewable PLA-Starch Composites”.
Nadine LE BOLAY, Alain LAMURE, Nora GALLEGO LEIS, Arfan ul Haq SUBAHNI.
Posters
Elaboration de Mousses Nano-Bio-composites en Milieu Supercritique : Influence des Paramètres du Procédé sur la Distribution des Pores du Biomatériau PLGA 85:15, 3e Workshop of ITAV (Institute des Technologies Avancées en sciences du Vivant) axed on the "Nanobiotechnologies",25th Sep, 2008, Toulouse, France.
Elaboration de Mousses Nano-Bio-composites en Milieu Supercritique : Influence des Paramètres du Procédé sur la Distribution des Pores du Biomatériau PLGA 50:50, 13
eme
Journées de Formulation de la Société Française de Chimie, 4th~5th Dec, 2008, Nancy, France.
Improvement in Renewable Polymer PLA and Amylopectin Blends Characteristics by the Co-grinding Process, 5th annual European symposium on biopolymers, 18th~20th Nov, 2009, Madeira, Portugal.
Conference Papers/Oral Presentation
Distribution of Pores in PLGA 85:15 and PLGA 50:50 Foams Manufactured by the scCO2 Process, Arfan Ul Haq SUBHANI, Selmi Erim BOZBAG, Nadine Le Bolay, Jean-Stéphane CONDORET, Severine CAMY Veronique SANTRAN, and Alain LAMURE, 9th International Symposium on Supercritical Fluids, New Trends in Supercritical fluids: Energy, Materials, Processing, 18th ~20th May, 2009, Arcachon, France.
Influence of scCO2 Process Parameters and Polymer Structure On the Pore Distribution of Scaffolds and the Cells Adhesion, A.H Subhani, A Lamure, J.S Condoret, S Camy, J Bordere and V Santran, Second Chinese European Symposium on Biomaterials in Regenerative Medicine,17th ~20th Nov, 2009, Barcelona, Spain.
Elaboration of Polyester Foams by the scCO2 Process, Arfan Ul Haq SUBHANI, Selmi Erim BOZBAG, Veronique SANTRAN, Jean-Stéphane CONDORET, Severine CAMY, and Alain LAMURE, Workshop on Supercritical Fluid Processing of Biopolymers and Biomedical Materials, 16th ~17th Nov, 2009, Madeira, Portugal.
Influence of Process Parameters and Polymer Structure On the Cells Adhesion, Arfan Ul Haq SUBHANI, Veronique SANTRAN, Alain LAMURE 5th annual European symposium on biopolymers, 18th~20th Nov, 2009, Madeira, Portugal.
Preparation of Biopolymers Foams by Supercritical CO2 Process, Arfan Ul Haq SUBHANI, Selmi Erim BOZBAG, Veronique SANTRAN, Jean-Stéphane CONDORET, Severine CAMY, and Alain LAMURE , Journées Groupe Français d'Études et d'Applications des Polymères, GFP Sud-Ouest, 25th~26th Mar 2010, Samatan, France.
Improvement by Co-grinding of the Use Properties of Renewable Polylactic Acid – Starch Composites, Nadine Le BOLAY, Alain LAMURE, Nora Gallego LEIS, Arfan ul Haq SUBHANI, 2nd international Conference on Natural Polymers,24th ~26th Sep,2010, Kottayam, Kerala, India.
Nomenclature and Abbreviations Abbreviation
INPT Institut National Polytechnique de Toulouse
CIRIMAT Centre Interuniversitaire de Recherche et d'Ingénierie des Matériaux LAAS Laboratoire d'Architecture et d'Analyse des Systèmes
LGC Laboratoire de Génie Chimique
2 D Two Dimensions
3 D Three Dimensions
ASTM American Society of Testing and Materials
SS Stainless Steel
CO2 Carbon dioxide
scCO2 Supercritical carbon dioxide
TIPS Thermally Induced Phase Separation FTIR Fourier transform infrared
UV Ultraviolet radiation
SEM Scanning electron microscopy
TEM Transmission electron microscopy
-CT Micro-computer tomography DSC Differential Scanning Calorimetry SL-EOS Sanchez and Lacombe’ Equation of State MHR Mark Houwink’ Relationship
BME Basement membrane extract
ECM Extracellular matrix
PLA Poly(lactic acid)
PL,DLA Poly D-Lactic acid PL,DLLA Poly D,L-Lactic acid
PLGA Poly(lactic-co-glycolic acid) PCL Poly(-caprolactone)
PGA Poly(glycolic acid)
PI polyimide PC polycarbonate
AMPEG α-amino-ω-methoxy-polyethylene glycol
HA Hyaluronic acid
GlcA Glucuronic acid
Am-CP Amorphous calcium phosphate Ap-TCP Apatitic tricalcium phosphate
TCP Amorphous tricalcium phosphate BCP Biphasic calcium phosphate αTCP α-Tricalcium phosphate
TCP -Tricalcium phosphate CaP calcium phosphate
DCPA Dibasic calcium phosphate anhydrate DCPD Dibasic calcium phosphate dihydrate HAp Hydoxyapatite
OCP Octocalcium phosphate
TCP Tricalcium phosphate
TEA Triethylamine THF Tetrahydrofurane
Abbreviations Classical Unit
Pc Critical Pressure bar
Psat Saturation Pressure bar
Tc Critical Temperature oC
Tsat Saturation Temperature oC
Tg Glass transition temperature °C
Tm Melting temperature C
tco Co-grinding time minute
tsat Saturation time minute
dP/dt Depressurization rate bar/s
m Melting enthalpy J.g-1
m Melting enthalpy of the totally cystallised polymer J.g-1
c Crystallization enthalpy J.g-1
Degree of crystallinity
Cp Variation of heat capacity J.g-1.mol-1
D Diffusivity m2s-1
Ddg Desorption diffusion coefficient at plasticized state m2s-1 Ddp Desorption diffusion coefficient at glassy state m2s-1
Z Zeldovich factor
Intrinsic Viscosity dL.g-1
inh Inherent Viscosity dL.g-1
rel Relative Viscosity
Mn Number average mass molecular Dalton
Mw Weight average mass molecular Dalton
Mvis Viscosity average mass molecular Dalton
K Mark Houwink’ constant dL.g-1
a Mark Houwink’ constant
Liquid-Solid Contact Angle °
γL Surface Tension of Liquid mJ/m2
γS Surface Tension of Solid mJ/m2
γSL Solid-liquid interfacial tension mJ/m2
γSV Solid-vapour interfacial tension mJ/m2
γS
p Polar component of surface energy mJ/m2
γSd
Dispersive component of surface energy mJ/m2
S
LW Lifshitz–van der Waals component of surface energy mJ/m2
SAB Acid–Base component of surface energy mJ/m2
γS−
Basic Composnent of Surface mJ/m2
γS
+ Acid Composnent of Surface mJ/m2
δt Hildebrand’ solubility parameter (M Pa)1/2
δd Dispersive Hansen’ solubility parameter (M Pa)1/2
δH Hydrogen Hansen’ solubility parameter (M Pa)1/2
δp Polar Hansen’ solubility parameter (M Pa)1/2
Øf Foam thickness mm
Øp Pellet thickness mm
df Foam diameter mm
dp Pellet diameter mm
mf Foam mass mg
mp Pellet mass mg
f Foam density
ρp Pellet density
Splitting (Brazilian) tensile stress MPa
S Limit stress between elastic and plastic domains MPa
ε Strain (Elongation)
εB Elongation at break
E Young’ Modulus MPa
ET Tensile Modulus MPa
Subscripts
dg Desorption at glassy state
dp Desorption at plasticized state
i Component i
j Component j
mix Mixture R Reduced Superscripts
* Characteristic
G fluid phase
P polymer phase
Table of Contents
List of Figures ... xxi
List of Tables ... xxix
Introduction ... 1
Chapter 1 ... 5
1 Introduction to Bio Composites ... 5
1.1 Bio-composites for 3D Model of Connective Tissues ... 6
1.1.1 Tissue Engineering and Concept of Scaffold ... 6
1.1.2 Different Types of Scaffolds ... 6
1.1.2.1 Cells Grown in Pellets or in Spheroids ... 6
1.1.2.2 Cells Embedded into Hydrogels Derived from Natural or Synthetic Polymers ... 6
1.1.2.3 Cells Grown in a Biomaterial of Large–size on Different Polymers (PLGA, Agarose) ... 6
1.1.2.4 Cells Grown in a Biomaterial at a Micrometer-Scale (Thickness ~200 µm) ... 7
1.2 Bio-Composites for Calcified Tissue Engineering ... 7
1.2.1 Composition of Scaffolds ... 7
1.2.2 Mechanical Properties of 3D Porous Scaffolds ... 8
1.3 Biodegradable Polymers ... 9
1.3.1 What is Biodegradable? ... 10
1.3.1.1 Aerobic Biodegradation ... 10
1.3.1.2 Anaerobic Biodegradation ... 10
1.3.2 Biodegradable Polymer Materials ... 11
1.3.2.1 Biodegradable Polyesters ... 11
1.3.2.2 Synergistic or Hybrid Polymers ... 12
2 Polyesters Based Bio-materials ... 13
2.1 Polylactides (PLA) ... 13
2.1.1 Structure of Polylactic Acid ... 13
2.1.2 Synthesis of Polylactic Acid ... 13
2.1.3 Properties of Polylactic Acid ... 15
2.2 Poly(lactide-co-glycolide acid) (PLGA) ... 16
2.2.1 General Structures of PLGA Copolymers ... 16
2.2.2 Properties of PLGA Copolymers ... 17
3 Adjuvant and Fillers ... 18
3.1 Adjuvant ... 18
3.1.1 Structure of Hyaluronic Acid (HA) ... 18
3.1.2 Physicochemical and Biological Properties of HA ... 19
3.2 Calcium Phosphates and Tricalcium Phosphates ... 20
3.2.1 Structures of Calcium Phosphate ... 20
3.2.2 Synthesis of Different Calcium Phosphate Phases ... 20
3.2.2.1 Amorphous TriCalcium Phosphate (ATCP) ... 20
3.2.2.2 Addition of Strontium ... 21
3.2.2.3 Effect of Isomorphous Substitution of Strontium in the βTCP ... 22
3.2.2.4 Physicochemical Properties of TCP Phases ... 23
3.2.2.5 Thermal Treatment in Air of the TCP Phases ... 23
3.2.2.6 Aqueous Evolution of TCP Phases ... 24
3.2.2.7 Surface Properties ... 25
3.2.3 Application of and -tricalcium Phosphates in Biomaterials ... 25
4 Conclusion ... 25
Chapter 2 ... 27
1Generalities on Polymer Foams ... 27
2Manufacturing of Porous Materials by Wet Methods ... 28
2.1 Solvent Casting/Particulate Leaching ... 28
2.2 Ice Particle-Leaching ... 29
2.3 Gas-Foaming/Salt-Leaching Technique ... 30
2.4 Gel-Pressing Technique ... 31
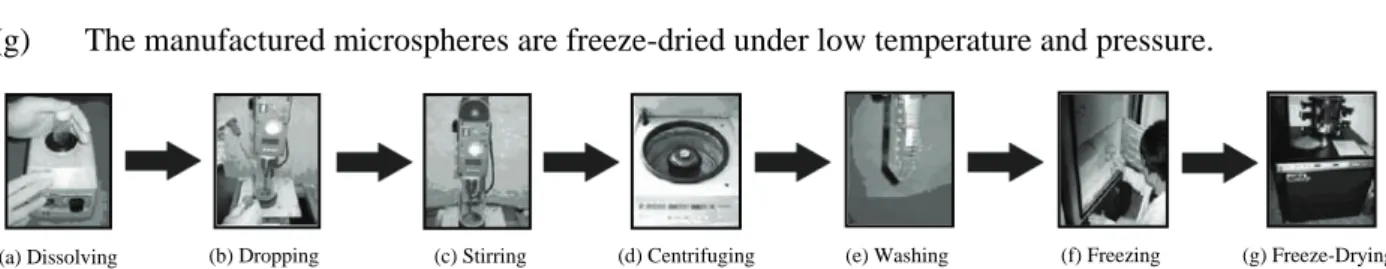
2.5 PLGA Microspheres for Tissue-Engineered Scaffold ... 32
2.6 Particle-Aggregated Scaffolds Technique ... 33
2.7 Freeze-Drying Method ... 33
2.8 Thermally Induced Phase Separation (TIPS) Technique ... 34
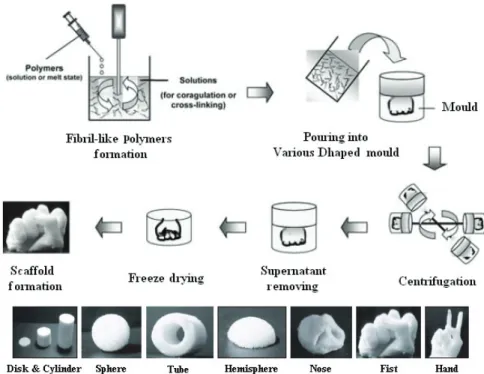
2.9 Centrifugation Method ... 35
2.10Injectable Thermosensitive Gel Technique ... 36
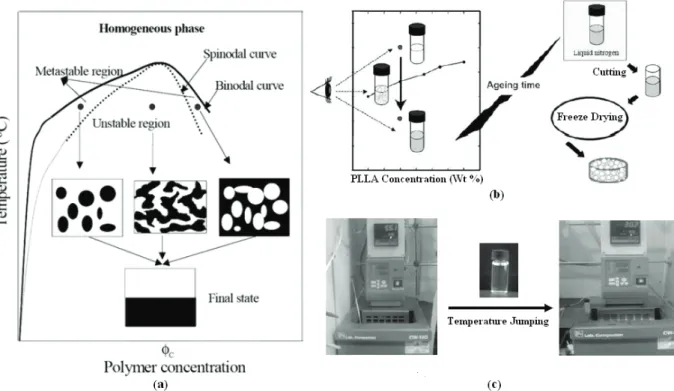
2.11Liquid-Liquid Phase Separation Technique ... 37
2.12Solid-Liquid Phase Separation Technique ... 38
2.13Fibre Mesh/Fibre Bondong Technique ... 38
2.14Hydrocarbon Templating Technique ... 38
2.15Microspheres Bonding Technique ... 39
2.16Rapid Prototyping Techniques ... 39
2.16.1Three Dimensional Printing (3 DP) ... 40
2.16.2Stereolithography (SLA)... 40
2.17Other Derivated Techniques ... 41
2.17.1Combination of Leaching of a Fugitive Phase and Polymer Precipitation ... 41
2.17.2Phase-Change Jet Printing ... 42
3Polymer Processing by Supercritical Fluids ... 42
3.1 Bases on Supercritical Fluids ... 42
3.2 Basic Techniques in Supercritical Fluids Technology ... 44
3.3 Scaffolds Prepared by Phase Inversion using scCO2 as Anti-solvent ... 45
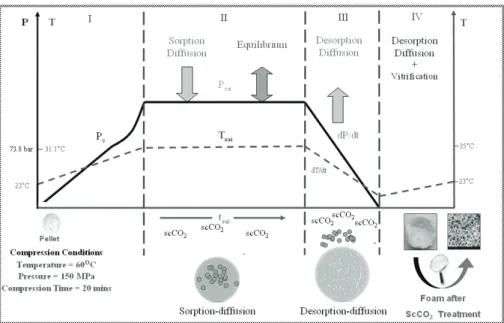
3.4 Scaffolds Prepared by scCO2 Foaming ... 46
4Theoretical Background of Gas Foaming ... 48
4.1 Diffusion ... 48
4.2 Plasticization of Polymers by CO2 ... 51
4.3 Nucleation ... 53
4.4 Distribution of Pores ... 54
5 Manufacturing of the Composite Biomaterials ... 56
5.1 Fundements of Co-grinding Process ... 56
5.1.1 Mechanism of Size Reduction ... 56
5.1.2 Fragmentation Mechanisms ... 57
5.1.3 Agglomeration Phenomena ... 57
5.2 Obtention of Composites by the Co-grinding Process ... 58
6 Conclusion ... 60
Chapter 3 ... 61
1 Differential Scanning Calorimetry (DSC) ... 61
1.1 Generalities on Thermal Transitions of Polymers ... 61
1.2 First Order Transitions ... 62
1.3 Second Order Transition ... 63
2 Intrinsic Viscosity ... 64
2.1 Molecular Mass of Polymer and Viscosity ... 64
2.2 General Principle of Viscosity Measurement ... 64
2.3 The Mark-Houwink Relationship (MHR)... 66
2.4 The Mark-Houwink Constants of Polylactides and Hyaluronic Acid ... 66
3 Laser Granulometry Method ... 67
3.1 Granulometry ... 67
3.2 Principle of Laser Analysis ... 67
3.2.1 Rayleigh’ Theory ... 68
3.2.2 Lorenz-Mie’ Theory ... 68
3.2.3 Fraunhofer’ Theory ... 69
4 Sorption Analysis ... 70
5 Microscopic Methods to Analyze Porous Structures ... 70
5.1 Methods to Determine Porosity ... 70
5.1.1 Geometric Porosity ... 70
5.1.2 Mercury Porosimetry ... 71
5.1.3 X-ray Microtomography ... 72
5.2 Scanning Electron Microscopy Observations ... 72
5.2.1 Bases of Image Analysis ... 73
5.2.2 Morphological Filtering ... 74
6 Macroscopic Methods ... 75
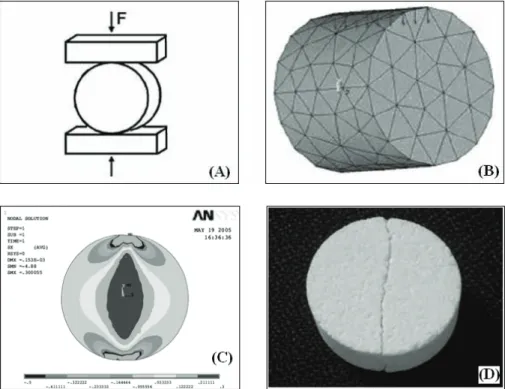
6.1 Mechanical Brazilian Tests ... 75
6.1.1 Principle of the Test ... 75
6.1.2 Compression of Porous Materials ... 76
6.2 Surface Energy Experiments ... 77
6.2.1 Surface Tensions of Liquids ... 78
6.2.1.1 Du Noüy Ring Method ... 79
6.2.1.2 Wilhelmy Plate Method ... 79
6.2.1.3 Lucas-Washburn’ Method ... 80
6.2.1.4 Surface Tensions of Classical Liquids ... 80
6.2.2 Surface Energy of Solids ... 80
6.2.2.1 Young-Dupré’ Equation ... 80
6.2.2.2 Model of Owens-Wendt : Two Components Theory ... 81
6.2.2.3 Model of Good-Van Oss : Three Components Theory ... 83
7Designs of Experiments ... 84
7.1 Modelization Plans: Doehlert’s Design ... 84
7.2 Screening Plans: Taguchi’ Design ... 85
8Conclusion ... 86
Chapter 4 ... 87
1Procedure for Size Reduction ... 87
1.1 Size Reduction ... 87
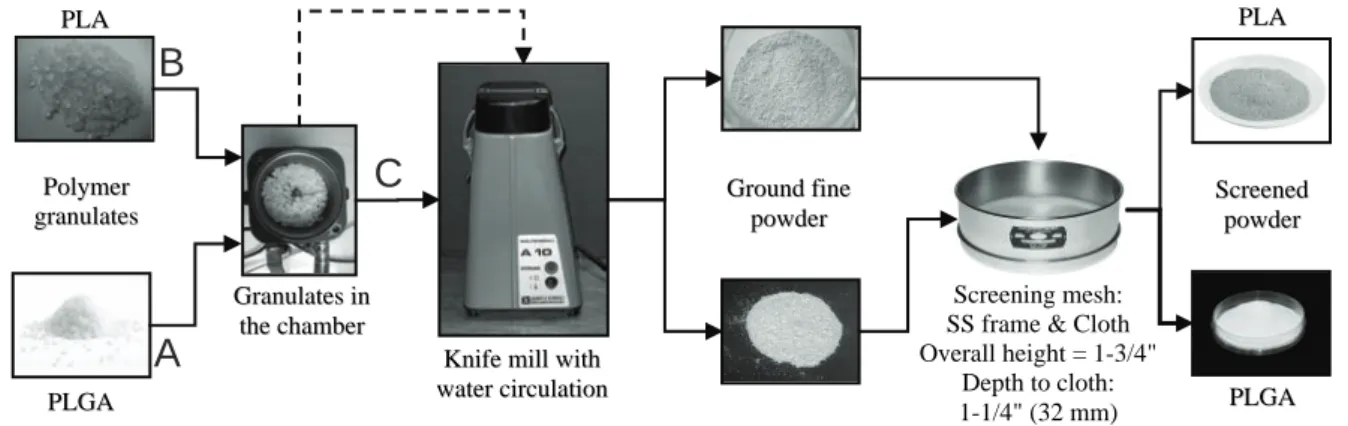
1.1.1 Size Reduction by Knife Mill ... 87
1.1.2 Tumbling Ball Mill Grinding ... 88
1.2 Sieving of Ground Material ... 89
1.3 Mixing of Polymer Powder with Fillers ... 89
1.3.1 Simple Mixing of Polymer Powder with Fillers ... 90
1.3.2 Co-grinding in the Tumbling Ball Mill ... 90
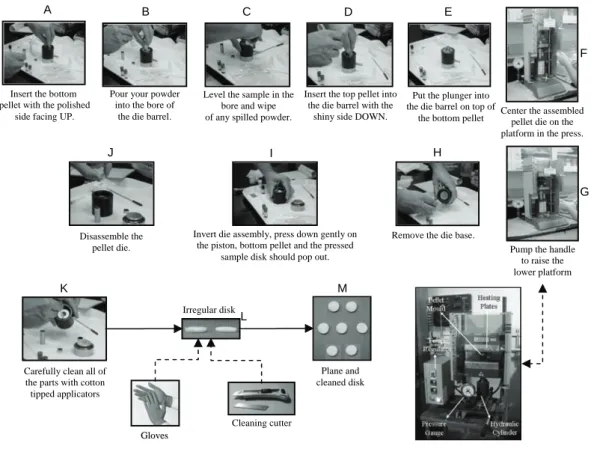
1.4 Preparation of Pellets by Dry Method ... 91
1.4.1 Evacuable Pellet Die ... 91
1.4.2 Procedure to Prepare Pellets ... 92
1.4.2.1 Preparation of the Die ... 93
1.4.2.2 Loading the Die ... 93
1.4.2.3 Processing the Pellets ... 93
1.4.2.4 Removing the Pellets ... 93
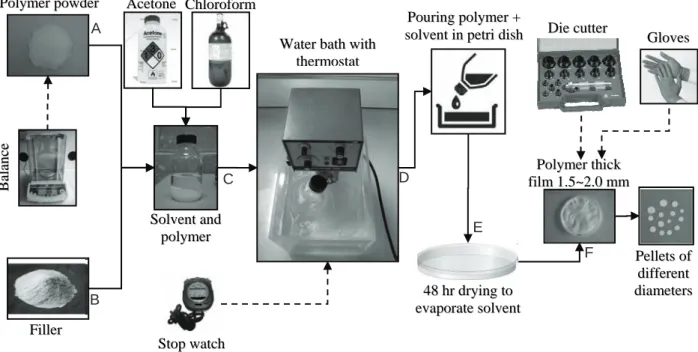
1.5 Preparation of Pellets by Wet Method ... 93
2ScCO2 Foaming Process ... 94
2.1 SEPAREXTM SF200 scCO2 Pilot Plant ... 94
2.1.1 Experimental Device ... 94
2.1.2 Setup One: Filling the Chamber with Teflon® ... 96
2.1.3 Setup Two: Filling the Chamber with Glass Beads ... 96
2.2 SEPAREX SFC6 scCO2 Laboratory Plant ... 96
2.2.1 Experimental Device ... 96
2.2.2 Experimental Procedure ... 96
2.2.2.1 Initial Filling of Chamber with CO2 ... 97
2.2.2.2 Variations of Saturation Pressure and Temperature Holding For Time t ... 98
2.2.2.3 Depressurization of CO2 ... 98
3Protocols for Analysis ... 99
3.1 Granulometry ... 99
3.2 Differential Scanning Calorimetry ... 100
3.3 Contact Angle Measurement ... 101
4 Protocols for Porosity and Pore Size Measurement ... 102
4.1 Average Geometric Porosity ... 102
4.2 2D Image Analysis ... 103
4.2.1 Sputter Coater ... 103
4.2.2 SCION Image Analysis ... 104
4.3 3D Hg Intrusion Porosity ... 107
4.4 3D Micro Computer Tomography ... 108
4.4.1 Acquisition ... 109
4.4.2 Corrections ... 109
4.4.3 Reconstruction ... 109
4.4.4 Viewing Results ... 109
4.4.5 Wide Variety of Post Processing ... 109
5 Mechanical Tests on Foams ... 110
5.1 Experimental Conditions of Test ... 110
5.2 Principle of Curve Analysis ... 110
6 Conclusion ... 111
Chapter 5 ... 112
1 Characterization of Biomaterials ... 113
1.1 Characterization of Polylactide Powders ... 113
1.1.1 Experiments on Polylactide Powders by Viscosimetry. ... 115
1.1.2 Discussion on the Molecular Mass ... 116
1.1.3 Characterization of Polylactide Powders by DSC ... 116
1.1.4 Discussion on the Transitions ... 118
1.1.4.1 Effect of L and DL Ratio on Thermal Property of Polylactide Acid ... 118
1.1.4.2 Effect of LA/GA Ratio on Tg of Polylactides ... 119
1.2 Characterization of Biomaterials Pellets ... 119
1.2.1 Mechanical Experiments ... 119
1.2.2 Discussion on Mechanical Modulus ... 119
2 Kinematics and Thermodynamics Experiments ... 120
2.1 Sorption-Diffusion Kinetics ... 120
2.2 Desorption-Diffusion Kinetics ... 121
2.3 The Sorption Isotherm ... 123
3.1.2 Discussion on the Blends of PL,DLLA and PLGA50:50 ... 125
3.1.3 PL,DLLA and PLGA85:15 Blend ... 125
3.1.4 Discussion on the Blends of PL,DLLA and PLGA85:15 ... 126
3.2 Influence of the Parameters of the scCO2 Process ... 126
3.2.1 Model with a 24 Complete Design ... 126
3.2.2 Model with a Taguchi’ Design for PLGA50:50 Foaming ... 128
3.2.3 Model with a Doehlert’ Design for PLGA50:50 Foaming ... 130
3.2.3.1 Experiments with a Doehlert’ Design ... 130
3.2.3.2 Discussion on the Effect of the Various CO2 Process Parameters ... 132
4 Factors Affecting on Pores Size and Porosity ... 135
4.1 Effect of the Polymer Composition ... 135
4.2 Effect of Depressurization Rates ... 135
4.3 Effect of Saturation Pressure (Psat) ... 137
4.4 Effect of Saturation Temperature (Tsat) ... 138
4.5 Effect of Saturation Time (tsat) ... 139
4.6 Effect of the dP/dt and dT/dt ... 139
4.7 Effect of the Geometry of the Pressure Chamber ... 140
4.8 Interconnectivity and Coalescence Behaviour of the Scaffolds... 141
4.9 Influence of Pellet Thickness on Foaming ... 142
4.9.1 Porosity and Cell Density ... 142
4.9.2 Pores Size Distribution ... 143
4.9.3 Correlation Between Effects of Pellet Thickness and Process Parameters ... 143
4.10Discussion on Foam Morphology ... 144
5Conclusion ... 146
Chapter 6 ... 147
1Optimization of PLA’s Foams Processed by Wet and Dry Methods ... 147
1.1 Experimental Procedure ... 147
1.1.1 Preparation of Pellets by Wet and Dry Methods ... 147
1.1.2 Taguchi’ Design for Foaming ... 148
1.2 PL,DLA Foams Processed by Wet and Dry Methods: Initial Taguchi Plan ... 148
1.2.1 Effect of Process Parameters on Equivalent Pore Diameter (de) ... 150
1.2.2 Effect of Process Parameters on Geometric Porosity ... 150
1.3 PL,DLA Foams Processed by Wet and Dry Methods: Complementary Taguchi’ Plan ... 151
1.3.1 Effect of Process Parameters on Equivalent Pore Diameter (de) ... 153
1.3.2 Effect of Process Parameters on Geometric Porosity ... 153
1.4 PL,DLLA Foams Processed by Wet and Dry Methods: Initial Taguchi Plan ... 154
1.4.1 Effect of Process Parameters on Equivalent Pore Diameter (de) ... 155
1.4.2 Effect of Process Parameters on Geometric Porosity ... 156
1.5 PL,DLLA Foams Processed by Wet and Dry Methods: Complementary Taguchi’ Plan ... 156
1.5.1 Effect of Process Parameters on Equivalent pore diameter (de) ... 158
1.5.2 Effect of Process Parameters on Geometric Porosity ... 158
1.6 Comparison Between Both PLAs ... 159
2Optimization of PLGA’s Foams by Wet and Dry Method. ... 161
2.1 PLGA50:50 Foams Processed by Wet and Dry Methods ... 161
2.1.1 Effect of Process Parameters on Equivalent Pore Diameter (de) ... 162
2.1.2 Effect of Process Parameters on Geometric Porosity ... 163
2.2 PLGA50:50 Foams by Wet and Dry Methods by Complementary Taguchi’ Plan ... 163
2.2.1 Effect of Process Parameters on Equivalent Pore Diameter (de) ... 165
2.2.2 Effect of Process Parameters on Geometric Porosity ... 165
2.3 PLGA85:15 Foams Processed by Wet and Dry Methods: Initial Taguchi’ Plan ... 166 2.3.1 Effect of Process Parameters on Equivalent Pore Diameter (de) ... 167 2.3.2 Effect of Process Parameters on Geometric Porosity ... 168
2.4 PLGA85:15 Foams by Wet and Dry Methods by Complementary Taguchi Plan ... 169 2.4.1 Effect of Process Parameters on Equivalent Pore Diameter (de) ... 170 2.4.2 Effect of Process Parameters on Geometric Porosity ... 171
2.5 Comparison Between Both PLGAs ... 171
2.6 Pore Morphology and Anisotropy of Foams by Both Methods ... 173
2.7 Interconnectivity of Pores in Foams by Both Methods ... 176
2.8 Mechanical Properties of the Foams by Wet and Dry Methods ... 178
2.9 General Discussion ... 178 3 Modification of the Surface by Adding Hyaluronic Acid ... 179
3.1 Granulometry Analysis of PLGA and HA Before and After Co-grinding ... 179
3.2 Contact Angle Measurement and Surface Energy on Pellets ... 181 3.2.1 Results ... 181 3.2.1.1 Contact Angles with Water and Pellets of PLGA, HA and PLGA/HA Blends ... 181 3.2.1.2 Surface Energy of PLGA, HA and PLGA/HA blends ... 182 3.2.2 Origin of the Increase of Surface Energy ... 183 4 Foams of PLGA85:15/HA Blends ... 185
4.1 Preparation of Pellets ... 185
4.2 Effect of scCO2 Parameters on the Microstucture of Foams ... 185 4.2.1 Effect of Depressurization Rate on the Microstucture of Foams ... 185 4.2.2 Effect of Saturation Temperature on the Microstucture of Foams ... 187 5 General Discussion ... 188 6 Conclusion ... 189 Chapter 7 ... 190 1 Characterization of Composites ... 190
1.1 Fillers and Adjuvant ... 190 1.1.1 Sr Calcium Phosphate ... 191 1.1.1.1 Synthesis and Characterization of Calcium Phophates ... 191 1.1.1.2 Calcium Phosphate Characterization ... 191 1.1.1.3 Calcium Phosphate Granulometry ... 193
1.2 Adjuvant: Porogen Agent ... 194 1.2.1 Industrial Waxes ... 194 1.2.2 Thermal Degradation ... 195 2 Experiments on Polylactides/Tri-calcium Phosphate Scaffolds ... 195
2.2 Experiments on Polylactides/Tri-calcium Phosphate ... 195
2.3 Analysis of Experiments on Polylactides/Tri-calcium Phosphate ... 197 3 Foams of Polylactides/Calcium Phosphates Blends and Composites ... 198
3.2 Experiments on PLA/Waxes Scaffolds ... 198 3.2.1 Preliminary Experimentation with Wax as Porogen Agent ... 198 3.2.2 SEM Analysis of Foams ... 199 3.2.3 Effect of Wax on the Equivalent Pore Size and Geometric Porosity ... 201
3.3 Experiments on Polylactides/Tri-Calcium Phosphate/Wax Scaffolds ... 203 3.3.1 Effect of the Ratio of Wax on the Geometric Porosity and Equivalent Pore Size ... 203 3.3.2 Effect of Co-grinding Filler and PLGA on the Pore Morphology ... 205
3.4 Complementary Experiments on PLGA85:15/Tri-calcium Phosphate/Wax Scaffolds ... 206 4Conclusion ... 209 Chapter 8 ... 210 1Semi-industrial Production of Bone Scaffolds ... 210
1.1 Matrix: Polylactides... 211 1.1.1 Experiments with Different Polylactides ... 211 1.1.2 Polylactide with Higher D,L Contents ... 212
1.2 Effect of Polymer Particle Size on Foaming ... 213 1.2.1 Foaming of PLGA85:15 with Different Particle Size ... 214 2Filler: Tri-calcium phosphate Doped by Sr ... 215
2.1 Experimentation on Blends and Composite Foams ... 215 2.1.1 Experimentation on Composite Foaming with Different Co-grinding Times ... 216 2.1.2 Foaming of Fine Powder and Filler Blend by Simple Mixing ... 217 2.1.3 Mixing Experimentation on Composite Foaming with Different Polymer Particle Size ... 218 3Process Control for Composite Foaming ... 220
3.1 Semi-Industrial Foaming ... 220 3.1.1 Pellet Positions in scCO2 Chamber ... 220
3.2 Final Experiments ... 222 3.2.1 Multi Pellet Formation in a Batch and Effect on Foaming ... 222 3.2.2 Preparation of Foams ... 224 3.2.2.1 Filling, Soaking and Depressurization Time of CO2 in Chamber ... 224 3.2.2.2 Temperature Variation During Soaking of CO2 ... 224 3.2.2.3 Dual Depressurization Rate... 225 3.2.2.4 Temperature Variation During Depressurization of CO2 ... 225 3.2.2.5 Retention Time after the Depressurization Step ... 225 3.2.3 Final foam experiments ... 225 3.2.4 Discussion on the Rugdness of the Process ... 226 4Mechanical Properties of Scaffolds ... 229
4.1 Mechanical Characteristics of PLGA85:15 Foam ... 229
4.2 Compressive Properties of Optimized PLGA85:15 Composite Foams ... 231
4.3 Co-grinding time Effect on Compressive Properties of Composite Foams ... 231
4.4 Effect of Different Fillers and Wax-A Ratio on Compressive Properties of PLGA85:15 Composite Foam ... 232 5Interconnectivity of Pores by CT ... 233 5.1 PLGA85:15 Scaffold ... 233
5.2 PLGA85:15 Composite Scaffold ... 235
6 General Discussion ... 236 7 Conclusion ... 237 General Conclusion and Perspective ... 238 BIBLIOGRAPPHY ... 242 ANNEXES ... 264 Annex-A-1 ... 266 Annex A-2 ... 270 Annex A-3 ... 271
List of Figures
Figure 1.1: Structures of selected biodegradable polymers ... 12 Figure 1.2: Stereo-forms of lactides. ... 13 Figure 1.3: Ring opening polymerization of lactide to polylactide. ... 14 Figure 1.4: Different ways of producing PLA. ... 14 Figure 1.5: Schemaic synthesis of poly(lactide-co-glycolide). ... 17 Figure 1.6: Electron micrograph and chemical HA structure. ... 19
Figure 2.1: Procedure of solvent casting/particulate leaching. ... 29 Figure 2.2: Procedure of ice particle–leaching. ... 30 Figure 2.3: Procedure of gas foaming/salt-leaching method. ... 31 Figure 2.4: Procedure of scaffolds by gel-pressing method. ... 32 Figure 2.5: Schematic procedure of the processing of PLGA microsphere scaffolds. ... 33 Figure 2.6: Schematic procedure for manufacturing of scaffolds with the particle-aggregated technique. .... 33 Figure 2.7: Schematic preparation processing of scaffold by the freeze-drying method. ... 34 Figure 2.8: Schematic preparation processing of thermally induced phase separation method. ... 35 Figure 2.9: Schematic procedure showing the fabrication of scaffolds by centrifugation method and
photographs of variously shaped scaffolds. ... 36 Figure 2.10: Reaction of injectable thermosensitive gel... 37 Figure 2.11: Schematic stepwise representation of the polymeric foaming using hydrocarbon porogen. ... 39 Figure 2.12: Schematic diagram of the fused deposition modelling (FDM) system. ... 40 Figure 2.13: Schematic diagram of the 3D BioplotterTM system. ... 40 Figure 2.14: Schematic diagram of the Stereolithography (SLA) system. ... 41 Figure 2.15: Schematic diagram of the phase change jet printing system, the Model-Maker II. ... 42 Figure 2.16: Phase diagrams P-T and -P for a pure CO2. ... 43 Figure 2.17: ScCO2 experimental apparatus (A) CO2 tank, (B) syringe pump and (C) pressure vessel. ... 45 Figure 2.18: Schematic representation of the supercritical fluid foaming process. ... 46 Figure 2.19: Schematic presentation for scaffold generation during scCO2 foaming. ... 47 Figure 2.20: Evolution of process parameters and the occurring phenomena during the foaming with time. 48 Figure 2.21: Schematic of the phenomenon of fragmentation in the co-grinding. ... 59 Figure 2.22: Different stages of agglomeration during the co-grinding: (a) adhesion, (b) coating and (c)
agglomeration. ... 59
Figure 3.1: Differential scanning calorimetry. ... 62 Figure 3.2: Thermograms of two PLLAs of different Mw. ... 63 Figure 3.3: Characteristic variation of glass transition in PLGA. ... 63 Figure 3.4: Schematic representation of the Ubbelohde viscosimeter. ... 65 Figure 3.5: Variation with concentration of reduced specific and inherent viscosities of PL,DLA (LR 704). .. 66 Figure 3.6: (A) Mastersizer 2000 (Malvern Instruments) (B) Schematic diagram showing the main
components of a laser diffraction particle size analyzer. ... 67 Figure 3.7: Scheme of laser diffraction of a spherical particle. ... 68 Figure 3.8: Three dimensional model of scattering from a dipole. ... 68 Figure 3.9: Scattering patterns of two particles of a different size. ... 69 Figure 3.10: Principles of Fresnel’ diffraction (A) and Fraunhofer’ diffraction (B and C). ... 69 Figure 3.11: Desorption of CO2 from PLGA50:50 with time. ... 70
Figure 3.12: (A): Hg porosimeter apparatus and (B): Pore size distribution of PLLA samples. ... 71 Figure 3.13: CT principle and images of PLLA/Silica sample. ... 72 Figure 3.14: Schematic representation of interactions beam on specimen surface. ... 73 Figure 3.15: SCION® Image processing and pore data retrieval. ... 74 Figure 3.16: (A): A binary image and a structuring element (top left corner).(B): Erosion (C): Dilation (D):
Opening (E): Closing of the original image. ... 74 Figure 3.17: H25KS Brazilian testing equipment. ... 75 Figure 3.18: (A): Principle, (B): Load geometry, (C): Simulation and (D): Cleavage of a Brazilian disk test.
... 76 Figure 3.19: Compression testing equipment for foams and result. ... 77 Figure 3.20: Wetting of hydrophilic and hydrophobic samples. ... 78 Figure 3.21: The Du Noüy’ ring method. ... 79 Figure 3.22: The Wilhelmy’ plate method with a platinum plate. ... 79 Figure 3.23: Principle of the absorption Wasburn’ method. ... 80 Figure 3.24: Vectorial equilibrium for a drop of a liquid resting on a solid surface to balance three forces. . 81 Figure 3.25: Example of determination of surface energy components of a blend PLGA + 5 % HA ... 83 Figure 3.26: Example of determining the surface energy components with Good-Van Oss’ method ... 84 Figure 3.27: Distribution of experimental points for a Doehlert’s design of 2-variables. ... 85
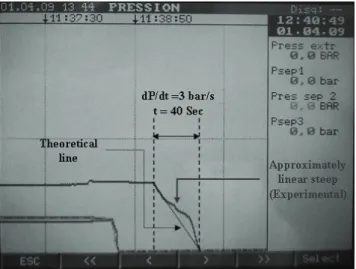
Figure 4.1: Polylactide granulates size reduction by knife mill. ... 88 Figure 4.2: Milling process in tumbling ball mill. ... 88 Figure 4.3: Cataract movement of grinding media. ... 89 Figure 4.4: AFNOR and ASTM 3 ½ in diameter sieves. ... 90 Figure 4.5: Magnetic stirrer mixing for composite materials. ... 90 Figure 4.6: Multistep size reduction of composite. ... 91 Figure 4.7: Schematic diagram to produce pellets in semi-industrial quantities. ... 92 Figure 4.8: Schematic representation to process pellets by using hydraulic press. ... 92 Figure 4.9: Schematic representation of processing pellets by wet method. ... 94 Figure 4.10: SEPAREX Pilot SF200 Process Flow Diagram. ... 95 Figure 4.11: Details of equipment (SEPAREX Pilot SF200). ... 95 Figure 4.12: Schematic representation of the cross section of the supercritical CO2 ... 96 Figure 4.13: Details of equipment (SEPAREX Pilot SFC-6). ... 97 Figure 4.14: SEPAREX Pilot SFC-6 Process Flow Diagram. ... 97 Figure 4.15: Variation of chamber temperature during 20 minutes of scCO2 process for PLGA50:50 foam. .... 98 Figure 4.16: Graph presenting the drop in pressure during 40 sec of depressurization step. ... 98 Figure 4.17: Size distribution of PL,DLA particle after 30 minutes of grinding ... 99 Figure 4.18: Variation of Particle Diameter with Grinding time for PL,DLA ... 99 Figure 4.19: DSC analysis flow sheet of polymer material and foam. ... 100 Figure 4.20: Goniometer GBX used for contact angle measurement. ... 101 Figure 4.21: (A): Schematic diagram and (B): Two methods for determining the contact angle. ... 101 Figure 4.22: Sputter coating and SEM processing flow diagram. ... 103 Figure 4.23: SEM Images of cross sectional foam. ... 104 Figure 4.24: Various steps of transformation of SEM image by Scion®. ... 105 Figure 4.25: Graphs obtained from the initial data of SCION® image analysis. ... 106 Figure 4.26: Pore distribution comparison in a foam with different aspects. ... 107 Figure 4.27: Autopore analyzer for porosity... 108
Figure 4.28: Incremental Intrusion vs Pore size. ... 108 Figure 4.29: Set up of CT and Flow chart of CT measurement process. ... 109 Figure 4.30: CT slice view from different direction for different bone scaffold presenting the
interconnectivity. ... 110 Figure 4.31: Stress strain graph of PLGA foam obtained showing the three regions. ... 111
Figure 5.1: Courbe size distribution of various PLAs after knife mill grinding. ... 115 Figure 5.2: Thermograms of various PLAs. ... 116 Figure 5.3: Thermograms of PLGA50:50. ... 117 Figure 5.4: Thermograms of 3 different PLGA85:15. ... 117 Figure 5.5: Stress strain curve obtained from Brazilian Test for PL,DLA (PAB RL 68). ... 119 Figure 5.6: (A)-Kinetics and modelling of the sorption of CO2 in PLGA50:50 at 125 bar and 36.5°C, (B)
Desorption of CO2 from PLGA50:50 of CO2 in PLGA50:50 at 125 bars and 36.5°C. ... 121 Figure 5.7: Desorption of CO2 from PLGA50:50 after 100 and 200 bars, at Tsat = 36.5°C and tsat = 120 min. 122 Figure 5.8: Sorption isotherm of CO2 into PLGA50:50. ... 123 Figure 5.9: The depression of PLGA50:50 Tg as a function of the weight fraction of sorbed CO2: (♦) 100 bars;
(●) 200 bars. ... 124 Figure 5.10: Micrographs of the PL,DLLA and PLGA50:50 blend scaffolds. ... 125 Figure 5.11: Average pore diameter of polymer blends as a function of PL,DLLA ratio. ... 125 Figure 5.12: Average pore diameter of polymer blends as a function of PL,DLLA ratio. ... 126 Figure 5.13: Average pore diameter as a function of PLGA50:50 ratio in the PLGA50:50/PLGA85:15 blends. .. 128 Figure 5.14: Variation of foam porosity. ... 130 Figure 5.15: Average pore diameters of PLGA50:50 scaffolds as a function of the process parameters. ... 130 Figure 5.16: Micrographs of the cross-section of the foams processed at P = 125 bars. ... 131 Figure 5.17: Variation of the porosity of the foams as a function of depressurization rate. ... 132 Figure 5.18: Influence of dP/dt on the pore size of the foams processed at scCO2 condition Psat = 100 bars,
Tsat = 36.5°C and tsat = 60 min. ... 133 Figure 5.19: (A) Variation of pore diameter of the PLGA50:50 scaffolds as the function of Psat; (B) Variation
of the energy barrier for PLGA50:50-CO2 system. ... 134 Figure 5.20: Tg-w diagram of the PL,DLA (---) and PLGA50:50 (—); (●) and (♦), are the weight fraction of CO2 in PL,DLA and PLGA50:50 at 100 bars, respectively. The value for the weight fraction of PL,DLA at 100 bars and 35°C is taken from [Pini et al., 2008]. ... 136 Figure 5.21: Micrographs of scaffolds processed at Psat = 200 bars; Tsat = 36.5°C, tsat = 20 min. and dP/dt = 20 bar /s. ... 137 Figure 5.22: Micrographs revealing the effect of Psat on pore size. ... 138 Figure 5.23: Micrographs revealing the effect of Tsat on pore size. ... 138 Figure 5.24: Micrographs revealing the effect of tsat on pore size. ... 139 Figure 5.25: Micrographs revealing the effect of dP/dt and dT/dt on pore size. ... 140 Figure 5.26: Representation of the effect of the geometry of the pressure chamber on the porous structure.
... 140 Figure 5.27: Micrographs depicting coalescence and collapse of pores. ... 141 Figure 5.28: Porosity of PLGA50:50 foams for pellets with different initial thickness. ... 142 Figure 5.29: Pore density of PLGA50:50 foams with different initial pellet thickness. ... 142 Figure 5.30: PLGA50:50 foams obtained with different initial pellet thicknesses. ... 143 Figure 5.31: Different distribution of pores in PLGA50:50 foams. ... 143 Figure 5.32: Variation in PLGA50:50 foams geometric porosity for different process parameters. ... 144
Figure 5.33: Distribution of pores at different process condition. ... 145 Figure 5.34: Cell densities of pores produced at different process condition. ... 145 Figure 5.35: Percentage of surface area for Distribution of Pores. ... 145 Figure 5.36: Effective pore diameter for each process parameter. ... 145
Figure 6.1: Micrographs of PL,DLA foams processed by wet and dry methods. ... 149 Figure 6.2: Average effect of each parameter on equivalent pore diameter of PL,DLA foams. ... 150 Figure 6.3: Average effect of each parameter on variation of porosity of PL,DLA foams. ... 150 Figure 6.4: Micrographs of PL,DLA foams processed by wet and dry methods. ... 152 Figure 6.5: Average effect of each parameter on equivalent pore diameter of PL,DLA foams. ... 153 Figure 6.6: Average effect of each parameter on variation of geometric porosity of PL,DLA foams. ... 153 Figure 6.7: Micrographs of PL,DLLA foams processed by wet and dry methods. ... 155 Figure 6.8: Average effect of each parameter on equivalent pore diameter of PL,DLLA foams. ... 155 Figure 6.9: Average effect of each parameter on variation of geometric porosity of PL,DLLA foams. ... 156 Figure 6.10: Micrographs of PL,DLLA foams processed by wet and dry methods. ... 158 Figure 6.11: Average effect of each parameter on equivalent pore diameter of PL,DLLA foams. ... 158 Figure 6.12: Average effect of each parameter on variation of porosity of PL,DLLA foams. ... 159 Figure 6.13: Average effect of each parameter on variation of equivalent pore diameter and porosity of
PL,DLA and PL,DLLA foams by wet and dry methods from initial Taguchi plan. ... 159 Figure 6.14: Average effect of each parameter on variation of equivalent pore diameter and porosity of
PL,DLA and PL,DLLA foams by wet and dry methods from complementary Taguchi plan. ... 160 Figure 6.15: Micrographs of PLGA50:50 foams processed by wet and dry methods. ... 162 Figure 6.16: Average effect of each parameter on equivalent pore diameter of PLGA50:50 foams. ... 162 Figure 6.17: Average effect of each parameter on variation of geometric porosity of PLGA50:50 foams. ... 163 Figure 6.18: Micrographs of PLGA50:50 foams processed by wet and dry methods. ... 165 Figure 6.19: Average effect of each parameter on equivalent pore diameter of PLGA50:50 foams. ... 165 Figure 6.20: Average effect of each parameter on variation of porosity of PLGA50:50 foams. ... 166 Figure 6.21: Micrographs of PLGA85:15 foams processed by wet and dry methods. ... 167 Figure 6.22: Average effect of each parameter on equivalent pore diameter of PLGA85:15 foams. ... 168 Figure 6.23: Average effect of each parameter on variation of porosity of PLGA85:15 foams ... 168 Figure 6.24: Micrographs of PLGA85:15 foams processed by wet and dry methods. ... 170 Figure 6.25: Average effect of each parameter on equivalent pore diameter of PLGA85:15 foams. ... 170 Figure 6.26: Average effect of each parameter on variation of porosity of PLGA85:15 foams. ... 171 Figure 6.27: Average effect of each parameter on variation of equivalent pore diameter and porosity of
PLGA50:50 and PLGA85:15 foams by wet and dry method for initial Taguchi plan. ... 172 Figure 6.28: Average effect of each parameter on variation of equivalent pore diameter and porosity of
PLGA50:50 and PLGA85:15 foams for complementary Taguchi plan. ... 173 Figure 6.29: PLGA50:50 scaffold pore morphology with detail inside view obtained by dry method and foams
processed at 50oC-150 bars-25 min-6 bar/s. ... 174 Figure 6.30: Pore Morphology of different types of scaffold processed by wet and dry methods. ... 175 Figure 6.31: Comparison of pore morphology for PLAs and PLGAs foams processed at Tsat = 50oC, Psat =
100 bars, tsat = 20 min and dP/dt = 3 bar/s. ... 176 Figure 6.32: Slice images of PL,DLA foams structure by CT analysis. ... 176 Figure 6.33: Slice images of PL,DLLA foams structure by CT analysis. ... 176 Figure 6.34: Slice images of PLGA50:50 foam structure by CT analysis. ... 177 Figure 6.35: Slice images of PLGA85:15 foam structure by CT analysis. ... 177
Figure 6.36: Micrographs of particle before grinding. ... 179 Figure 6.37: Evolution of the particle size distribution for PLGA+HA co-grinding. ... 180 Figure 6.38: Micrographs of blend PLGA+ HA after different co-grinding time. ... 181 Figure 6.39: Surface evolution of blend PLGA85:15 + 10% HA pellets with co-grinding time. ... 182 Figure 6.40: Influence of the co-grinding and the ratio of HA on the dispersive component of the blend
surface energy.PLGA/HA. ... 183 Figure 6.41: Influence of co-grinding time and the ratio of HA on the components Acid-Base of surface
energy. ... 184 Figure 6.42: Influence of co-grinding time and the ratio of HA on S
nd and S... 184 Figure 6.43: Micrographs of PLGA85:15 foams at Psat = 120 bars, tsat = 20 min and Tsat = 35oC, [50×]. ... 185 Figure 6.44: Micrographs of blends PLGA85:15/HA 10% foams processed at Psat = 120 bars, tsat = 20 min, Tsat
= 35oC, [100×]. ... 186 Figure 6.45: Micrographs of blend PLGA/HA 10% foams processed at Psat = 120 bars, tsat = 20 min and
dP/dt = 3 bar/s. ... 187
Figure 7.1: IR absorption spectrum of amorphous tricalcium phosphate (ATCP) doped with 10% Sr. ... 192 Figure 7.2: IR absorption spectrum of amorphous calcium phosphate (ACP) doped with 10% Sr after
calcination 24 h. ... 192 Figure 7.3: IR absorption spectrum of tricalcium phosphate doped with 10% Sr after 2 hours of calcination.
... 193 Figure 7.4: Particles size of two different tricalcium phosphates analyzed by granulometry. ... 194 Figure 7.5: Melting and crystallisation of the wax A (TERHELL-907). ... 194 Figure 7.6: TGA curve of the wax-A (907). ... 195 Figure 7.7: Micrographs of PLGA85:15 (8523) + tricalcium phosphate processed at scCO2 conditions- Tsat
50°C, tsat 20 min, dP/dt 3bar/s and varying Psat. ... 196 Figure 7.8: Micrographs of PL,DLA+ tricalcium phosphate processed at scCO2 conditions- Tsat 50°C, tsat
20 min, dP/dt 3bar/s and varying Psat. ... 197 Figure 7.9: Micrographs of PL,DLLA foams at different process conditions. ... 199 Figure 7.10: Micrographs of PL,DLLA +(10%) wax-A foams at different process conditions. ... 199 Figure 7.11: Micrographs of PL,DLLA +(20%) wax-A foams at different process conditions. ... 200 Figure 7.12: Micrographs of PL,DLLA +(30%) wax-A foams at different process conditions. ... 200 Figure 7.13: Average effect of wax-A on the equivalent pore diameter for polymer wax blends. ... 202 Figure 7.14: Average effect of wax-A on the geometric porosity for polymer wax blends. ... 202 Figure 7.15: Micrographs of foams obtained by simple mixing of polymer and wax and processed - at [Tsat
45°C, Psat 120 bars, tsat 20 min, dP/dt 3bar/s]. ... 204 Figure 7.16: Micrographs of foams obtained by simple mixing of polymer and wax and processed at [Tsat
45°C, Psat 100 bars tsat 20 min, dP/dt 3bar/s]. ... 204 Figure 7.17: Micrographs of foams obtained by co-grinding polylactide and fillers processed at Tsat 45°C,
Psat 120 bars, tsat 20 min and dP/dt 3 bar/s. ... 205 Figure 7.18: Micrographs of foams obtained by co-grinding polylactide and fillers processed at... 206 Figure 7.19: Micrographs of foams containing different percentages of wax A. ... 208 Figure 7.20: Effect of particle size of polymer and different % of wax on foam pore diameter and porosity.
... 209
Figure 8.1: Micrographs of pure polymer and polymer with filler foams processed at scCO2 condition Tsat = 50oC, Psat = 100 bars, tsat = 20 min, dP/dt = 3 bar/s. ... 211