%NVUEDELOBTENTIONDU
%0$503"5%&
%0$503"5%&-6/*7&34*5² -6/*7&34*5²%&506-064& %&506-064&
$ÏLIVRÏPAR $ISCIPLINEOUSPÏCIALITÏ
0RÏSENTÏEETSOUTENUEPAR
4ITRE
%COLEDOCTORALE 5NITÏDERECHERCHE
$IRECTEURS DE4HÒSE
2APPORTEURS LE
MEMBRES DUJURY:
Institut National Polytechnique de Toulouse (INP Toulouse)
Mécanique, Energétique, Génie civil et Procédés (MEGeP)
Ecodesign of large-scale photovoltaic (PV) systems with multi-objective optimization and Life-Cycle Assessment (LCA)
Écoconception de systèmes photovoltaïques (PV) à grande échelle par optimisation multi-objectif et Analyse du Cycle de Vie (ACV)
vendredi 25 octobre 2013
Jorge RaÞl PEREZ GALLARDO
Génie des procédés et de l'Environnement
Mme Valérie LAFOREST (ENSM-Saint-Etienne, France) M. Moises GRAELLS (UPC-Barcelone, Espagne) Mme Catherine AZZARO-PANTEL (INP-Toulouse, France )
M. Stéphan ASTIER (INP-Toulouse, France) Laboratoire de Génie Chimique - UMR 5503
Mme Corinne ALONSO (LAAS CNRS-Toulouse, France ) M. Pascal ESCRIBE (EDF EN France Région Sud, France )
M. Serge DOMENECH (INP-Toulouse, France ) M. Xavier ROBOAM (INP-Toulouse, France ) M. Pascal MAUSSION (INP-Toulouse, France )
Abstract
.
Ecodesign of large-scale photovoltaic (PV) systems with multi-objective optimization and Life-Cycle Assessment (LCA)
Because of the increasing demand for the provision of energy worldwide and the numerous damages caused by a major use of fossil sources, the contribution of renewable energies has been increasing significantly in the global energy mix with the aim at moving towards a more sustainable development. In this context, this work aims at the development of a general methodology for designing PV systems based on ecodesign principles and taking into account simultaneously both techno-economic and environmental considerations. In order to evaluate the environmental performance of PV systems, an environmental assessment technique was used based on Life Cycle Assessment (LCA). The environmental model was successfully coupled with the design stage model of a PV grid-connected system (PVGCS). The PVGCS design model was then developed involving the estimation of solar radiation received in a specific geographic location, the calculation of the annual energy generated from the solar radiation received, the characteristics of the different components and the evaluation of the techno-economic criteria through Energy PayBack Time (EPBT) and PayBack Time (PBT). The performance model was then embedded in an outer multi- objective genetic algorithm optimization loop based on a variant of NSGA-II. A set of Pareto solutions was generated representing the optimal trade-off between the objectives considered in the analysis. A multi-variable statistical method (i.e., Principal Componet Analysis, PCA) was then applied to detect and omit redundant objectives that could be left out of the analysis without disturbing the main features of the solution space. Finally, a decision-making tool based on M- TOPSIS was used to select the alternative that provided a better compromise among all the objective functions that have been investigated.
The results showed that while the PV modules based on c-Si have a better performance in energy generation, the environmental aspect is what makes them fall to the last positions. TF PV modules present the best trade-off in all scenarios under consideration.
A special attention was paid to recycling process of PV module even if there is not yet enough information currently available for all the technologies evaluated. The main cause of this lack of information is the lifetime of PV modules. The data relative to the recycling processes for m-Si and CdTe PV technologies were introduced in the optimization procedure for ecodesign. By considering energy production and EPBT as optimization criteria into a bi-objective optimization cases, the importance of the benefits of PV modules end-of-life management was confirmed. An economic study of the recycling strategy must be investigated in order to have a more comprehensive view for decision making.
Keywords: Ecodesign, Multi-objective Optimization, Life-Cycle Assessment (LCA), Photovoltaic (PV) system, Genetic Algorithm (GA), Principal Component Analysis (PCA), Multiple Criteria Decision Making (MCDM)
Résumé
Écoconception de systèmes photovoltaïques (PV) à grande échelle par optimisation multi-objectif et Analyse du Cycle de Vie (ACV)
En raison de la demande croissante d’énergie dans le monde et des nombreux dommages causés par l’utilisation des énergies fossiles, la contribution des énergies renouvelables a augmenté de manière significative dans le mix énergétique global dans le but de progresser vers un développement plus durable. Dans ce contexte, ce travail vise à l'élaboration d'une méthodologie générale pour la conception de systèmes photovoltaïques, basée sur les principes d'écoconception, en tenant compte simultanément des considérations technico-économiques et environnementales. Afin d'évaluer la performance environnementale des systèmes PV, une technique d’évaluation environnementale basée sur l'Analyse du Cycle de Vie (ACV) a été utilisée. Le modèle environnemental a été couplé d'une manière satisfaisante avec le modèle de conception d'un système PV connecté au réseau pour obtenir un modèle global, apte à un traitement par optimisation. Le modèle de conception du système PV résultant a été développé en faisant intervenir l’estimation du rayonnement solaire reçu dans une zone géographique concernée, le calcul de la quantité annuelle d'énergie produite à partir du rayonnement solaire reçu, les caractéristiques des différents composants et l'évaluation des critères technico- économiques à travers le temps de retour énergétique et le temps de retour sur investissement. Le modèle a ensuite été intégré dans une boucle d’optimisation multi-objectif externe basée sur une variante de l’algorithme génétique NSGA-II. Un ensemble de solutions du Pareto a été généré représentant le compromis optimal entre les différents objectifs considérés dans l'analyse. Une méthode basée sur une Analyse en Composantes Principales (ACP) est appliquée pour détecter et enlever les objectifs redondants de l'analyse sans perturber les caractéristiques principales de l'espace des solutions. Enfin, un outil d’aide à la décision basé sur M- TOPSIS a été utilisé pour sélectionner l'option qui offre un meilleur compromis entre toutes les fonctions objectifs considérées et étudiées.
Bien que les modules photovoltaïques à base de silicium cristallin (c-Si) ont une meilleure performance vis-à-vis de la production d'énergie, les résultats ont montré que leur impact environnement est le plus élevé des filières technologiques de production de panneaux. Les technologies en « couches minces » présentent quant à elles le meilleur compromis dans tous les scénarios étudiés.
Une attention particulière a été accordée aux processus de recyclage des modules PV, en dépit du peu d'informations disponibles pour toutes les technologies évaluées. La cause majeure de ce manque d'information est la durée de vie relativement élevée des modules photovoltaïques. Les données relatives aux procédés de recyclage pour les technologies basées sur CdTe et m-Si sont introduites dans la procédure d'optimisation par l'écoconception. En tenant compte de la production d'énergie et du temps de retour sur énergie comme critères d'optimisation, l'avantage de la gestion de fin de vie des modules PV a été confirmé. Une étude économique de la stratégie de recyclage doit être considérée et étudiée afin d'avoir une vision plus globale pour la prise de décision.
Mots-clés: Écoconception, Optimisation Multi-objectif, Systèmes Photovoltaïques (PV), Algorithme Génétique (AG), Analyse en Composantes Principaux (ACP), Méthode d’aide à la décision multi- critère (MADMC)
Resumen
Ecodiseño de sistemas fotovoltaicos (FV) a gran escala por optimización multi- objetivo y Análisis de Ciclo de Vida (ACV)
Debido a la creciente demanda de energía a nivel mundial y los numerosos daños causados por el uso de fuentes fósiles, la contribución de las energías renovables en el mix energético global se ha incrementado significativamente con el objetivo de avanzar hacia un desarrollo más sostenible. En ese contexto, el presente trabajo tiene como objetivo el desarrollo de una metodología general para el diseño de sistemas fotovoltaicos basados en los principios del ecodiseño considerando de manera simultánea los aspectos técnico-económicos y ambientales. Con el fin de evaluar el desempeño ambiental de los sistemas FV, una técnica de evaluación ambiental basada en el Análisis de Ciclo de Vida (ACV) fue utilizada. El modelo ambiental fue acoplado exitosamente con el modelo para el diseño de un sistema fotovoltaico conectado a la red eléctrica. El modelo para el diseño de un sistema fotovoltaico fue desarrollado a partir de la estimación de la radiación solar recibida en una ubicación geográfica específica, el cálculo de la energía anual generada a partir de la radiación solar recibida, las características de los diferentes componentes y la evaluación de los criterios tecno-económicos a través del tiempo de retorno energético (EPBT, en ingles) y el periodo de recuperacion de la inversion (PRI). En seguida, el modelo fue incrustado en un bucle externo destinado a la optimización multi- objetivo tomando como referencia una variante del algoritmo genético NSGA-II. Un conjunto de soluciones de Pareto fue generado, el cual representa el compromiso óptimo entre los objetivos considerados en el análisis. El método de Análsis de Componentes Principlaes (ACP) fue aplicado para detectar y eliminar los objetivos redundantes existentes sin alterar las principales características del espacio de soluciones. Finalmente, una herramienta de ayuda para toma de decisiones basado en M-TOPSIS fue utilizado para seleccionar la alternativa que ofrece un mejor compromiso entre todas las funciones objetivo consideradas y estudiadas.
Los resultados mostraron que los módulos fotovoltaicos basados en silicio cristalino (c-Si) tienen un mejor desempeño en la generación de energía, sin embargo el impacto ambiental que generan es el más elevado de entre todas las tecnologías de paneles solares consideradas. Los módulos fotovoltaicos fabricados a partir de TF presentan el mejor compromiso en todos los escenarios estudiados.
Una atención especial fue puesta a los procesos de reciclaje de módulos fotovoltaicos, a pesar de que actualmente no existe suficiente información disponible para todas las tecnologías evaluadas. La principal causa de esta falta de información es la vida útil de los módulos fotovoltaicos. Los datos relativos a los procesos de reciclado para las tecnologías de CdTe y m-Si fueron introducidos en el procedimiento de optimización basado en el ecodiseño. La importancia de los beneficios que tiene la gestión de los módulos fotovoltaicos al final de su vida útil fue puesta en evidencia al considerar la producción de energía y el tiempo de retorno energético como criterios de optimización. Un estudio económico de las estrategias de reciclage debe ser considerado e investigado con el fin de tener una visión más integral para la toma de decisiones futura.
Palabras claves: Ecodiseño, Optimización Multi-objetivo, Análisis de Ciclo de Vida (ACV), sistemas fotovoltaicos (FV), Algoritmos Genéticos (GA), Análisis de Componentes Principales (ACP), Métodos de Ayuda a la Toma de Decisiones Multi-critério
C ONTENT
Introduction Générale ... 1
1. Motivation for the study and state-of-the art review ... 5
1.1 Introduction ... 7
1.2 General context ... 7
1.3 Solar energy ... 10
1.4 PV System ... 11
PV module ... 13
1.4.1 DC /AC Inverter ... 14
1.4.2 Mounting system ... 14
1.4.3 1.5 Historical PV market development ... 15
European Market ... 16
1.5.1 Production market of PV modules ... 17
1.5.2 PVGCS situation ... 18
1.5.3 1.6 PV System design ... 18
1.7 Organization of the manuscript ... 22
2. Life-Cycle Assessment (LCA) for PV systems ... 23
2.1 Introduction ... 25
2.2 Manufacturing processes for PV technologies ... 26
Crystalline silicon technology ... 26
2.2.1 Amorphous silicon thin-film ... 30
2.2.2 Cadmium Telluride thin-film ... 32
2.2.3 Copper Indium Selenide (CIS) thin-film ... 35
2.2.4 Discussion ... 39
2.2.5 2.3 Environmental assessment techniques ... 40
2.4 LCA Methodology ... 43
Goal and scope definition ... 44
2.4.1 Inventory analysis ... 45
2.4.2 Impact assessment ... 46
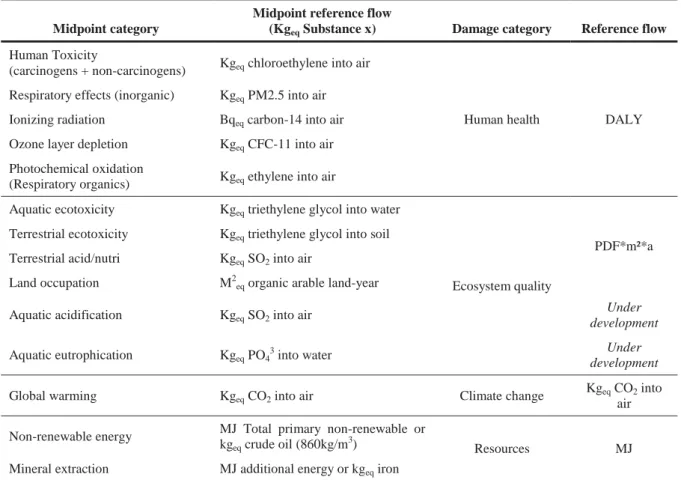
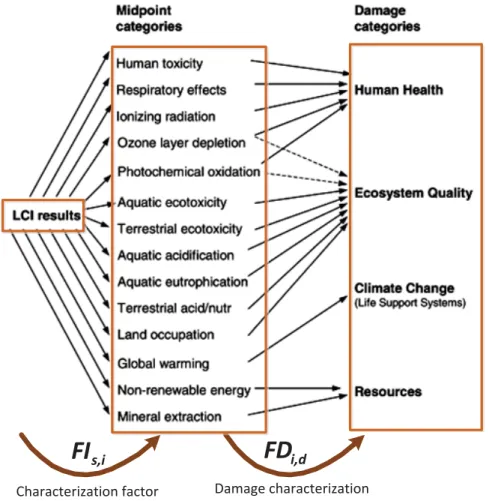
2.4.3 2.4.3.1 Selection of impact categories and characterization models ... 46
2.4.3.2 Impacts and damages classification ... 48
2.4.3.3 Characterization of impacts and damages ... 48
2.4.3.4 Optional elements: Normalisation, Grouping and Weighting ... 50
Interpretation of results ... 51 2.4.4
Limitations of LCA ... 52
2.4.5 LCA software tools ... 52
2.4.6 2.5 LCA study for m-Si based PV module ... 53
Goal and scope definition ... 53
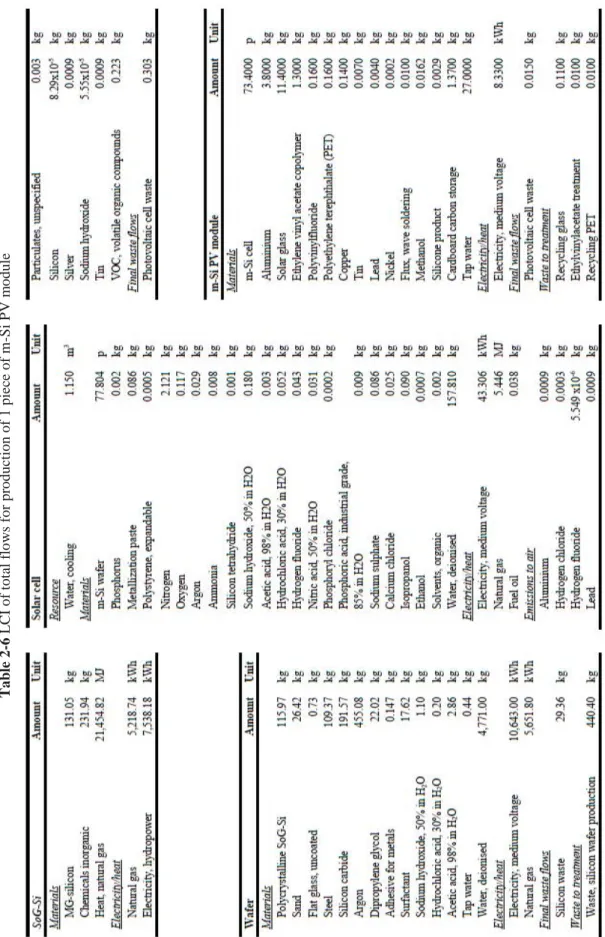
2.5.1 Inventory analysis ... 54
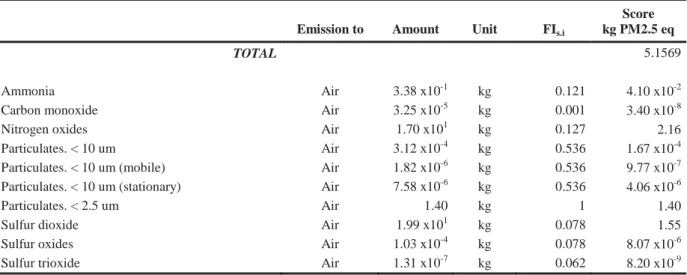
2.5.2 Impact assessment ... 54
2.5.3 Interpretation of results ... 59
2.5.4 2.6 LCA study for silicon-based PV modules ... 62
Goal and scope definition ... 62
2.6.1 Technology assumptions, LCI and data collection ... 63
2.6.2 LCIA results and interpretation ... 63
2.6.3 2.7 LCA study for PVGCS ... 65
Goal and scope definition ... 66
2.7.1 Technology assumptions, LCI and data collection ... 66
2.7.2 LCIA results and interpretation ... 67
2.7.3 2.8 Conclusion ... 68
3. A modelling and simulation framework for sizing large-scale photovoltaic power plants ... 71
3.1 Introduction ... 73
3.2 Literature review on PV System design tools and work objective ... 74
3.3 Development of the simulation tool ... 77
3.4 Solar radiation model ... 78
Solar radiation ... 78
3.4.1 Model Description ... 79
3.4.2 3.4.2.1 Components of hourly irradiance on horizontal surface ... 81
3.4.2.2 Components of hourly irradiance on tilted surface ... 82
3.4.2.2.1 Beam irradiance ... 82
3.4.2.2.2 Reflected irradiance ... 82
3.4.2.2.3 Diffuse irradiance ... 83
3.4.2.3 Validation ... 83
3.5 PVGCS sizing model ... 85
Output energy estimation ... 85
3.5.1 Techniques for sizing PV systems ... 86
3.5.2 Mathematical sizing model ... 87
3.5.3 3.5.3.1 Direct shading ... 88
3.5.3.2 Output energy of solar field ... 89
3.5.3.3 Energy losses ... 89
3.6 Evaluation model ... 90
Techno-economic criteria ... 91
3.6.1 Environmental criteria ... 92
3.6.2 3.7 Validation of the model ... 92
Comparison with Weinstock and Appelbaum’s model performances ... 92
3.7.1 Comparison with PVsyst ... 93
3.7.2 3.8 Conclusion ... 99
Content xi
4. Methods and tools for ecodesign: combining Multi-Objective Optimization (MOO), Principal Component Analysis (PCA) and Multiple Criteria Decision
Making (MCDM) ... 101
4.1 Introduction ... 103
4.2 Multi-objective optimization for sizing PV systems ... 103
Genetic algorithms ... 105
4.2.1 Multi-objective Genetic Algorithm ... 107
4.2.2 PVGCS optimization approach... 107
4.2.3 4.3 Reduction of environmental objectives by Principal Component Analysis (PCA) method. ... 111
PCA for environmental categories ... 114
4.3.1 4.4 Multiple-criteria decision making (MCDM) ... 115
M-TOPSIS method ... 117
4.4.1 Example of application of M-TOPSIS method ... 119
4.4.2 4.5 Conclusion ... 122
5. Ecodesign of large-scale photovoltaic power plants ... 125
5.1 Introduction ... 127
5.2 Optimal design of photovoltaic solar fields ... 128
5.3 Mono-objective optimization cases ... 129
Maximum annual output energy ... 129
5.3.1 5.3.1.1 Results... 129
Minimum Field Area ... 134
5.3.2 5.3.2.1 Results... 134
5.4 Bi-objective optimization cases ... 137
Qout – PBT ... 138
5.4.1 Qout – EPBT ... 142
5.4.2 PBT – EPBT ... 145
5.4.3 Area – PBT ... 146
5.4.4 Area – EPBT... 150
5.4.5 5.5 Multi-objective optimization for the optimal design of PV power plant ... 153
Application of PCA method ... 153
5.5.1 Multi-objective optimization case: Qout – PBT – EPBT – RI – OLD – ME ... 155
5.5.2 Multi-objective optimization case: Qout – PBT – RI – OLD ... 157
5.5.3 5.6 Conclusion ... 158
6. Recycling of PV modules ... 161
6.1 Introduction ... 163
6.2 Recycling in LCA methodology ... 165
Allocation methods ... 166
6.2.1 6.3 Recycling process of spent PV modules ... 167
Crystalline silicon modules ... 167
6.3.1 CdTe and CIS ... 169
6.3.2 a-Si... 171 6.3.3
6.4 LCA of PV modules recycling process ... 171
Crystalline silicon ... 171
6.4.1 CdTe ... 174
6.4.2 6.5 Conclusion ... 177
7. General conclusion and perspectives ... 179
7.1 General conclusions ... 181
7.2 Perspectives ... 183
Bibliography ... 185
liste of figures ... 195
liste of tables ... 199
Appendix A. Comparative Life Cycle Assessment of Autonomous and Classical Heliostats for Heliothermodynamic Power Plants for Concentrated Solar Power ... 201
B. Angle relationship for global irradiance estimation ... 209
C. Validation of irradiance simulation tool ... 215
D. Shadow estimation onto a tilted PV shed ... 221
E. Balance of System (BOS) sizing ... 227
I NTRODUCTION G ÉNÉRALE
L’énergie du rayonnement solaire reçue sur la Terre constitue le seul véritable apport renouvelable extérieur au « système Terre ». Elle représente 8 000 fois la consommation de l’humanité pour une année et se décline en de nombreuses formes d’énergies renouvelables exploitables (rayonnement, vent, hydraulique, biomasse, …). Cet énorme potentiel est donc invoqué pour répondre aux défis posés à l’humanité en matière d’énergie et de développement durable. Notamment, la génération directe d’électricité à partir du rayonnement solaire apparaît des plus prometteuses. Elle s’opère par deux voies principales: les centrales thermosolaires à concentration et tous les systèmes à conversion photovoltaïque exploitables dans une très large gamme de puissances. Les installations photovoltaïques ont ainsi connu une croissance récente vertigineuse, la puissance installée dans le Monde passant de 1,4 à 102 GW crête en 10 ans, notamment de 13 à 25,5 GW crête au cours de la seule année 2012 en Europe, leader dans cette avancée vers un Monde de l’énergie renouvelé et différent. Mais apparaissent dans le même temps plusieurs inconvénients dénoncés, tels que par exemple les besoins en eau des centrales thermosolaires installées en milieux ensoleillés arides, les impacts nocifs de la fabrication des matériaux photovoltaïques ou encore l’emprise au sol et sur les paysages de toutes ces installations artificielles nouvelles. Emblématique d’un développement durablela filière solaire se doit donc de veiller particulièrement à limiter son impact écologique et de maîtriser son développement de façon exemplaire.
C’est dans ce contexte que les travaux de doctorat présentés dans ce mémoire ont été menés: ils concernent particulièrement la conception et l’implantation de grands systèmes de panneaux solaires installés au sol. La bourse de thèse associée a été octroyée par CONACYT (Consejo Nacional de Ciencia y Tecnología, Mexico). Les travaux effectués ont fait l’objet d’une collaboration entre, d’une part, l’équipe COOP du Département Procédés et Systèmes Industriels (PSI) au sein du Laboratoire de Génie Chimique, LGC UMR CNRS INPT UPS 5503 et d’autre part l’équipe Genesys du LAPLACE (Laboratoire Plasma et Conversion d’Energie), UMR CNRS INPT UPS 5213. Les deux équipes ont des compétences complémentaires:
L’équipe COOP (Conception Optimisation et Ordonnancement des Procédés du département PSI) a pour thème général de recherche l’optimisation et la conception de procédés. La démarche s’inscrit de façon prépondérante dans le développement de stratégies d’optimisation en variables mixtes (variables continues liées aux conditions
d’exploitation, variables entières relatives à la structure du procédé ou à des choix décisionnels) via des méthodes stochastiques ou déterministes, avec une forte orientation vers les méthodes d’optimisation multicritère.
Le Groupe GENESYS (ENergie Electrique et SYStémique) a pour objectifs de concevoir des dispositifs hétérogènes, en considérant le système dans sa globalité et sa finalité. Ses compétences se trouvent dans les méthodes de conception intégrée (synthèse, analyse, optimisation) notamment dans les nouvelles technologies de l’énergie.
L’étude présentée a bénéficié du support financier d’un BQR PRES Université de Toulouse baptisé OSSOLEMIO Optimisation Systèmes SOlaires Large Echelle MultI Objectifs (2010-2012) qui a plus largement été dédié à l’étude des deux grandes voies complémentaires de production d’électricité solaire citées ci-dessus et actuellement en d’une part les centrales thermosolaires à concentration par héliostats offrent la possibilité de stocker l'énergie solaire sous forme thermique avant conversion en électricité, ce qui permet de pallier l'intermittence de la production. On peut ainsi obtenir des températures élevées nécessaires à la production de chaleur, d’électricité ou d’hydrogène [cf thèse d’Alaric Montenon (Montenon, 2013)]. D’autre part les générateurs photovoltaïques implantés en toitures ou en en plein champ, fixes ou montés sur des suiveurs solaires, débitant au fil du soleil leur production dans le réseau électrique.
L’étude présentée ici ne s’intéresse qu’à l’implantation de panneaux fixes d’un parc photovoltaïque de production d’électricité connecté au réseau.
La conception de ces systèmes photovoltaïques à grande échelle est encore actuellement surtout basée sur une approche technico-économique qui a comme objectif de maximiser la production d’énergie.
Mais certains éléments, tels que le niveau d’émissions globales, notamment en gaz à effet de serre doivent être pris en compte pour renforcer l’intérêt de la filière et lui assurer un caractère effectivement durable. En fonction des technologies et de l’implantation des modules, il s’agit ici de concevoir des champs de panneaux solaires de façon optimale en combinant des critères de production et d’impact environnemental, afin de développer une méthodologie d’écoconception. Il est donc important également de considérer le recyclage des panneaux afin de régénérer les matériaux qui les constituent. Une analyse du cycle de vie complet a donc constitué une étape préliminaire afin d’évaluer le coût écologique des panneaux et du câblage associé à intégrer dès la conception du système photovoltaïque. Compte tenu du nombre de paramètres et de critères à traiter, le cœur de l’étude vise à proposer une méthode de conception par optimisation qui sélectionne les solutions les plus durables parmi un très grand nombre de choix possibles.
Le mémoire de thèse est organisé en sept chapitres dont nous ne donnons ci-dessous que les titres, la présentation de leur contenu étant donnée à la fin du premier chapitre qui permet de poser les éléments motivant cette étude et d’introduire de façon plus détaillée les chapitres de ce document :
General Introduction 3
Chapitre 1 Motivation de l’étude et présentation de l’état de l’art Chapitre 2 Analyse du Cycle de Vie pour les systèmes photovoltaïques
Chapitre 3 Cadre de modélisation et de simulation pour les centrales photovoltaïques à grande échelle
Chapitre 4 Méthodes et outils pour l’écoconception : combiner optimisation multi-objectif, analyse en composantes principales et aide à la décision multicritère
Chapitre 5 Ecoconception de centrales photovoltaïques à grande échelle Chapitre 6 Recyclage de modules de panneaux solaires
Chapitre 7 Conclusions et perspectives
1. M OTIVATION FOR THE STUDY AND STATE - OF - THE
ART REVIEW
Ce chapitre d'introduction vise à définir le cadre de cette étude et justifie les objectifs généraux qui ont guidé ces travaux. La partie 1 présente brièvement le contexte énergétique général. Le cas de l'énergie solaire, sur laquelle est centrée l’étude est analysé en détail dans la partie 2. Les caractéristiques techniques des systèmes photovoltaïques sont présentées dans la partie 3 et le développement du marché photovoltaïque est positionné dans la partie 4. Les méthodes traditionnelles de conception et de dimensionnement du système photovoltaïque décrites dans la littérature spécialisée sont ensuite proposées, ce qui justifie l'intérêt de développer une méthode d'éco-conception combinant analyse de cycle de vie, optimisation multiobjectif et procédures multicritères d’aide à la décision pour les systèmes photovoltaïques à grande échelle, ce qui est la base de cette étude. L'organisation du manuscrit est présentée à la fin de ce chapitre.
Chapter 1
Nomenclature
Acronyms APAC DC/AC CdTe CIS CPV DSSC EPIA GHG LCA LCI LCIA MEA PV PVGCS ROW a-Si c-Si m-Si p-Si ribbon-Si STE TF
Asia-Pacific region
Direct Current / Alternative Current Cadmium telluride
Copper indium diselenide Concentrating PV Dry-Sensitized Solar Cell
European Photovoltaic Industry Association Greenhouse Gas
Life-Cycle Assessment Life-Cycle Inventory
Life-Cycle Impact Assessment Middle East and Africa Photovoltaic
Photovoltaic Grid-Connected System Rest of the World
Amorphous silicon Crystalline silicon Monocrystalline silicon Polycrystalline silicon
Silicon sheet-defined film growth Solar Thermal Energy
Thin Film
1. Motivation for the study and state-of-the art review 7
1.1 Introduction
This introduction chapter aims at defining the context of this study and justifies the general objectives that have guided this work. It is divided into 7 sections. Section 1 presents briefly the general energy context. The case of solar energy, that constitutes the centre of this study is thoroughly analysed in section 2. The technical features of PV systems are presented in section 3 and the PV market development is positioned in section 4. The traditional PV System design and sizing methods reported in the dedicated literature are then proposed, which justifies the interest to develop an ecodesign method combining Life Cycle Assessment, Multi-Objective Optimization and Multiple Criteria Decision-Making procedures for large-scale PV systems which is the core of this study and which has received little attention till now to our knowledge. The organization of the manuscript ends this chapter.
1.2 General context
During the last decades, the new technological advances have drastically changed our lifestyle. These changes try to satisfy our primary needs as human beings but equally they intended to provide comfort by eliminating repetitive tasks and facilitating our daily life. To achieve these objectives, the generation and supply of energy has become a crucial element for the sustainability of modern society.
The demand for the provision of energy is increasing rapidly worldwide and the trend is likely to continue in future. Increase in its production translates into better quality of life and creation of wealth.
Electricity producing systems presently in use across the world can be classified into three main categories: fossil fuels, nuclear power and renewables (Prakash & Bhat, 2009). Fossil fuels in their crude form, i.e. wood, coal and oil is traditionally the most extensive energy resource used. Nuclear power has been only accessible within developed countries. Renewable energy resources are abundant in nature and easily accessible around the world. Renewable energy sector is now growing faster than the growth in overall energy market. Solar, wind, geothermal, modern biomass, as well as hydro are some of the sources used in this category.
In 2011, the worldwide electricity generation was 21,964 TWh which 67.9% was originated from fossil fuels, 11.7% from nuclear, and 20.2% from renewable sources (Observ’ER, 2012). The graphic in Figure 1-1 represents the allocation of each of the three systems in global electricity production by 2011. Likewise, the emphasis is on the distribution of power generation of the six main sources of renewable energy. Hydroelectricity is the main source for renewable energy with a share of 80.5%.
Nowadays it is clearer that fossil fuel-based energy sources are damaging the environment and human life. Environmental pollution (of air, water, etc.) is largely linked to the increasing use of energy.
Climate change due to use of fossil fuel with emissions of sulphur dioxide (SO2), nitrogen oxide (NOX) and carbon dioxide (CO2) is a worldwide problem that has a big impact in the future of all the species living in the Earth. The Kyoto Protocol (United Nations, 2013), an international environmental treaty, sets the obligations for industrialised countries to reduce overall emissions from six greenhouse
Figure 1-1 Structure of electricity production in 2011 (Observ’ER, 2012)
gases (GHG): carbon dioxide (CO2), methane (CH4), nitrous oxide (N2O), sulphur hexafluoride (SF6),hydrofluorocarbons (HFCs) and perfluorocarbons (PFCs). Because of this situation, the development of renewable energy systems is a current international priority for response to global warming. Some long-term scenarios postulate a rapidly increasing share of renewable technologies.
Under these scenarios, in the second half of the 21st century, renewable source could satisfy between 20% to 50% of world’s total energy demand with the right policies in place and new technology developments (Akella, Saini, & Sharma, 2009). Table 1-1 shows the evolution from 2001 to 2011 of world electricity production by source. From this information wind (28.3%) and solar (45.8%) sources have considerably increased their contribution among renewable sources.
Several problems and disadvantages of the use of renewable energy can be yet highlighted:
A first apparent drawback, often cited is related to the low efficiency of the transformation of the initial energy provided by the source into electricity. But, it is important to underline that an usual 33% efficiency of conversion of traditional fossil or nuclear plants implies the dramatic waste of the two third of a precious natural reserve of energy, definitely lost for the future generations, while the typical 14% efficiency of a photovoltaic conversion simply means that only this proportion is extracted out of a permanently renewable source otherwise 100%
available for the local environment for natural biosynthesis or local heating. Thence and moreover, such low conversion efficiency can augur a low local environmental impact.
However and on another hand, as renewable sources are generally available with low space densities, a true difficulty is to harvest enough final energy required by supplied applications while not using a very large land space. This latter one is of course especially larger with lower efficiency conversion devices. Furthermore, improved devices with higher conversion efficiency are often much more expensive with these very new technologies still in early development. So, the main consequence of this situation is on one hand a larger spreading on land space which may modify the natural landscapes in a non-friendly way and on the other hand a high cost of the generated electricity (see following point). This may lead to search an optimum compromise between cost and occupied land space. So, in our opinion, a low conversion efficiency of a renewable energy should not be directly considered and cited as an obvious drawback by itself.
1. Motivation for the study and state-of-the art review 9
Table 1-1 World electricity production by source in TWh (2001-2011) (Observ’ER, 2012)
Source 2001 2008 2009 2010 2011
Variation 2001-2011
Renewable 2,862.4 3,812.5 3,951.1 4,225.2 4,447.5 4.50 %
- Geothermal 51.7 65.3 67.3 68.5 69.9 3.10 %
- Wind 37.9 219.6 276.4 351.5 459.9 28.30 %
- Biomass 134.1 232.0 250.8 270.1 276.0 7.50 %
- Solar 1.4 12.8 21.0 33.5 61.6 45.80 %
- Hydraulic 2,636.8 3,282.3 3,335.2 3,501.1 3,579.5 3.10 %
- Marine 0.575 0.546 0.527 0.558 0.555 -0.40 %
Fossil 10,010.6 13,637.5 13,409.6 14,340.4 14,908.1 4.10 %
Non-renewable waste 39.3 38.7 40.0 43.1 40.3 0.30 %
Nuclear 2,637.7 2,730.8 2,696.4 2,755.1 2,568.2 -0.30 %
Total Production 15,55.,075 20,219.546 20,097.227 21,363.858 21,964.055
The current cost of renewable energy technology is an impediment for its development. The establishment of government policies that subsidize the implementation of these facilities as well as investment in research of materials and mechanisms to increase processing efficiency and reduce manufacturing cost are necessary to achieve its growth and consolidate its position as the main source of replacing traditional methods of energy generation. Particularly, these technologies require expensive installation investments with long payback times.
It must be also said that an enormous amount of fossil energy is required to manufacture, install and operate all forms of renewable energy systems. Without the input of fossil fuel the existing renewable energy projects probably could never have been built and could not be maintained in operation actually. The raw materials and components used require energy intensive extraction and fabrication techniques to be produced, and along with the finished products, also have to be transported across substantial distances. But, in most cases with the present improved technologies, the assessment on energy on the total life cycle is now positive which augurs of a sustainable development.
A main drawback which becomes a very strong impediment for a large development of renewable sources of electricity is the dependency to geographic and meteorological conditions, making them sometimes very variable along different time scales (night and day, different seasons) and even sometimes and somewhere unpredictable and inconsistent. As the usual electric grid reliable work requires the very good knowledge of consumptions and productions and very good regulations often based on well controlled sources of electricity these properties set a new crucial problem to be solved by means of the so-called new “smart-grids” with new architectures and technologies, for example larger grid connected storage unities. Besides the necessary breakthroughs, this situation generates an increasing of the costs.
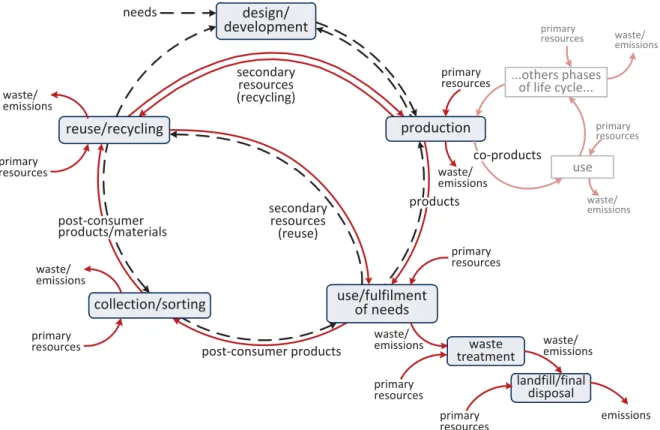
In that context, it is an imperative that the use of renewable energy must be efficiently integrated with the natural environment during its whole lifecycle following ecological design. Ecodesign is the use of the ecological design principles and strategies to design products, processes and systems that take
into account their impact on the environment at all stages of their life cycle, so that they integrate benignly and seamlessly with the natural environment that includes the biosphere, which contains all the forms of life that exist on earth. This goal must be the fundamental basis for the design of all our human-made environments. The PhD thesis focuses exclusively on solar energy with ecodesign guidelines in mind.
1.3 Solar energy
Solar energy is the renewable source that has the most important growth rate (see Table 1-1). Solar irradiation available is more than enough to satisfy the world’s energy demands. The total solar energy that reaches the Earth’s surface could meet global energy needs 10,000 times over (EPIA, 2011).
Where there is more Sun, more power can be generated that is why the sub-tropical areas of the world offer some of the best locations for solar power generation. Figure 1-2 compares the potential solar irradiation with existing energy sources. As it can be seen in this representation, maximizing the use of solar energy can meet the annual energy consumption across the planet.
The main advantages for solar energy are on the one hand:
the power source, the Sun, is totally free.
does not emit any GHG during the energy generation phase.
can be used in any area on Earth, especiallyremote areas where it is too expensive to extend the electricity power grid. It can be on or off the grid.
a very high reliability and a very low maintenance during their 20 - 30 years lifespan despite it is very new and sophisticated technologies.
On the other hand, the main disadvantages for solar energy are:
the biggest disadvantage is the fact that it is not constant. Solar energy is harnessed when it is daytime. But also, beyond normal daily fluctuations, solar production largely varies with seasons outside the tropical latitudes and everywhere with meteorological conditions.
large areas of land can be required to harness enough energy for aplications.
solar systems, made with recent and sophisticated technologies are relatively expensive although prices are falling very rapidly and strongly with the market development.
Figure 1-2 Solar irradiation versus global energy resources (EPIA, 2011)
1. Motivation for the study and state-of-the art review 11
low conversion efficiency is often cited as a drawback but refer to 1.1 above.
Solar energy can be converted directly into other forms of energy, such as heat and electricity. Heat can be directly used for industrial or domestic use (hot washing water). Electricity can be generated by means of different ways as:
Solar thermal energy (STE) is a technology for harnessing solar energy for thermal energy (heat). In STE, the light from the sun is concentrated to create heat, and that heat is used to run a heat engine, which turns a generator to make electricity. Water, oil, salts, air, nitrogen, helium are used as the fluid heated by the concentrated sunlight. Currently, there are three types of solar thermal power systems in use: the solar dish, solar power tower and parabolic trough (Solar Thermal, 2008).
Photovoltaic energy conversion (PV) directly converts the light of Sun into electricity. Some materials that are sensitive to the solar radiation react in such a way that they can produce electricity. The conversion is generqlly accomplished through a thin plate of light sensitive material called solar cell or PV cell.
This work will address PV energy conversion.
1.4 PV System
PV technology has shown the potential to become a major source of power generation for the world.
Proof of this is the fact that at the end of 2009 the PV cumulative installed capacity in the world was approaching 24 GW and in 2012, more than 100 GW are installed globally and they can produce at least 110 TWh of electricity every year (EPIA, 2013). This represents a growth of capacity of three times.
PV power generation employs PV modules composed of a number of solar cells containing a photovoltaic material that converts sunlight into electricity (see Figure 1-3 for a diagram of the photovoltaic effect). A typical PV system is basically made up of one or more photovoltaic PV modules, a mounting system that holds the PV modules and electrical interconnections, a DC/AC power converter (also known as inverter) which can deliver standard alternating voltage and current. A battery system for electricity storage may be included.
PV systems are classified in either off-grid systems or grid-connected systems (see Figure 1-4) (EPIA, 2011; Luque & Hegedus, 2003; Markvart & Castañer, 2003). Off-grid systems, also known as stand- alone systems, have no connection to an electricity grid. That is why a battery is required to deliver the electricity needed at anytime especially during night or after several days of low irradiation. Stand- alone systems fall into one of three main groups:
Off-grid industrial applications. To power repeater station for mobile telephones, traffic signals, remote lighting, highways signs, marine navigation aids among others.
Off-grid systems for electrification. To bring electricity to remote areas or developing countries
Figure 1-3 Photovoltaic effect (EPIA, 2011)
Figure 1-4 Different configurations of PV solar systems from (EPIA, 2011)
Consumer goods. Like those found in several electrical applications such as calculators, toys, watches, etc.
Grid-connected systems (PVGCS) are the most popular type of solar PV system and will be the core of this study. Connection to the local electricity network allows any excess power produced to be sold.
PVGCSs are classified in two main groups: residential and commercial systems and, industrial and utility-scale power plants. Residential and commercial systems are the most extensible used PVGCS because they can be installed on homes and businesses. By connecting to the local electricity network, owners can sell their excess power, but, when solar energy is not available, electricity can be drawn from the grid. This type of PVGCS generates up to 100 kWp (kilo Watt-peak). It must be said at this level of the presentation that kilo Watt-peak stands for peak power. This value specifies the output power delivered by a photovoltaic device (cell, module or system) working at its maximum power under set Standard Test Conditions i.e. a solar radiation of 1,000 watts per square meter, a cell temperature of 25°C and an Air Mass of 1.5.
1. Motivation for the study and state-of-the art review 13
Industrial and utility-scale power plants produce enormous quantities of electricity (>1 MWp). They need a large space to be installed. The solar panels are usually mounted on frames on the ground.
However, they can also be installed on large industrial buildings such as warehouses, airport terminals or railway stations.
A PVGCS is integrated through the following key elements: PV modules, DC/AC inverter and mounting system.
PV module 1.4.1
PV modules are made of PV cells incorporated into a unit, usually by soldering them together under a sheet of glass. Module producers usually guarantee a power output of 80% of the nominal power even after 20-25 years. Modules can be connected to each other in series (known as an array) to increase the total voltage produced by the system. The arrays are connected in parallel to increase the system current.
PV modules are grouped as first, second or third generation according the technology uses for manufacturing the solar cell (Lund, Nilsen, Salomatova, Skåre, & Riisem, 2008; Petter Jelle, Breivik,
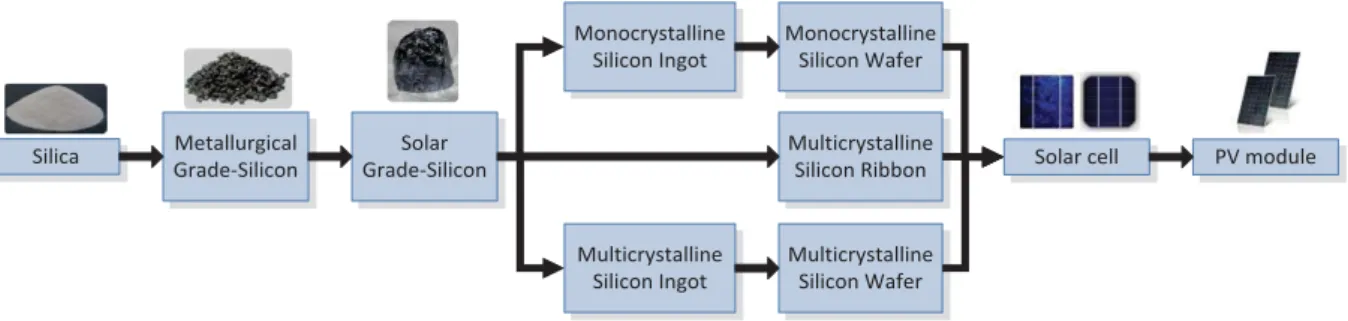
& Drolsum Røkenes, 2012). The first generation includes modules made by silicon cells. Silicon cells have a quite high efficiency, but very pure silicon is needed so the manufacturing process requires a big amount of energy. Efficiencies of more than 20% have been obtained with silicon cells already produced in mass production (EPIA, 2011). Mono-crystalline (m-Si), poly-crystalline (p-Si) and silicon sheet-defined film growth (ribbon-Si) are considered in this generation. These technologies are named crystalline-Silicon technology (c-Si). Silicon-based modules dominate the current market (EPIA, 2013).
The so-called thin film (TF) PV modules are considered as second-generation PV technologies. It includes three main families: amorphous silicon (a-Si), Cadmium-Telluride (CdTe) and Copper- Indium-Selenide (CIS). TF solar cells are comprised of successive thin layers, just 1 to 4 μm thick (Luque & Hegedus, 2003). The combination of using less material and lower cost manufacturing processes allow the manufacturers to produce and sell PV modules at a much lower cost. In addition, TFs can be packaged into flexible and lightweight structures. The main disadvantage is the lower efficiency (7-12%) (EPIA, 2011).
Third-generation PV modules include technologies that are still under demonstration or have not yet been widely commercialised. There are four types of third-generation PV technologies: concentrating PV (CPV), dry-sensitized solar cells (DSSC), organic solar cells and, novel and emerging solar cell concepts. The goal of these technologies is to improve on the solar cells already commercially by growing the conversion efficiency, make them less expensive, and to develop more and different uses.
In laboratory tests, they had reached an efficiency of 30% (EPIA, 2011).
According to EPIA (EPIA, 2013), c-Si technology has currently the highest market share (more than 80%) and is expected to maintain it in the future. TF technologies represented about 15% of the
Figure 1-5 PV module technology market share, based on (EPIA, 2013)
market share in 2012, while third-generation technology represented less than 1% of market share but it is attended to get 1% of market for 2017. Figure 1-5 shows the PV technology market share in 2012 and the projection of PV market until 2017.
DC /AC Inverter 1.4.2
The DC/AC inverter is the second most important component. PV modules produce direct current (DC). However, most appliances run on alternating current (AC). Consequently, an inverter must be used to convert the DC into AC. Inverters are widely used for many industrial applications. The PV inverter has another very important role in PV systems achieving a Maximum Power Point Function (MPPT). This MPPT function consists in varying the electrical operating point of the PV array in order to maintain its output power at the maximum value possible which mainly depends on the environmental conditions: solar irradiation and temperature, that is, the variable bias point at which the PV array produces highest power extraction. Changes of temperature and insolation change the voltage where maximum power extraction occurs. Today, intelligent inverter control includes very effective maximum power point tracking systems (MPPT).
Inverters have often been the source of poor reliability in early systems. Feedback to manufacturers and more robust components has greatly reduced these problems, taking benefit of the tremendous development of power electronics and of the PV systems market.
Today most inverter models are additionally equipped with data loggers and measurement computers, which allow the power, voltage, current and other operating parameters to be recorded continuously and often available by an internet link.
Mounting system 1.4.3
The structures of mounting system are typically pre-engineered systems of aluminium or steel racks.
Mounting structures vary depending on where the PV systems are sited, with different solutions of ground-mounted systems. PV modules must be mounted such that they face the best angle. Because of their low value and substantial weight, mounting and racking structures are generally assembled locally.
1. Motivation for the study and state-of-the art review 15
Simple fixed platforms are commonly the most used, due their very high reliability. It is possible to install tracking platforms that can tilt the PV sensors surface along one or two axis by means of electric motors and a control device that determines the actual position of the sun. Not surprisingly, tracking can provide a significant energy boost so long that it is reliable. However, this comes at a cost and reduced reliability, as the tracking mechanics are more complicated and expensive.
1.5 Historical PV market development
Figure 1-6 exhibits the evolution of PV cumulative installed capacity in the world from 2000 to 2012.
Figure 1-6 also displays the cumulative capacity by region. Europe leads with more than 70 GW installed about 70% of total, particularly thanks to a very strong policy of Germany, the far leader.
Next in the ranking are Asia-Pacific region (APAC) with 12.4 GW installed, America with almost 8.7 GW and not far away China with 8.3 GW. Middle East and Africa (MEA) and the Rest of the World (ROW) represent about 3 GW of world's total PV capacity in 2012.
Figure 1-6 Evolution of global cumulative installed capacity 2000-2012 (MW) (EPIA, 2013)
Table 1-2 Top 10 countries with the highest PV cumulative installed capacity in 2012 (EPIA, 2013) Country
Cumulative
in GW Country
Cumulative in GW
1 Germany 32.4 6 Spain 5.2
2 Italy 16.3 7 France 4.0
3 China 8.3 8 Belgium 2.7
4 United States 7.8 9 Australia 2.4
5 Japan 6.9 10 Czech Republic 2.1
Table 1-2 shows the top 10 countries with the highest PV cumulative installed capacity in 2012. Not surprisingly, Germany continues to be, and with a large difference, the world leader (32.4 GW).
According to the predictions made by the European Photovoltaic Industry Association (EPIA) (EPIA, 2013), a fastest PV growth is expected to continue in China and India, followed by Southeast Asia, Latin America and the MEA countries. The projections for the growth of PV cumulative installed capacity in the world until the year 2017 by region are presented in Figure 1-7 with two possible scenarios. The first called Business-as-Usual scenario assumes a pessimistic market with no major reinforcement or replacement of existing support mechanisms. This scenario also assumes that if the country is close to energy transition, markets are significantly slowing down because the policy mechanisms designed to accelerate investment in renewable energy technologies are phased out. The second scenario called Policy-Driven scenario assumes the continuation, adjustment or introduction of adequate support mechanisms with strong policies to allow considering PV as a major power source in the coming years.
European Market 1.5.1
During 2012 in Europe around 17 GW of new PV installations were mounted. That is why PV became the number-one electricity source among the countries of European Union (EU) in terms of added installed capacity. Figure 1-8 shows the number of new power generation capacities by source added in 2012. It can be seen that for traditional sources (fossil fuel and nuclear) the installed capacity balance turned negative last year. A significant number of facilities were dismantled.
Germany contributed to 44.31% of new PV installations that allow the European market to keep a reasonable level in relation to the other regions. Figure 1-9 indicates the percentage of new grid- connected PV capacities by country in Europe during 2012.
Figure 1-7 Evolution of global PV cumulative installed capacity per region until 2017 in MW (EPIA, 2013)
1. Motivation for the study and state-of-the art review 17
Figure 1-8 Power generation capacities added in the EU 27 in 2012 (MW) (EPIA, 2013)
Figure 1-9 European new grid-connected PV capacities in 2012 (EPIA, 2013)
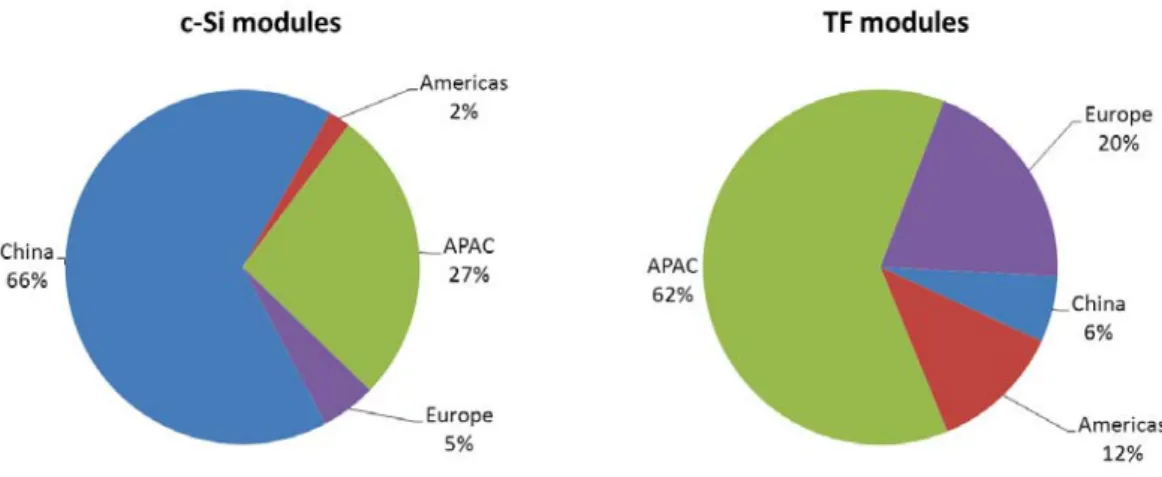
Production market of PV modules 1.5.2
The regional share of actual production of different PV module technologies in 2012 is presented in Figure 1-10. PV industry remained strong in Asia with China playing a leading role. China leads the production market of crystalline modules (c-Si) while the APAC region, with Japan and Malaysia as top producers, leads the TF production market with more than 60% of production share.
EPIA 2012 (EPIA, 2013) report indicates that no major changes should be expected in the main PV technologies, crystalline silicon (c-Si) and TF in the next five years. A slightly higher growth rate is expected for c-Si (6.34%) mainly due to the uncertainty of amorphous silicon (a-Si) technologies, for which the growth rate might be reduced by around 3% until 2017. The reason is the lower module efficiency of a-Si in comparison with the rapid evolution of CdTe and Copper Indium Gallium Selenide (CIGS) with efficiencies below 10% on module level. It is expected that by 2017 CdTe has a 5.95% growth while for CIGS growth will be 8.70%.
Moreover, the permanent decreasing of PV crystalline silicon (c-Si) due to a fast growing of production unities and market, particularly in China, slows down the diffusion of theoretically less
Figure 1-10 Global PV production in 2012 by region (EPIA, 2013) expensive other technologies.
PVGCS situation 1.5.3
In 2012 utility-scale applications reached more than 9 GW. EPIA expects utility-scale plants to grow much faster than rooftop applications. In the Policy-Driven scenario, utility-scale market could quadruple from 9 to 37 GW. This can be explained by the nature of the investors in the most promising markets and the reduced opposition to ground-mounted PV systems (Figure 1-11).
At the regional level, the utility-scale segment is expected to at best stagnate in Europe even as it booms in the Americas and Asia including China. In both scenarios, the APAC region including China should see the largest share of new utility-scale applications, ahead of the Americas.
The design and sizing of large-scale PV plants with more efficient energy production are then needed.
1.6 PV System design
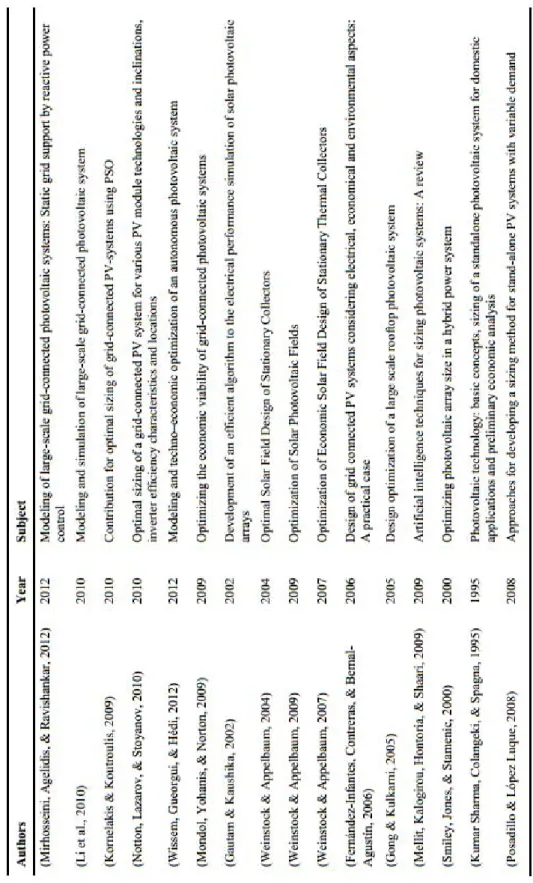
Several works have been devoted to the optimized design of PV systems, mainly from a techno- economic viewpoint. The majority of the reported works in the dedicated literature is related either to the minimization of an economic criterion or to the maximization of annual energy produced.
Figure 1-11Global utility-scale PV development scenarios until 2017 (MW) (EPIA, 2013)
1. Motivation for the study and state-of-the art review 19
However, these studies have adopted mainly simulation approaches to evaluate the system performance and are exclusively devoted to the electrical performance. An optimal unit sizing method has not been established to rationally determine device capacities in consideration of device operational strategies for seasonal and hourly variations of solar insolation and electricity demand.
Generally, two approaches have been adopted. The former one is a deterministic approach where the system performance is evaluated on the basis of original data on solar isolation and electricity demand obtained through measurement. The latter is a probabilistic approach which is based on probability distributions of solar insolation and electricity demand assumed from their original data.
The performance of the PV system depends upon several factors, especially the meteorological conditions such as solar radiation, ambient temperature and wind speed. Normally, the information provided about the PV module and other components from the manufacturers is used for sizing the PV system by a rough estimation of the system output based on average values of daily meteorological data inputs. The parameters that are most used for sizing a PVGCS are field surface, tilt angle and array size. A summary of some works in this field is proposed in Table 1-3.
From the abovementioned works, it is possible to establish a general scheme for the configuration of a PVGCS, as shown in Figure 1-12.
It must be yet emphasized that even if power generation from PV systems is free from fossil fue1 use and greenhouse gas (GHG) emissions, a considerable amount of energy is consumed in the manufacturing and transport of the elements of the system. Besides, the amount of energy and emissions from a decommissioning phase of the system must not be neglected. Moreover, any artificial installation implies an ecological impact on the local or even the global environment. For any energy source versus the aim of sustainable development, if to be “renewable” is an obvious
“necessary condition”, it is not a “sufficient condition”! Indeed, many other impact factors than energy resource exhaustion can be considered to be taken into account.
Ecodesign methods are thus necessary to check whether renewable energy systems as PV systems are truly environment-friendly (green). Generally the environmental assessment is performed as a post- design stage of the PV systems. The objective of this work is to integrate the environmental assessment from the design stage. Table 1-4 displays some of the works that have evaluated environmental impacts generated by PV systems.
Configuration of PVGCS Evaluation of criteria
PVGCS sizing Solar irradiance
estimation
Figure 1-12 General scheme for the configuration of a PVGCS
Table 1-3 Summary of literature works for sizing PV systems
1. Motivation for the study and state-of-the art review 21
Table 1-4 Summary of literature works for environmental assessment of PV systems
1.7 Organization of the manuscript
This PhD work aims at determining a general methodology for designing PVGCS, taking into account simultaneously both techno-economic and environmental considerations.
The manuscript consists of six chapters that are organized as follows:
Chapter 1 is focused on the presentation of the general context of PV systems as well as on the literature review for designing and sizing PV systems and justifies the scientific objectives of this work.
In Chapter 2, the methodology chosen for the assessment of environmental impacts asscoiated with PVGCS based on Life Cycle Assessment methodoloy is presented.
Chapter 3 is dedicated to the presentation of the model that has been developed for sizing a large- scale PV system.
Chapter 4 discusses the methods and tools that are the support of the methodological study for ecodesign. They combine multi-objective optimization, principal component analysis and multiple criteria decision-making
The integration of the environmental and sizing PVGCS models in the multi-objective optimization framework is presented in Chapter 5. Different examples serve as an illutrsation of the performances of the proposed methodology for sizing a PV system taking into account simultaneously techno- economic and environmental criteria. Particular emphasis is devoted to the reduction of the objectives in the multi-objective approach to make the analysis more consistent and facilitate result interpretation.
Chapter 6 presents a review of current recycling processes of PV modules. In addition, two examples of integration of the recycling process in the environmental assessment model developed in Chapter 2 will show the importance of recycling in the ecodesign procedures. Finally, the manuscript ends with conclusions and perspectives in Chapter 7. A vision of the report structure is presented in Figure 1-13:
Chapter 5: Multi-objective optimization
Chapter 2:
Environmental assessement
Chapter 3:
PVGCS sizing model
Chapter 4:
Auxiliary methods
Chapter 6:
Recycling processes
Chapter 1: General context
Chapter 7: Conclusion and perspectives Figure 1-13 Organization of manuscript