%NVUEDELOBTENTIONDU
%0$503"5%&
%0$503"5%&-6/*7&34*5² -6/*7&34*5²%&506-064& %&506-064&
$ÏLIVRÏPAR $ISCIPLINEOUSPÏCIALITÏ
0RÏSENTÏEETSOUTENUEPAR
4ITRE
%COLEDOCTORALE 5NITÏDERECHERCHE
MEMBRESDUJURY :
Institut National Polytechnique de Toulouse (INP Toulouse)
Mathématiques Informatique Télécommunications (MITT)
Estimation of the Degree of Polarization in Polarimetric SAR Imagery:
Principles and Applications Reza Shirvany
Signal, Image, Acoustique et Optimisation (SIAO)
Institut de Recherche en Informatique de Toulouse (IRIT)
Prof. Christine Fernandez-Maloigne , Université de Poitiers , présidente Prof. Gregoire Mercier , Telecom Bretagne , rapporteur
Prof. Yannick Berthoumieu , IMS Bordeaux , rapporteur Prof. Jean-Yves Tourneret , INPT-ENSEEIHT , directeur de thèse
Prof. Marie Chabert , INPT-ENSEEIHT , co-directeur de thèse le : 30 octobre 2012
5DSSRUWHXUV
Prof. Gregoire Mercier, Telecom Bretagne Prof. Yannick Berthoumieu, IMS Bordeaux
'LUHFWHXUVGHWKqVH
Prof. Jean-Yves Tourneret, INPT-ENSEEIHT, directeur de thèse
Prof. Marie Chabert, INPT-ENSEEIHT, co-directeur de thèse
Institut National Polytechnique de Toulouse University of Toulouse
E S T I M AT I O N O F T H E D E G R E E O F P O L A R I Z AT I O N I N P O L A R I M E T R I C S A R I M A G E R Y: P R I N C I P L E S &
A P P L I C AT I O N S r e z a s h i r va n y
Dissertation submitted to the University of Toulouse for the degree of
Doctor of Philosophy
.
Jury
Prof. Christine Fernandez-Maloigne; Université de Poitiers; president Prof. Gregoire Mercier; Telecom Bretagne; rapporteur
Prof. Yannick Berthoumieu; IMS Bordeaux; rapporteur Prof. Jean-Yves Tourneret; INPT-ENSEEIHT; advisor Prof. Marie Chabert; INPT-ENSEEIHT; co-advisor
– 2012 –
{ [email protected] }
All rights reserved. No part of the material protected by this copyright
notice may be reproduced or utilized in any form without the prior
permission of the author.
.
To My Parents
A B S T R A C T
P o l a r i m e t r i c Synthetic Aperture Radar ( SAR ) systems have become highly fruitful thanks to their wide area coverage and day and night all-weather capabilities. Several polarimetric
SARs have been flown over the last few decades with a variety of polarimetric SAR imaging modes; traditional ones are linear single- and dual-pol modes. More sophisticated ones are full-pol modes.
Other alternative modes, such as hybrid and compact dual-pol, have also been recently proposed for future SAR missions.
The discussion is vivid across the remote sensing society about both the utility of such alternative modes, and also the trade-off between dual and full polarimetry. This thesis contributes to that discussion by analyzing and comparing different polarimetric SAR modes in a variety of geoscience applications, with a particular focus on maritime monitoring and surveillance. For our comparisons, we make use of a fundamental, physically related discriminator called the Degree of Polarization ( DoP ). This scalar parameter has been recognized as one of the most important parameters characterizing a partially polarized electromagnetic wave. Based on a detailed statistical analysis of polari- metric SAR images, we propose efficient estimators of the DoP for both coherent and in-coherent SAR systems. We extend the DoP concept to different hybrid and compact SAR modes and compare the achieved performance with different full-pol methods.
We perform a detailed study of vessel detection and oil-spill recog- nition, based on linear and hybrid/compact dual-pol DoP , using recent data from the Deepwater Horizon oil-spill, acquired by the National Aeronautics and Space Administration ( NASA )/Jet Propul- sion Laboratory ( JPL ) Uninhabited Aerial Vehicle Synthetic Aperture Radar ( UAVSAR ). Extensive experiments are also performed over vari- ous terrain types, such as urban, vegetation, and ocean, using the data acquired by the Canadian RADARSAT-2 and the NASA / JPL Airborne
SAR ( AirSAR ) system.
vii
R É S U M É
L e s radars à synthèse d'ouverture ( RSO ) polarimétriques sont devenus incontournables dans le domaine de la télédétec- tion, grâce à leur zone de couverture étendue, ainsi que leur capacité à acquérir des données dans n'importe quelles conditions atmosphériques de jour comme de nuit. Au cours des trois dernières décennies, plusieurs RSO polarimétriques ont été utilisés portant une variété de modes d'imagerie, tels que la polarisation unique, la polari- sation double et également des modes dits pleinement polarimétriques.
Grâce aux recherches récentes, d'autres modes alternatifs, tels que la polarisation hybride et compacte, ont été proposés pour les futures missions RSOs .
Toutefois, un débat anime la communauté de la télédétection quant à l'utilité des modes alternatifs et quant au compromis entre la po- larimétrie double et la polarimétrie totale. Cette thèse contribue à ce débat en analysant et comparant ces différents modes d'imagerie
RSO dans une variété d'applications, avec un accent particulier sur la surveillance maritime (la détection des navires et de marées noires).
Pour nos comparaisons, nous considérons un paramètre fondamen- tal, appelé le degré de polarisation ( DoP ). Ce paramètre scalaire a été reconnu comme l'un des paramètres les plus pertinents pour carac- tériser les ondes électromagnétiques partiellement polarisées. A l'aide d'une analyse statistique détaillée sur les images polarimétriques RSO , nous proposons des estimateurs efficaces du DoP pour les systèmes d'imagerie cohérente et incohérente. Ainsi, nous étendons la notion de DoP aux différents modes d'imagerie polarimétrique hybride et compacte. Cette étude comparative réalisée dans différents contextes d'application dégage des propriétés permettant de guider le choix parmi les différents modes polarimétriques.
Les expériences sont effectuées sur les données polarimétriques provenant du satellite Canadian RADARSAT-2 et le RSO aéroporté Améri- cain AirSAR , couvrant divers types de terrains tels que l'urbain, la végétation et l'océan. Par ailleurs nous réalisons une étude détaillée sur les potentiels du DoP pour la détection et la reconnaissance des marées noires basée sur les acquisitions récentes d' UAVSAR , couvrant la catastrophe de Deepwater Horizon dans le golfe du Mexique.
ix
A C K N O W L E D G M E N T S
La reconnaissance est la mémoire du cœur.
Gratitude is the memory of the heart.
—Jean-Baptiste Massieu, 1743 – 1818
I would like to express my gratitude to the many people who supported and helped me during my Ph.D. studies, making this time a period I will always cherish.
My special thanks go to my advisor and co-adviser, Jean-Yves Tourneret and Marie Chabert, who provided me with an exciting working en- vironment, many opportunities to develop new ideas, and liberty in research, discussion and expression. I would like to thank Florent Chatelain, Nicolas Dobigeon, and Michele Galletti for productive com- ments, emails, and discussions. Special thanks also to the members of the jury who accepted this task with enthusiasm.
I am, of course, indebted to professors, colleagues, and members of the University of Toulouse. I especially thank Corinne Mailhes, Marie- Laure Boucheret, Nathalie Thomas, Martial Coulon, Jérôme Severini, and the future doctors, Cécile Bazot and Sokchenda Sreng. I am also thankful to Majid Ahmadpanah, and Michel Doisy for their support and presence. A special thought goes to Henri Bauer with whom I shared the passion for photography and philosophized about life.
At this point, I would like to thank my lovely parents, family, and friends for their patience, support, and everlasting fun. This was very important to me. A special thought goes to Yazdan for his helpful advices. Thanks to those, mostly far away, yet very present; Stephen, Kian, Sophia, and Liesa.
I acknowledge the financial support of the French Ministry of Higher Education and Research, which made this work possible. I also acknowledge the following organizations; NASA /Jet Propulsion Laboratory ( JPL ), NASA /Goddard Space Flight Center ( GSFC ), Alaska Satellite Facility ( ASF ), National Oceanic and Atmospheric Administra- tion ( NOAA ), European Space Agency ( ESA ), and MacDonald, Dettwiler and Associates Ltd. ( MDA ).
xi
C O N T E N T S
i n t r o d u c t i o n 1
Chapter Review . . . . 3
Publications . . . . 7
1 9
Chapter 1 O v e rv i e w 9 1 . 1 Airborne and Space-Borne Polarimetric SAR systems . 9 1 . 1 . 1 Airborne Polarimetric SARs . . . . 10
AirSAR . . . . 10
UAVSAR . . . . 10
1 . 1 . 2 Space-Borne Polarimetric SARs . . . . 10
SIR-C/X-SAR . . . . 10
ENVISAT ASAR . . . . 10
ALOS-PALSAR . . . . 11
RADARSAT- 2 . . . . 11
TerraSAR-X . . . . 11
Sentinel- 1 . . . . 12
RCM . . . . 12
1 . 2 Polarization Characteristics . . . . 12
Jones Vector . . . . 12
Polarimetric Covariance Matrix . . . . 13
Stokes Vector . . . . 13
Degree of Polarization . . . . 14
Degree of Depolarization . . . . 15
Degree of Polarization Uniformity . . . . 15
Degree of Linear Polarization . . . . 15
Degree of Circular Polarization . . . . 15
Circular Polarization Ratio . . . . 15
Linear Polarization Ratio . . . . 15
Modified Stokes Vector . . . . 16
Sinclair Matrix . . . . 16
Scattering Vector . . . . 16
Pauli RGB . . . . 16
Scattering Reciprocity . . . . 17
Barakat Full-Pol DoP . . . . 17
1 . 3 Speckle Noise . . . . 17
1 . 4 Theoretical Probability Distributions . . . . 18
1 . 4 . 1 Multivariate Complex Gaussian Distribution . . 18
1 . 4 . 2 Multivariate Complex Wishart Distribution . . . 18
1 . 4 . 3 Multivariate Gamma Distribution . . . . 19
2 21
xiii
Chapter 2 P o l a r i m e t r i c SAR I m ag i n g M o d e s & S t u dy
S i t e s 21
2 . 1 Classical Imaging Modes . . . . 21
Single-Pol . . . . 22
Dual-Pol . . . . 22
Full-Pol . . . . 22
2 . 2 Hybrid & Compact Polarimetry . . . . 23
2 . 3 Data and Study Sites . . . . 25
RADARSAT- 2 San Francisco . . . . 25
RADARSAT- 2 Vancouver . . . . 25
AirSAR San Francisco . . . . 25
AirSAR Flevoland . . . . 26
UAVSAR DWH . . . . 26
3 33
Chapter 3 S tat i s t i c a l A na ly s i s , T h e o r e t i c a l M o d e l i n g , a n d D o P E s t i m at i o n i n D ua l -P o l SAR 33 3 . 1 Statistical Analysis of Multilook Polarimetric SAR Imagery 33 3 . 2 Marginal Distribution of Two Multi-look Intensity Images 36 3 . 3 DoP Estimation . . . . 36
3 . 3 . 1 Coherent Dual-Pol SAR . . . . 36
3 . 3 . 1 . 1 Maximum Likelihood Estimators . . . 36
3 . 3 . 1 . 2 Cramer-Rao Bound . . . . 37
3 . 3 . 2 Incoherent Dual-Pol SAR . . . . 39
3 . 3 . 2 . 1 Maximum Likelihood Estimators . . . 39
3 . 3 . 2 . 2 Cramer-Rao Bound . . . . 41
3 . 3 . 2 . 3 Moment-Based Estimators . . . . 41
3 . 3 . 2 . 4 Asymptotic Variance . . . . 42
3 . 4 A Generalized Definition of the DoP . . . . 43
3 . 5 Statistical Analysis of Linear, Hybrid, and Circular Full- Pol Intensity Images . . . . 44
3 . 6 Marginal Distributions of linear, hybrid, and circular Dual-Pol Intensity Images . . . . 46
4 49
Chapter 4 C o h e r e n t D ua l -P o l D o P: M a r i t i m e M o n i t o r - i n g & S u rv e i l l a n c e 49 4 . 1 Oil Spill Detection and Identification . . . . 50
4 . 1 . 1 Comparison of Dual-Pol DoP with Co-Pol Phase Difference . . . . 60
4 . 1 . 2 Comparison of Dual-Pol DoP with Barakat Quad- pol DoP . . . . 61
4 . 2 Man-made Maritime Object Detection: Ships, Buoys, and Oil rigs . . . . 62
4 . 2 . 1 Buoy Detection . . . . 62
4 . 2 . 2 Oil rig Detection . . . . 67
c o n t e n t s xv
4 . 2 . 3 Ship Detection: Comparison of Dual-Pol DoP with Full-Pol Notch Filter . . . . 68 4 . 3 Conclusion . . . . 70
5 71
Chapter 5 I n c o h e r e n t D ua l -P o l D o P: P e r f o r m a n c e A s -
s e s s m e n t 71
5 . 1 Performance Analysis with Synthetic Data . . . . 72 5 . 2 Performance Analysis in Linear Dual-Pol SAR Imagery 73 5 . 3 Comparison of DoP Estimations in Hybrid/Compact
and Linear Dual-Pol Modes . . . . 76 5 . 4 Phase Difference and Coherence in Hybrid/Compact,
and Circular Dual-Pol SAR . . . . 82 5 . 4 . 1 Extension to Hybrid, Compact, and Circular Po-
larimetry . . . . 83 5 . 5 Potential Applications Outside The Geoscience Field:
PS-OCT . . . . 89 5 . 6 Conclusion . . . . 91
c o n c l u s i o n 95
A 99
Appendix A E nvironmental C onditions , B ragg S catter -
i n g & O i l S l i c k s 99
B 103
Appendix B UAVSAR N o i s e F l o o r 103
b i b l i o g r a p h y 105
Fig. 2 . 1 Polarimetric SAR imaging modes . . . . 22 Fig. 2 . 2 RADARSAT-2 full polarimetric data set, and Google
Earth image of San Francisco, CA , USA . . . . . 27 Fig. 2 . 3 RADARSAT-2 full polarimetric data set, and NOAA
nautical chart of San Francisco Bay, CA , USA . . 28 Fig. 2 . 4 RADARSAT-2 full polarimetric data set, and Google
Earth image of Vancouver, BC , Canada. . . . . 28 Fig. 2 . 5 NASA / JPL AirSAR full polarimetric data set, and
Google Earth image of San Francisco, CA , USA . 29 Fig. 2 . 6 NASA / JPL AirSAR full polarimetric data set, and
Google Earth image of Flevoland, The Nether- lands. . . . 29 Fig. 2 . 7 NASA MODIS visible image of the Deepwater
Horizon oil spill in northern Gulf of Mexico, USA . 30 Fig. 2 . 8 NASA / JPL UAVSAR full polarimetric data set of
the Deepwater Horizon oil spill in northern Gulf of Mexico, USA . . . . 30 Fig. 2 . 9 Typical offshore oil/gas platforms . . . . 31 Fig. 2 . 10 NASA / JPL UAVSAR full polarimetric data set,
and NOAA nautical chart of Mississippi River Delta, LA , USA . . . . 31 Fig. 4 . 1 Maps of the degree of depolarization (data set A) 53 Fig. 4 . 2 Maps of the degree of depolarization (data set B) 54 Fig. 4 . 3 Depolarization vs. incidence angle (data set A) 55 Fig. 4 . 4 Depolarization vs. incidence angle (data set B) 55 Fig. 4 . 5 Oil-ocean depolarization ratio (data sets A & B) 56 Fig. 4 . 6 Oil slick property/type recognition (data set A) 57 Fig. 4 . 7 Oil slick property/type recognition (data set B) 58 Fig. 4 . 8 Aerial photographs of oil spill features . . . . . 59 Fig. 4 . 9 Oil spill detection, co-pol phase difference . . . 60 Fig. 4 . 10 Oil spill detection, Barakat quad-pol DoP . . . 63 Fig. 4 . 11 Comparison of the Barakat quad-pol results
with dual-pol results . . . . 63 Fig. 4 . 12 Maps of the DoP ; buoy detection . . . . 64 Fig. 4 . 13 Depolarization signatures; Southampton Shoal
day mark . . . . 65 Fig. 4 . 14 Depolarization signatures; Southampton Shoal
Channel Entrance . . . . 65 Fig. 4 . 15 Depolarization signatures; North Channel RW “ B ” 66 Fig. 4 . 16 Depolarization signatures; North Channel LTD 66 Fig. 4 . 17 Maps of the DoP ; oil-rig detection . . . . 67
xvi
List of Figures xvii
Fig. 4 . 18 Depolarization signatures; oil-rig detection . . 68 Fig. 4 . 19 Maps of the DoP , and notch filter results; ship
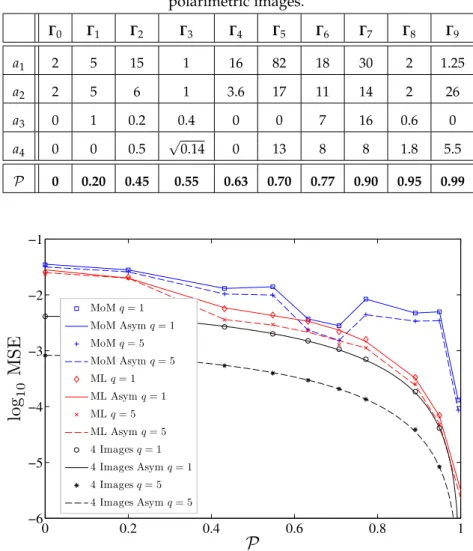
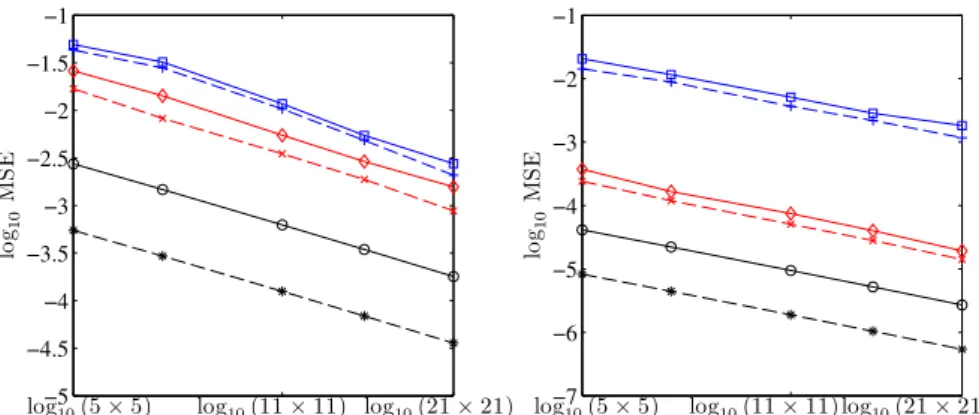
detection . . . . 69 Fig. 5 . 1 log MSE of P b as a function of P (synthetic data) 72 Fig. 5 . 2 log MSE of P b versus the logarithm of the sam-
ple size (synthetic data) . . . . 73 Fig. 5 . 3 DoP ML and MoM estimates in dual-pol modes
( RADARSAT-2 , San Francisco Bay) . . . . 74 Fig. 5 . 4 DoP ML and MoM estimates in dual-pol modes
( AirSAR , Flevoland) . . . . 74 Fig. 5 . 5 Experimental histograms and theoretical PDFs ; ML 75 Fig. 5 . 6 Reference Maps of the DoP . . . . 75 Fig. 5 . 7 Scatter plots of the DoP ML and MoM estimates 77 Fig. 5 . 8 Scatter plots of the DoP ML and MoM estimates
over the park region . . . . 77 Fig. 5 . 9 Maps of the DoP in hybrid/compact and linear
dual-pol modes ( RADARSAT-2 , San Francisco Bay) 78 Fig. 5 . 10 Maps of the DoP in hybrid/compact and linear
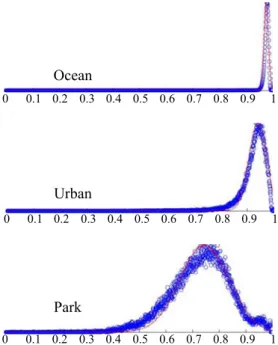
dual-pol modes ( AirSAR , Flevoland) . . . . 78 Fig. 5 . 11 Histograms of the DoP ML estimates over differ-
ent water areas . . . . 80 Fig. 5 . 12 Histograms of the DoP ML estimates over differ-
ent urban areas . . . . 81 Fig. 5 . 13 Histograms of the DoP ML estimates over differ-
ent vegetation areas . . . . 81 Fig. 5 . 14 Maps of the magnitude of the correlation coef-
ficient . . . . 84 Fig. 5 . 15 Experimental & theoretical PDFs ; ocean region 85 Fig. 5 . 16 Experimental & theoretical PDFs ; park region . 86 Fig. 5 . 17 Experimental & theoretical PDFs ; urban region 86 Fig. 5 . 18 Ground truth; crops classification . . . . 87 Fig. 5 . 19 Experimental histograms of phase difference;
crops classification . . . . 87 Fig. 5 . 20 Experimental histograms of phase difference;
crops classification . . . . 88
Fig. 5 . 21 Comparison of OCT with alternative techniques 89
Fig. 5 . 22 PS-OCT : Healthy human retina . . . . 92
Fig. 5 . 23 PS-OCT : A patient with a choroidal nevus . . . 93
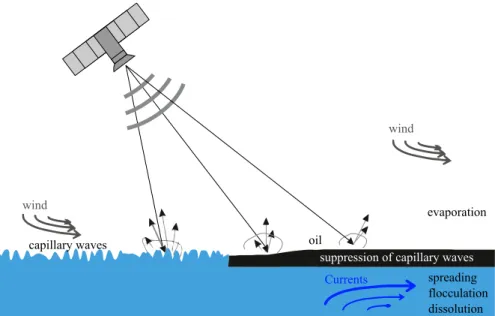
Fig. A. 1 Bragg scattering vs. floating oil layers . . . . . 100
Fig. A. 2 SAR backscatter dependency to wind speed . . 101
Fig. B. 1 UAVSAR noise floor . . . . 104
Table 4 . 1 A short list of some famous oil spills. . . . 50 Table 5 . 1 DoP and the corresponding covariance matrices
of synthetic polarimetric images. . . . 72 Table 5 . 2 Mean and variance of the DoP ML estimates over
ocean, park, and urban regions . . . . 80 Table B. 1 Comparison of noise floor in SAR instruments. 104
A C R O N Y M S
AirSAR Airborne SAR
ALOS Advanced Land Observing Satellite
ASAR Advanced Synthetic Aperture Radar
ASF Alaska Satellite Facility
ASI Italian Space Agency
ATI Along-Track Interferometric
BGD Bivariate Gamma Distribution
BMBF German Ministry of Education and Science
BP British Petroleum
BSA Back Scattering Alignment
CL Circular-Linear
CP Compact Polarimetric
CPD Co-Polarized Phase Difference
CSA Canadian Space Agency
DARA German Space Agency
DCP Dual Circular Polarimetry
DLR German Aerospace Center
DoD Degree of Depolarization
xviii
a c r o n y m s xix
DoP Degree of Polarization
EADS European Aeronautic Defense and Space Company
ENL Equivalent Number of Looks
EPA US Environmental Protection Agency
ESA European Space Agency
GRD Ground Range Multi-Look Detected
GSFC Goddard Space Flight Center
JAROS Japan Resources Observation System Organization
JAXA Japan Aerospace Exploration Agency
JPL Jet Propulsion Laboratory
MDA MacDonald, Dettwiler and Associates Ltd.
MGD Multivariate Gamma Distribution
ML Maximum Likelihood
MODIS Moderate-Resolution Imaging Spectroradiometer
MoM Method of Moments
MRI Magnetic Resonance Imaging
NASA National Aeronautics and Space Administration
NESZ Noise Equivalent Sigma Zero
NOAA National Oceanic and Atmospheric Administration
NRCS Normalized Radar Cross Section
OCT Optical Coherence Tomography
PALSAR Phased Array type L-band SAR PDF Probability Density Function
PolSAR Polarimetric SAR
PS-OCT Polarization Sensitive Optical Coherence Tomography
RCM RADARSAT-2 Constellation Mission
SAR Synthetic Aperture Radar
SIR Space-borne Imaging Radar
UAVSAR Uninhabited Aerial Vehicle Synthetic Aperture Radar
XPD Cross-Polarized Phase Difference
XTI Cross-Track Interferometric
I N T R O D U C T I O N
. . . it appears that all light may characterized as to its state of polarization.
— Norbert Wiener, 1930 [ 1 ]
P o l a r i m e t r i c imagery is a well established tool providing im- portant complementary information to traditional imaging systems in a variety of fields. Polarimetric imagery has been widely studied and employed in different applications such as astron- omy [ 2 ], meteorological investigations [ 3 , 4 ], wetland monitoring [ 5 ], estimation of forest parameters [ 6 ], oil spill detection [ 7 ], computer vision [ 8 ], and medicine [ 9 ].
Radar polarimetry has gained a wholly new importance in the last few years, notably with the advent of new space-borne Synthetic Aperture Radars ( SARs ) such as the Japanese ALOS - PALSAR , the Cana- dian RADARSAT-2 , and the German TerraSAR-X satellite. Polarimetric
SAR ( PolSAR ) systems have opened the doors to many innovative ap- plications. There exists a variety of PolSAR imaging modes; traditional ones are linear single- and dual-pol modes. More sophisticated ones are full-polarimetric modes. For the last five decades, canonical hori- zontal (H) and vertical (V) polarizations have been standardly used in
PolSAR transmission and reception units. It was only in recent years that non-canonical modes, such as hybrid and compact, were proposed for PolSAR . Although the concept of non-canonical polarizations have an extensive heritage in radar astronomy, Souyris et al. [ 10 , 11 ] were the first to propose the Compact Polarimetric ( CP ) π/4 mode for Earth observation applications.
In π/4 mode, the transmit polarization is the superposition of H and V polarizations and the received returns are recorded in both H and V polarizations (45 ◦ H, 45 ◦ V). In another study, Stacy and Preiss [ 12 ] proposed the Dual Circular Polarimetry ( DCP ) mode based on a right (or left) circular polarization transmit, and right and left circular po- larization receives ([RR, RL] or [LR, LL]). In a recent study, Raney [ 13 ] promoted a hybrid (circular linear) mode of operation ( CL -pol), with a right (or left) circular polarization on transmission and two linear polarizations on reception ([RH, RV] or [LH, LV]).
1
Hybrid and compact dual-pol systems provide a wider swath width and greater area coverage compared to full-pol systems. This, of course, is at the expense of not measuring all the available polarimetric information from a scene. Although hybrid and compact modes have the potential to capture more information than the classical dual-pol
SARs , they, by design, lack the complete characterization of target scattering and optimum extraction of parameters. Hence, a major axis of research in SAR polarimetry is the assessment of the relative performance of different operational modes. The discussion is vivid across the remote sensing society about both the utility of emerging hybrid/compact modes, and also the trade-off between dual and full polarimetry. The discussion is particularly active on two distinct levels;
the applications, and the system design. This thesis contributes to that discussion by analyzing and comparing different PolSAR modes in a variety of geoscience applications, with a particular focus on maritime monitoring and surveillance.
The research conducted to assess the performance of compact/hy- brid SAR polarimetry can be classified into two distinct approaches.
The first aims at pseudo-reconstruction of the full polarimetric informa- tion from the compact/hybrid measurements, so that the existing full- pol algorithms can be (indirectly) applied to compact/hybrid data. The pseudo-reconstruction approach [ 10 ] is based on simplifying assump- tions on the symmetry properties of geophysical media. As a result, this approach cannot cope with point scatterers. Souyris et al. [ 10 ] have shown that the pseudo full-pol data perform nearly as well as genuine full-pol data in crop classification. Through analysis of the emerging polarimetric modes Nord et al. [ 14 ] have recently proposed an improved version of the original pseudo-reconstruction algorithm.
The efficiency of these pseudo-reconstruction algorithms in different geoscience applications is subject of active research. Cloude [ 15 ], for example, has recently shown that current pseudo-reconstruction algo- rithms are unable to sufficiently describe all combinations of surface and volume scatterings, even in the well posed reflection symme- try case. Other studies have addressed the comparison of different
PolSAR modes from the frequency point of view. Freeman et al. [ 16 ] and Dubois-Fernandez et al. [ 17 ] have highlighted the advantages of circular transmission at lower frequency, mainly with concern to the Faraday rotation. They argued that the best choice for the transmit polarization in the presence of ionospheric effects (low frequency) is circular.
The second approach to assess the performance of compact/hybrid
SAR polarimetry consists in exploiting directly the compact/hybrid
polarimetric information, and developing adapted algorithms, instead
of reconstructing the pseudo full-pol information. Promoting this line
of thought, Raney [ 13 ] has considered the Stokes framework for the
analysis of hybrid ( CL -pol) data with an emphasis on the advantages
i n t r o d u c t i o n 3
of hybrid architecture with regard to relative errors, crosstalk, and phase and amplitude calibration. In another study, Cloude [ 18 ] has proposed a dual-pol version of the entropy/alpha decomposition for directly analyzing the dual-pol SAR data. Our analysis in this thesis belongs to this line of research.
Interesting discussions have also been carried out by Touzi [ 19 ], Pottier [ 20 ], and Truong-Loï et al. [ 21 ], highlighting different system aspects of the compact, hybrid, and linear dual- and full-pol SAR
modes. Thanks to all these investigations, today it is widely accepted that compact/hybrid polarimetry is not a substitute of full-polarimetry, but a beneficial approach compared to classical dual-pol modes in a number of applications (e. g., land, ocean, and ice). Indeed, a better identification of such applications, as well as further comparative study of ocean (oil-spill and vessel detection) and ice (sea ice, glaciers, etc.) monitoring have been actively requested [ 22 ]. This is of major importance considering that future SAR missions are designed to carry compact/hybrid dual-pol SAR systems on-board; some examples are the Canadian RCM [ 23 ], the American DESDynI [ 24 ], the Argentinian
SAOCOM [ 25 ], the Japanese ALOS-2 [ 26 ], and the Indian RISAT-1 .
The aim of this work is to investigate in detail the information content of the complex and intensity data provided by different hy- brid/compact and linear dual-pol SAR modes. We study the statistical properties of dual-pol SAR data, and derive Maximum Likelihood ( ML ) and Method of Moments ( MoM ) estimators of the Degree of Polar- ization ( DoP ) in coherent and incoherent dual-pol SAR systems. This scalar parameter has been considered as the most important param- eter characterizing a partially polarized electromagnetic wave. The estimation of the DoP can help to determine the nature of the objects that backscatter the wave. It also provides an effective tool for assess- ing the performance of emerging hybrid/compact dual-pol modes with regard to classical dual- and full-pol modes. Experiments are performed on both synthetic and real data, acquired by RADARSAT-2 ,
AirSAR , and UAVSAR systems, covering various terrain types such as ur- ban, vegetation, and ocean. Among different applications, we notably focus on the maritime monitoring (joint ship and oil-spill detection) using the Deepwater Horizon oil-spill PolSAR data. The outline of the present dissertation, along with a list of publications are provided in what follows.
c h a p t e r r e v i e w
Chapter 1. A brief overview of different airborne and space-borne
polarimetric SAR systems is presented. We describe the basic
theory of electromagnetic wave scattering and polarization char-
acteristics. We also review some important physical and math-
ematical definitions and multivariate probability distributions used throughout this manuscript.
Chapter 2. There exists a variety of polarimetric SAR imaging modes.
Classical ones are linear dual- and full-pol modes, emerging ones are hybrid and compact modes. These polarimetric SAR
modes and their specifications are presented in this chapter.
Establishing a comprehensive PolSAR database is an important first step, and a challenging process, for our analysis and com- parison. In this chapter, we also introduce the data and study sites used throughout this dissertation. This database has been composed based on publicly available data from a variety of orga- nizations, in particular, National Aeronautics and Space Admin- istration ( NASA )/Jet Propulsion Laboratory ( JPL ), Goddard Space Flight Center ( GSFC ), Alaska Satellite Facility ( ASF ), National Oceanic and Atmospheric Administration ( NOAA ), European Space Agency ( ESA ), and MacDonald, Dettwiler and Associates Ltd. ( MDA ).
Chapter 3. We study the statistical properties of PolSAR data and show that the joint distribution of the multi-look SAR intensity images, composed from the Stokes parameters, is a Multivariate Gamma Distribution ( MGD ). Based on the characteristics of the MGDs , we derive ML and MoM estimators of the DoP for coherent and incoherent dual-pol SAR systems. In order to assess the perfor- mance of the proposed estimators, we derive the corresponding Cramer-Rao bound and asymptotic variances. Based on the lat- ter, we theoretically show the efficiency of the ML estimators, in contrast to MoM estimators, and conclude that the ML estimators are the optimal estimators of the DoP . Moreover, we study the statistical characteristics of linear, hybrid, and circular full-pol intensity images, and prove that their joint distribution is an
MGD parametrized by the elements of the polarimetric covari- ance matrix. We also show that for particular cases of linear, hybrid, compact, and circular dual-pol SARs , these distribution reduce to Bivariate Gamma Distributions ( BGDs ).
Chapter 4. We discuss in detail the detection of ships, oil-rigs, and
oil spills based on the DoP in coherent dual-pol SAR systems. We
perform the assessment of the relative performance of different
hybrid, compact and linear dual-pol SAR modes. Experiments
are performed on RADARSAT-2 C-band polarimetric data, over
San Francisco Bay, and L-band NASA / JPL UAVSAR data, cover-
ing the Deepwater Horizon oil spill in the Gulf of Mexico. We
show that the DoP estimation provides valuable real-time in-
formation for ship detection and oil spill recognition, under
different polarizations and incidence angles. Among different
dual-pol modes, we show that hybrid/compact and (HH, VV)
i n t r o d u c t i o n 5
dual-pol modes deliver better ship and oil-spill detection results compared to classical linear dual-pol modes, i. e., (HH, HV) and (VH,VV). Moreover, we compare the dual-pol oil-spill detection results with the recent full-pol results from NASA / JPL UAVSAR
researchers [ 27 ], covering the Deepwater Horizon oil-spill in the Gulf of Mexico. We also compare dual-pol ship detection results with full-pol results reported in recent publications of Marino et al. [ 28 , 29 ]. Our results show that the detection perfor- mance based on the estimation of the DoP in hybrid and compact dual-pol modes are closely comparable to the recent results achieved using genuine full-poll data.
Chapter 5. Incoherent dual-pol SAR systems (such as Sentinel- 1 , EN- VISAT ASAR and Airborne SAR ( AirSAR ) CYCLOPS ) can deliver only two intensity images from a scene. On the other hand, the estima- tion of the DoP using only two intensity images is a challenging task. In this chapter, we address this task and analyze the perfor- mance of both ML and MoM estimators using synthetic and real data sets, over various terrain types such as urban, vegetation, and ocean. Experiments are performed on RADARSAT-2 C-band polarimetric data, over San Francisco Bay and Vancouver, BC , as well as L-band NASA / JPL AirSAR data, over San Francisco Bay and Flevoland, The Netherlands. We discuss the theoretical and experimental results and show the efficiency of ML estimators.
We also perform the assessment of the relative information cap- tured by the intensity data from different hybrid, compact and linear dual-pol SAR modes. Our results suggest that classical dual-pol modes, i. e., (HH, HV) and (VH,VV), performed better than emerging hybrid and compact dual-pol modes in terms of the estimation of the DoP based on only two intensity images.
We provide a detailed analysis and draw conclusions.
Conclusion. Final chapter summarizes the general findings of the
present work, and outlines directions for further research, and
potential applications outside the geoscience field.
.
p u b l i c at i o n s
International Journal Papers
1 . R. Shirvany, M. Chabert, and J.-Y. Tourneret, “Estimation of the degree of polarization for hybrid/compact and linear dual- pol SAR intensity images: principles and applications,” IEEE
Transactions on Geoscience and Remote Sensing, accepted for pub- lication, 2012 .
2 . R. Shirvany, M. Chabert, and J.-Y. Tourneret, “Ship and oil- spill detection using the degree of polarization in linear and hybrid/compact dual-pol SAR ,” IEEE Journal of Selected Topics in Applied Earth Observations and Remote Sensing, vol. 5 , no. 3 , pp.
885 – 892 , June 2012 .
International Conference Papers
1 . R. Shirvany, M. Chabert, and J.-Y. Tourneret, “Comparison of ship detection performance based on the degree of polariza- tion in hybrid/compact and linear dual-pol SAR imagery,”in Proceedings of the 2011 IEEE International Geoscience and Remote Sensing Symposium ( IGARSS '11), Vancouver, BC , Canada, Jul. 2011 , pp. 3550 – 3553 .
2 . R. Shirvany, M. Chabert, and J.-Y. Tourneret, “Estimation of the degree of polarization in compact polarimetry,”in Proceedings of the 2010 IEEE International Geoscience and Remote Sensing Sympo- sium ( IGARSS '10), Honolulu, Hawaii, USA , Jul. 2010 , pp. 722 – 725 . 3 . R. Shirvany, M. Chabert, and J.-Y. Tourneret, “Estimation of the degree of polarization in dual-polarized SAR imagery,” in Proceedings of the 2010 IEEE International Conference on Image Pro- cessing ( ICIP '10), Hong Kong, Sep. 2010 , pp. 1401 – 1404 .
4 . R. Shirvany, M. Chabert, F. Chatelain, and J.-Y. Tourneret, “Maxi- mum likelihood estimation of the polarization degree from two multi-look intensity images,” in Proceedings of the Thirty-Fifth IEEE
International Conference on Acoustics, Speech, and Signal Processing ( ICASSP '10), Dallas, Texas, USA , Mar. 2010 , pp. 1198 – 1201 .
7
1
O V E R V I E W
It probably helps that my background is in the sciences and I can speak the scientists' language.
—David Chalmers .
P o l a r i m e t r i c SAR systems have opened the doors to many innovative and new applications. Several polarimetric SARs
have been built and flown over the last few decades. The aim of this chapter is to present a brief background information on polarimetric SAR systems and the related basic concepts. Section 1 . 1 presents a selection of important airborne and space-borne SAR sys- tems. The basics of polarized electromagnetic waves, and polarimetric radar scatterings are then discussed in § 1 . 2 . Section 1 . 3 addresses the unavoidable natural phenomenon inherent in SAR images called the speckle. We finally review some important mathematical definitions and theoretical probability distributions used throughout this thesis in § 1 . 4 .
1 . 1 a i r b o r n e a n d s pa c e - b o r n e p o l a r i m e t r i c s a r s y s t e m s Pioneers such as Sinclair, Kennaugh, and Huynen made significant contributions in early polarimetric radar imaging research in the 1940 's. Soon the value of polarimetry was demonstrated in a variety of applications through the early works of Ulaby, Fung (geophysical parameter estimation), Valenzuela, Plant, and Alpers (ocean wave remote sensing). The polarimetric radar imaging particularly gained a considerable importance in 1988 , when the NASA / JPL built and flew the AirSAR platform, which had the unique capability to provide full- polarimetric data at three frequencies (P-, L-, C-bands) on a single pass.
AirSAR was the primary full-pol SAR system for almost 20 years. A brief description of a selection of important airborne and space-borne
SAR systems is provided in what follows.
9
1 . 1 . 1 Airborne Polarimetric SARs
AirSAR ( NASA / JPL , 1988 – 2004 ): The Airborne SAR ( AirSAR ) was a high-resolution, side-looking, full-polarimetric, multi-frequency
SAR system, capable of simultaneously imaging in P-( 0 . 45 GHz), L-( 1 . 26 GHz) and C-( 5 . 31 GHz) bands. It could also collect two types of L- and C-band interferometric data: Cross-Track Inter- ferometric ( XTI ) data, sensitive to topography, and Along-Track Interferometric ( ATI ) data, used to measure ocean surface cur- rents. AirSAR was designed and built by NASA / JPL . It flew in 1988 for the first time, and in 2004 for its last mission, serving as a NASA radar technology testbed for demonstrating new radar technology. Detailed technical specifications can be found in [ 30 , 31 ]. An enhancement of the standard AirSAR quick-look pro- cessor was the AirSAR CYCLOPS , designed to provide amplitude imagery over large range and azimuth swaths [ 32 ].
UAVSAR ( NASA / JPL , 2007 –present): The Uninhabited Aerial Ve- hicle Synthetic Aperture Radar ( UAVSAR ) is a reconfigurable, high-resolution, full-polarimetric L-band ( 1 . 26 GHz, 24 cm wave- length) airborne system, operational since 2009 , with a range bandwidth of 80 MHz ( 2 m range resolution), and a range swath greater than 16 km. UAVSAR is designed and built by NASA / JPL , as a successor to AirSAR , with a transmitted power greater than 2 kW, and a noise equivalent better than - 45 dB for most of the swath. Detailed technical specifications can be found in [ 33 , 34 ].
1 . 1 . 2 Space-Borne Polarimetric SARs
SIR-C / X-SAR ( NASA / DARA / ASI , 1994 ): The Space-borne Imaging Radar ( SIR )- C/X - SAR was the first full-polarimetric space-borne
SAR . It was a joint project of the NASA , the German Space Agency ( DARA ) and the Italian Space Agency ( ASI ). It flew twice aboard the NASA space shuttle in 1994 . The SIR - C/X - SAR antenna structure consisted of three individual antennas, one operating at L-band ( 23 . 5 cm wavelength), one at C-band ( 5 . 8 cm wave- length) and the third at X-band ( 3 cm wavelength). The L- and C-band antennas were constructed from separate panels provid- ing the first quad-pol image data from space. Detailed technical specifications can be found in [ 35 , 36 ].
ENVISAT ASAR ( ESA , 2002 – 2012 ): ENVISAT was the ESA 's largest civil-
ian Earth observation mission. It was launched in 2002 with 10
instruments aboard, capable of providing measurements of the
atmosphere, ocean, land, and ice. One of the instruments was
the Advanced Synthetic Aperture Radar ( ASAR ), operating at
C-band ( 5 . 331 GHz), with sophisticated capabilities in terms of
1 . 1 a i r b o r n e a n d s pa c e - b o r n e p o l a r i m e t r i c s a r s y s t e m s 11
coverage, range of incidence angles, polarization, and modes of operation. The ENVISAT ASAR was not a full-polarimetric instru- ment; in its alternating polarization mode, dual-pol data, i. e., HH-HV, VH-VV, or HH-VV, were provided with spatial resolu- tion of approximately 30 m. Detailed technical specifications can be found in [ 37 ].
ALOS - PALSAR ( JAXA / JAROS , 2006 –present): The Advanced Land Ob- serving Satellite ( ALOS ) is a Japanese Earth-observing satellite, launched in 2006 , with three remote-sensing instruments. The Phased Array type L-band SAR ( PALSAR ) is its polarimetric instru- ment providing both full-pol data (with a resolution of 24 – 89 m) and dual-pol data (at a resolution of down to 14 m). The develop- ment of PALSAR was a joint project between the Japan Aerospace Exploration Agency ( JAXA ) and the Japan Resources Observation System Organization ( JAROS ). Detailed technical specifications can be found in [ 38 ].
RADARSAT-2 ( CSA / MDA , 2007 –present): RADARSAT-2 is a Canadian C-band ( 5 . 405 GHz) SAR satellite, and a major data source for commercial applications and remote sensing science, providing valuable information for different application areas, including coastal and marine surveillance, agriculture, forestry, oceanogra- phy, and ice monitoring. RADARSAT-2 is a unique collaboration be- tween the government—the Canadian Space Agency ( CSA ), and the industry—MacDonald, Dettwiler and Associates Ltd. ( MDA ).
It supports right- and left-look imaging, and provides both full- pol and dual-pol data. Detailed technical specifications can be found in [ 39 , 40 ].
TerraSAR-X ( BMBF / DLR /Astrium GmbH, 2007 –present): TerraSAR-X is a German radar satellite realized in a public-private partnership between the German Ministry of Education and Science ( BMBF ), the German Aerospace Center ( DLR ), and the European Aero- nautic Defense and Space Company ( EADS ) Astrium GmbH. The satellite design is based on technology and knowledge achieved from the successful SAR missions such as SIR - C/X - SAR . The SAR
sensor at X-band operates in different operation modes and resolutions. Launched in 2007 , TerraSAR-X provides single- and dual-pol data in operation modes. On an experimental basis, full-pol mode and along-track interferometry are also possible.
Detailed technical specifications can be found in [ 41 ].
Sentinel-1 ( ESA , 2013 ): Sentinel-1 is a future radar imaging satellite from
ESA for land and ocean services. Its C-band single- and dual- pol SAR is the core element of the mission, operational in four different observation modes enabling Sentinel-1 to respond to a wide range of varying requirements. A launch date around 2013 is foreseen. Sentinel- 1 will provide incoherent (intensity) data at high spatial resolution, large coverage, and reliable repetition rates. Detailed technical specifications can be found in [ 42 ].
RCM ( CSA / MDA , 2016 ): The RADARSAT-2 Constellation Mission ( RCM ), expected in 2016 , is a CSA / MDA multi-satellite follow up to the RADARSAT-2 program with the objective of ensuring C-band data continuity, enhanced operational use of SAR data and im- proved system reliability over the next decade. The RCM is be- ing designed for three main uses: maritime surveillance (ice, wind, oil pollution and ship monitoring); disaster management (mitigation, warning, response and recovery); and ecosystem monitoring (forestry, agriculture, wetlands and coastal change monitoring). In addition to RADARSAT-2 polarimetric modes, RCM
will provide new compact polarimetric data, achieved by a sin- gle transmit of circular polarization and simultaneous coherent linear receptions. Detailed technical specifications can be found in [ 23 ].
Now that we have overviewed a number of airborne and space- borne polarimetric SAR systems, we address, in the next section, the basics of polarized electromagnetic waves and polarimetric radar scatterings; in particular, we introduce the definitions of the Jones vector, the polarimetric scattering and covariance matrices, the Stokes vector, and the Degree of Polarization ( DoP ).
1 . 2 p o l a r i z at i o n c h a r a c t e r i s t i c s
Jones Vector: Considering a right-handed system ( u ˆ H , ˆ u V , ˆ u ) , an elec- tromagnetic, monochromatic plane wave propagating along ˆ u is ex- pressed as
~ E ( u, t ) = ~ Ee i ( ωt − νu ) ( 1 . 1 )
where ω is the angular frequency, ν is the wavenumber, ~ E = E H u ˆ H +
E V u ˆ V is a complex two dimensional vector, and ( u ˆ H , ˆ u V ) forms a
basis with two orthogonal unit vectors. The polarization state of an
electromagnetic wave is determined from the amplitudes of E H and
E V , and the relative phase between them.
1 . 2 p o l a r i z at i o n c h a r a c t e r i s t i c s 13
We note that, ~ E represented in vector form, and denoted as E = ( E H , E V ) T , is called the Jones vector [ 43 ].
Polarimetric Covariance Matrix: In order to deal with a partially polarized wave, either the covariance matrix of E or the Stokes vector can be used. The covariance matrix of E is defined as [ 1 , 44 ]
Γ = E
h EE † i
( 1 . 2 )
= E
| E H | 2 E [ E H E V ∗ ]
E [ E V E H ∗ ] E
| E V | 2
!
( 1 . 3 ) where E [ · ] is the expectation operator, † the conjugate transpose, ∗ the complex conjugate, and | · | denotes the magnitude of the complex field. The covariance matrix Γ is a non-negative Hermitian matrix whose diagonal terms are the intensity components (in the H and V directions), and the cross terms are complex correlations between the Jones components. Without loss of generality, the above covariance matrix can be parametrized by a = ( a 1 , a 2 , a 3 , a 4 ) T as
Γ = E
h EE † i
, a 1 a 3 + ia 4 a 3 − ia 4 a 2
!
. ( 1 . 4 ) The covariance matrix has great statistical properties and is a con- venient representation for polarimetric data in many applications.
Multilook polarimetric SAR processing (see § 1 . 3 ) can be simply per- formed by averaging several independent 1 -look covariance matrices.
The multilook (empirical) covariance matrix, denoted as Γ, is given by Γ = D EE † E
=
| E H | 2 h E H E V ∗ i h E V E H ∗ i | E V | 2
!
( 1 . 5 ) where h · i denotes the ensemble averaging. The polarization state of an electromagnetic wave can also be completely described through the observable power terms of the Stokes vector.
Stokes Vector: In his remarkable paper of 1852 , Stokes [ 45 ] intro- duced four measurable quantities, known as the Stokes parameters, for describing the properties of polarized light. Let us consider the Pauli group of matrices expressed as
σ 0 = 1 0 0 1
!
σ 1 = 1 0 0 − 1
!
( 1 . 6 )
σ 2 = 0 1 1 0
!
σ 3 = 0 − i i 0
!
. ( 1 . 7 )
Therefore, the multi-look covariance matrix Γ can be decomposed as [ 46 , 47 ] Γ = D EE † E
=
| E H | 2 h E H E V ∗ i h E V E H ∗ i | E V | 2
!
= 1
2 ( g 0 σ 0 + g 1 σ 1 + g 2 σ 2 + g 3 σ 3 )
= 1 2
g 0 + g 1 g 2 − ig 3
g 2 + ig 3 g 0 − g 1
!
( 1 . 8 )
where the parameters { g 0 , g 1 , g 2 , g 3 } are called the Stokes parameters, and the vector
g =
g 0 g 1 g 2 g 3
=
D | E H | 2 + | E V | 2 E D | E H | 2 − | E V | 2 E
2 < h E H E ∗ V i
− 2 = h E H E V ∗ i
( 1 . 9 )
is called the Stokes vector. In these expressions, E is the complex electric field received in the subscripted polarization, h · i denotes ensemble averaging (multilooking in the SAR context), and < and
= denote the real and imaginary part of the complex field respectively.
As it can be observed, the Jones vector and consequently the polari- metric covariance matrix are determined by two complex quantities which can only be obtained through the use of a coherent radar sys- tem (measuring both amplitude and phase). The availability of such coherent systems is relatively recent. In the past, only non-coherent systems, measuring the power terms of an incoming wave, were avail- able. Consequently, it was necessary to characterize the polarization of a wave only by power measurements (real quantities) through the Stokes vector. Several useful quantitative measures follow from the Stokes formalism for SAR data. These measures include the DoP , the de- gree of linear polarization, the degree of circular polarization, circular polarization ratio, and linear polarization ratio.
Degree of Polarization: This scalar parameter has been considered as the most important parameter characterizing a partially polarized electromagnetic wave [ 44 , 48 ]. The DoP in terms of the covariance matrix elements is expressed as [ 44 ]
P = 1 − 4 | Γ | ( trΓ ) 2
!
12( 1 . 10 )
= 1 − 4
a 1 a 2 − ( a 2 3 + a 2 4 ) ( a 1 + a 2 ) 2
!
12( 1 . 11 )
where | Γ | and trΓ are the determinant and trace of Γ respectively. The
wave is totally depolarized for P = 0, totally polarized for P = 1,
1 . 2 p o l a r i z at i o n c h a r a c t e r i s t i c s 15
and partially polarized when P ∈ ] 0, 1 [ . Since ( 1 . 10 ) is invariant under unitary transformations (such as rotation), the DoP does not depend on the particular orthogonal pair of polarimetric channels chosen to measure the backscattered wave [ 49 ]. In other words, the
DoP is invariant of the (receiver) polarization basis. Estimation of the
DoP from expression ( 1 . 10 ) can be conducted by estimating the four parameters of the covariance matrix, i. e., a i , i = 1, . . . , 4.
The DoP is equivalently defined in terms of the Stokes parameters as
P = q
g 2 1 + g 2 2 + g 2 3
g 0 . ( 1 . 12 )
Mathematically, on the Poincaré sphere, the DoP represents the distance of a normalized Stokes vector's last three components from the origin.
The surface of the unit Poincaré sphere corresponds to P = 1, and represents all totally polarized states [ 50 ].
Degree of Depolarization: Once polarized wave interacts with a ran- dom medium, the polarization state of the backscattered wave may change. Hence, depolarization is associated with a reduction in the polarization of incident states. The Degree of Depolarization ( DoD ) is defined as
P = 1 − P . ( 1 . 13 ) A depolarizing interaction causes the totally polarized Stokes states on the surface of the Poincaré sphere to emerge with P < 1 ( P > 0).
The sister parameters of the DoP and DoD are defined as follows.
Degree of Polarization Uniformity: Denoted as P U , it is defined as P U = g 2 1 + g 2 2 + g 2 3
12. ( 1 . 14 )
Degree of Linear Polarization: Denoted as P L , it is defined as P L = g
2 1 + g 2 2
12g 0 . ( 1 . 15 )
Degree of Circular Polarization: Denoted as P C , it is defined as P C = g 3
g 0 . ( 1 . 16 )
Circular Polarization Ratio: Denoted as µ C , it is defined as µ C = g 0 − g 3
g 0 + g 3 . ( 1 . 17 ) Linear Polarization Ratio: Denoted as µ L , it is defined as
µ L = g 0 − g 1
g 0 + g 1 ( 1 . 18 )
Modi ed Stokes Vector: We consider a modified Stokes vector e g as
e g =
e g 0 e g 1 e g 2 e g 3
= 1 2
g 0 + g 1 g 0 − g 1
g 0 + g 2 g 0 + g 3
. ( 1 . 19 )
In this dissertation, we show that the modified Stokes vector e g is of great mathematical interest, 1 and employ it to derive simple estimators of the DoP (Chapter 3 ). Throughout this manuscript, we refer to the four elements of e g as four intensity images. We also consider that for each intensity image, q looks are taken.
Sinclair Matrix: Full polarimetric radar systems measure the complex- valued elements of the so-called Sinclair matrix [ 51 ] (also known as scattering matrix). The Sinclair matrix S relates the electric vector E r of the received (or backscattered) field to the transmitted (or incident) illumination E t by
E r = SE t S = S HH S HV S VH S VV
!
. ( 1 . 20 ) Scattering Vector: In the bistatic scattering case, the scattering vector corresponding to the Sinclair matrix is defined as [ 52 ]
k FP =
S HH S HV S VH
S VV
. ( 1 . 21 )
The related covariance matrix is expressed as C FP = D k FP k FP † E
=
*
| S HH | 2 S HH S HV ∗ S HH S ∗ VH S HH S ∗ VV S HV S HH ∗ | S HV | 2 S HV S VH ∗ S HV S ∗ VV S VH S HH ∗ S VH S ∗ HV | S VH | 2 S VH S ∗ VV S VV S ∗ HH S VV S ∗ HV S VV S ∗ VH | S VV | 2
+
. ( 1 . 22 )
Pauli RGB : Pauli RGB images are commonly used for visual presenta- tion of PolSAR data. A Pauli RGB image is created from a full-pol data set as
Red = | S HH − S VV | ( 1 . 23 ) Green = | S HV + S VH | ( 1 . 24 )
Blue = | S HH + S VV | . ( 1 . 25 )
1
in addition to its physical relevance in optical polarimetric imagery,
detailed in [ 50 ].
1 . 3 s p e c k l e n o i s e 17
Scattering Reciprocity: In a monostatic ∗ configuration, the reciprocity property holds for most targets. Under the scattering reciprocity, and in the backscatter alignment convention, we have S HV = S VH [ 53 – 55 ].
Therefore, the corresponding scattering vector is expressed as .
∗
A monostatic radar uses a common antenna for both transmission and reception.
k sr FP =
S HH
√ 2S HV S VV
( 1 . 26 )
where the factor √
2 ensures the total power invariance.
Barakat Full-Pol DoP: The Barakat DoP is one of the well-known generalizations of the DoP . For a full polarimetric SAR , and under the scattering reciprocity, the Barakat DoP P 3 , and DoD P 3 are expressed as
P 3 =
"
1 − 27 | Γ 3 | ( tr Γ 3 ) 3
#
12( 1 . 27 ) P 3 = 1 − P 3 ( 1 . 28 ) where the subscript 3 indicates the three-dimensional formalism and Γ 3 is the 3 × 3 covariance matrix.
Images observed by SAR systems are degraded by speckle noise due to coherent interference of waves reflected from many elementary scatterers. Next section provides a brief description of the speckle noise.
1 . 3 s p e c k l e n o i s e
Speckle is inherent in SAR images. It is a natural phenomenon which acts like a noise source, but unlike system noise, cannot be avoided.
Speckle noise is a predominantly multiplicative noise which generates a grainy structure in the image and reduces the precision of the mea- surements [ 52 , 56 ]. It is caused by coherent processing of backscattered signals from multiple distributed targets [ 57 ], and can cause difficul- ties for image interpretation [ 58 , 59 ]. Speckle noise is refered to as the fully developed speckle, under the following conditions: a large number of scatterers is present in a resolution cell of a homogeneous medium;
the range distance is much larger than many radar wavelengths; the surface is much rougher on the scale of the radar wavelength. The fully developed speckle is characterized by a Rayleigh distribution [ 60 ].
Speckle noise in SAR images can be reduced by multilook processing (non-coherent) or spatial filtering (post image-formation methods).
While multi-look processing is usually done during data acquisi-
tion stage, speckle reduction by spatial filtering is performed on the
image after it is acquired. Through multilook processing, a speckle-
reduced image is obtained by averaging multiple independent mea-
surements [ 61 , 62 ]. The majority of SAR systems perform the multilook
processing on-board. The number of looks, i. e., the number of inde- pendent samples included in the average, plays an important role in this process.
Speckle filtering is also an important step for consistent estimation of scattering mechanisms of distributed targets. However, such fil- tering can potentially eliminate actual image information as well; in particular the high-frequency information. Among the widely used (adaptive and non-adaptive) filters are Median, Gamma, Lee [ 63 ], re- fined Lee [ 64 ], Kuan [ 65 ], and Frost [ 66 ] filters. Detailed description of the PolSAR speckle filtering principles are provided in [ 52 , 67 ] and references therein.
For PolSAR data, the statistical characteristic of the covariance matrix is well described by the complex Wishart distribution, based on which the probability density functions of relative phase and intensities can be derived. In what follows we focus on some important probabil- ity distributions (Gaussian, Wishart, Gamma) used throughout this manuscript.
1 . 4 t h e o r e t i c a l p r o b a b i l i t y d i s t r i b u t i o n s 1 . 4 . 1 Multivariate Complex Gaussian Distribution
A p-variate complex Gaussian random variable ξ = Z 1 , . . . , Z p T
, Z j = X j + iY j , is a p-tuple of complex Gaussian random variables such that the vector of real and imaginary parts X 1 , Y 1 , . . . , X p , Y p T
has a 2p- variate Gaussian distribution. When the Gaussian random variables X j and Y j are assumed to have zero mean, the distribution of ξ is fully specified by its p × p Hermitian positive definite complex covariance matrix Σ ξ . The Probability Density Function ( PDF ) of a zero mean p-variate complex Gaussian distribution is given by [ 68 ]
p
G( ξ ) = 1 π p
Σ ξ
exp
− ξ † Σ − ξ 1 ξ
( 1 . 29 ) where Σ ξ is the covariance matrix and |·| represents the determinant.
If ξ 1 , ξ 2 , . . . , ξ q is a sample of q independent complex-valued vectors from such a distribution, then the sample Hermitian covariance matrix
Σ ˆ ξ = 1 q
∑ q j = 1
ξ j ξ † j ( 1 . 30 ) is the maximum likelihood estimator of Σ ξ . The estimator ˆ Σ ξ is a sufficient statistic for the Hermitian covariance matrix Σ ξ [ 68 ].
1 . 4 . 2 Multivariate Complex Wishart Distribution
Let us consider ξ as a zero-mean p-variate complex Gaussian ran-
dom vector. The joint distribution of the elements of the matrix
1 . 4 t h e o r e t i c a l p r o b a b i l i t y d i s t r i b u t i o n s 19
A ξ = q Σ ˆ ξ is called a complex Wishart distribution whose PDF is ex- pressed as [ 68 , th. 5 . 1 ]
p
WA ξ
= A ξ
q − p
B Σ ξ
exp h
− tr Σ − ξ 1 A ξ i
( 1 . 31 ) where B Σ ξ
= π
1
2