HAL Id: hal-01591538
https://hal.archives-ouvertes.fr/hal-01591538
Submitted on 21 Sep 2017HAL is a multi-disciplinary open access archive for the deposit and dissemination of sci-entific research documents, whether they are pub-lished or not. The documents may come from teaching and research institutions in France or abroad, or from public or private research centers.
L’archive ouverte pluridisciplinaire HAL, est destinée au dépôt et à la diffusion de documents scientifiques de niveau recherche, publiés ou non, émanant des établissements d’enseignement et de recherche français ou étrangers, des laboratoires publics ou privés.
Impact of maintenance operations on the seasonal
evolution of ditch properties and functions
Jeanne Dollinger, Fabrice Vinatier, Marc Voltz, Cécile Dagès, Jean-Stéphane
Bailly
To cite this version:
Jeanne Dollinger, Fabrice Vinatier, Marc Voltz, Cécile Dagès, Jean-Stéphane Bailly. Impact of main-tenance operations on the seasonal evolution of ditch properties and functions. Agricultural Water Management, Elsevier Masson, 2017, 193, pp.191-204. �10.1016/j.agwat.2017.08.013�. �hal-01591538�
Agricultural Water Management 193 (2017) 191–204
12
Impact of maintenance operations on the seasonal evolution of ditch
3
properties and functions
4 5
Jeanne Dollinger*1, Fabrice Vinatier1, Marc Voltz1, Cécile Dagès1, Jean-Stéphane Bailly2
6
1INRA, UMR LISAH, 2 place Pierre Viala, 34060 Montpellier Cedex 1, France
7
2AgroParisTech, UMR LISAH, 2 place Pierre Viala, 34060 Montpellier Cedex 1, France
8 9
DOI: http://dx.doi.org/10.1016/j.agwat.2017.08.013 10
11
Abstract: Ditch networks were traditionally designed to protect fields from soil erosion or control
12
waterlogging. They are still frequently managed by either mowing, chemical weeding, dredging or 13
burning to ensure their optimal hydraulic capacity. Ditches were recently reported also to improve 14
water quality and sustain biodiversity. These ditch functions are related to specific ditch properties. By 15
contrastingly modifying ditch properties, maintenance operations were supposed to regulate these 16
functions. There is, therefore, a need to re-examine the design and maintenance strategies of ditches 17
to optimize the whole range of ecosystem services that they provide. In this study, we address the 18
innovator question of how maintenance operations affect the yearly evolution of ditch properties, and 19
in turn, the panel of functions that ditches support. During one year, we monitored the vegetation, 20
litter, soil properties, and ash cover of five ditches that were being unmanaged, dredged, mowed, 21
burned, and chemically weeded, respectively, with timing and frequency as generally operated by 22
farmers in the study area. We then used indicators to evaluate the effect that the evolution of these 23
properties has on the ditch water conveyance, herbicide retention and biodiversity conservation 24
functions. We found that the evolution of these properties significantly contrasted among the 5 25
maintenance strategies. All the maintenance operations cleared the vegetation, which improves the 26
hydraulic capacity by up to 3 times. The optimal hydraulic capacity is maintained longer after chemical 27
weeding and dredging, but these operations have negative impacts on the herbicide retention and 28
biodiversity conservation functions. The litter and ash layers generated by mowing and burning, 29
respectively, improve the herbicide retention by up to 45%. Our results confirm that maintenance can 30
be an efficient tool for optimizing ditch functions. The choice of maintenance operation and timing are 31
key to successfully optimizing most of the functions that ditches can support. 32
33
Keywords: Maintenance operations; intermittently flooded ditch; ecosystem services; herbicides
34
retention; water conveyance; biodiversity conservation 35
36
Highlights:
37
We used indicators to evaluate the evolution of ditch functions after maintenance. 38
Maintenance is an efficient and operational tool for optimizing ditch functions. 39
The choice of maintenance operation and timing are key to optimize multiple functions. 40
The primary 4 maintenance operations generate contrasted ditch properties evolution. 41
Burning and mowing improved the best water quality and biodiversity functions. 42
43
1. Introduction
44
Farm ditches are infrastructures that have been used for centuries by farmers to regulate excess water 45
fluxes in cropped areas, which, depending on the pedoclimatic context, were used either to protect 46
crop fields from soil erosion or to control waterlogging (Dollinger et al., 2015; Levavasseur, 2012; 47
Levavasseur et al., 2014). The design of these human-made channels, which are arranged as networks 48
in cropped catchments, was optimized over time to efficiently collect runoff and drainage fluxes and 49
rapidly evacuate them towards receiving water bodies (Levavasseur et al., 2014, 2016). Additionally, 50
these infrastructures have also recently been reported to sustain biodiversity, buffer agricultural non-51
point source pollutions or participate in groundwater recharge and flood regulation, depending on 52
their properties (e.g., Dollinger et al., 2015; Herzon and Helenius, 2008; Needelman et al., 2007). 53
As part of a more global strategy that aims to limit the adverse effects of intensive agriculture on the 54
environment, the interest in promoting those ditch functions that are not directly involved in 55
protecting crops from waterlogging and soil losses is growing (Dollinger et al., 2015; Herzon and 56
Helenius, 2008; Needelman et al., 2007). This interest is particularly the case for non-point source 57
pollution buffering and biodiversity conservation ditch functions. For instance, pesticides sprayed in 58
intensive crop systems to protect crops from pests and weeds may be partly dissolved by runoff and 59
drainage fluxes and then transferred towards surface water bodies or groundwater via ditch networks 60
(Louchart et al., 2001; Tang et al., 2012).This non-point source pollution threatens the quality and 61
ecological health of these water bodies, thereby restricting specific usages, such as drinking water 62
supply, and engendering significant depollution costs around the world (Reichenberger et al., 2007; 63
Schultz et al., 1995). Therefore, there is a need to re-examine the design and maintenance strategies 64
of ditches to optimize the whole range of ecosystem services that they provide. In this paper, we 65
address the specific issue of the impact of maintenance practices on the ditch functions. Ditches are 66
distinguished here from irrigation channels, as, even though they might share design and maintenance 67
similarities, their flooding regime is greatly contrasted. 68
Ditch maintenance strategies originally aimed to preserve an optimal hydraulic capacity thanks to 69
frequent vegetation clearance (Dollinger et al., 2015; Levavasseur et al., 2014, 2016). Ditch 70
maintenance primarily consists of the succession in time and location of some of the 4 basic 71
operations, which are ditch mowing, dredging, chemical weeding and burning (Dollinger et al., 2015; 72
Levavasseur, 2012). The frequency and timing of these maintenance operations differ. Ditch dredging 73
is usually performed once every 5 to 10 years but can be more frequent in the case of small in-field 74
ditches that are designed to protect sloping croplands from erosion (Bailly et al., 2015a; Levavasseur, 75
2012;Smith and Pappas, 2007). Mowing, chemical weeding and burning are usually performed at least 76
once a year (Bailly et al., 2015a; Levavasseur, 2012; Levavasseur et al., 2014; Smith and Pappas, 2007). 77
Moreover, a given ditch is very likely to undergo a combination of maintenance operations every year. 78
While chemical weeding, mowing and dredging are usually performed from spring to late summer, 79
burning is performed in winter when the vegetation dries out. This operation is thereby restricted to 80
the highland or semi-arid areas where there is no base-flow in the ditches during winter (e.g., Bailly et 81
al., 2015a). 82
The maintenance of ditches, by modifying their properties, also modulates the occurrence and 83
intensity of the biogeochemical processes involved in the multiple functions supported by ditches 84
(Dollinger et al., 2015). The change in ditch properties after maintenance may favour certain functions 85
over others as an intensity shift of a given biogeochemical process may favour a function or a group of 86
functions and be disadvantageous to others (Dollinger et al., 2015). Designing ditch maintenance 87
strategies for sustaining a panel of functions, including those for which the ditches were created, 88
requires a good knowledge of how each maintenance operation modifies the ditch properties, not only 89
immediately but also after their mid-term evolution. Few studies have attempted to describe the 90
spatial and temporal variability of ditch properties along networks and link them to maintenance 91
strategies (Bailly et al., 2015a; Lecce et al., 2006; Levavasseur et al., 2014). However, to our knowledge, 92
the effect of the maintenance operations on the mid- evolution of ditch properties and how this 93
evolution affects a panel of functions has never been described in the literature. 94
In accordance with these gaps of knowledge, the objectives of this study are to i) experimentally assess 95
the mid-term evolution of ditch properties after each maintenance operation, ii) evaluate with semi-96
quantitative indicators the influence of these ditch property evolutions on the hydraulic capacity, 97
herbicide retention and biodiversity of the ditches, and iii) try to identify maintenance operations or 98
strategies that could jointly sustain a panel of functions. The study was conducted during one year in 99
South of France in a vineyard area that is subjected to rare but highly intensive rainfall events and 100
where ditch networks were originally designed to prevent soil erosion. 101
102 103
2. Materials and methods
104 105 2.1 Experimental design 106 2.1.1 Study site 107
The study site is located in the downstream part of the Bourdic catchment in South of France (43°5’ 108
Nord, 3°3’ East). This 6.4 km² catchment, primarily covered by vineyards, is subject to a Mediterranean 109
climate, which is characterized by rare but high-intensity rainfall events that occur mostly in spring and 110
fall (Levavasseur et al., 2012). The dense ditch network is managed in the catchment with the principal 111
aim of preventing soil loss by erosion (Levavasseur et al., 2016). 112
The study site is a ditch receiving both drainage (groundwater exfiltration flux) and runoff (overland 113
flow) water from the surrounding vineyards. The ditch length is approximately 120 m, its bottom width 114
64 cm, its top width 160 cm, its depth 54 cm and its slope 0.33%. As described in Fig. 1, for the 115
experiments, the ditch was divided into 4 sections or ‘’patterns’’, each sub-divided into 5 quadrats 116
being 4 m long each. The first quadrat of each pattern is an un-managed control. Then, proceeding 117
from the upstream to downstream direction, the quadrats are dredged, mowed, burned and 118
chemically weeded, respectively. Moreover, the quadrats are separated from each other by 2-m long 119
unmanaged buffer sections. 120
The ditch was equipped, in the middle unmanaged area, with a capacity sensor (Crabit et al., 2011a; 121
Crabit et al., 2011b), which monitored the water level fluctuations with a 60-min frequency. Two water 122
wells, one located upstream and the second 100 m downstream from the ditch outlet, allowed the 123
manual monitoring of the groundwater level. Rainfall data were obtained from the Roujan catchment 124
meteorological station located only 1.5 km from the study site. 125
The monthly cumulated rainfall amounts during the experiment period were compared to the rainfall 126
distributions observed at the same meteorological station from 1992 to 2016 (Fig. S1). This comparison 127
shows that fall 2015 was dryer than usual. Indeed, the cumulated rainfall amounts for September, 128
October and November were in the very bottom range of the rainfall distributions for these months. 129
Moreover, spring 2015 was slightly dryer than usual, particularly in May, but spring 2016 was slightly 130 wetter. 131 132 2.1.2 Maintenance design 133
The maintenance strategy was designed to mimic the frequencies and timings typically used by farmers 134
in the study area (Levavasseur et al., 2014). The first maintenance campaign was initiated on April 7th,
135
2015 with burning and chemical weeding. The dredging operations were spread between April 23rd
136
and May 5th, 2015 because of the greatly differing soil humidity conditions among the patterns.
137
Mowing was performed on June 4th and then again on September 7th, 2015. The second campaign
138
started on February 17th, 2016 with burning, then chemical weeding on April 13th, 2016. A given
139
quadrat was submitted only to one maintenance operation type throughout the experiment. Figure 2 140
depicts how each management operation was performed for this study. 141
142
2.1.3 Monitoring of ditch properties
143
The ditch properties were surveyed on each quadrat using a semi-quantitative method (Bailly et al., 144
2015a; Dollinger et al., 2016; Levavasseur et al., 2014). This method consists of first, precisely 145
measuring the morphological properties of the ditch in each pattern. The cross-section profile (upper 146
width, lower width and depths) was measured manually, whereas the length and slope were measured 147
with a theodolite and a differential GPS. Second, in each quadrat, the proportion of the ditch bottom 148
and walls covered by vegetation, litter and ash (in %) and the depths of these respective layers (in cm) 149
were visually estimated. The visual estimations were initially performed by 2 independent observers 150
and then calibrated against each other. The precision of the estimates was approximately 10 to 15% 151
for the covering area and 1 cm for the material layer depth. Last, the litter was classified into 3 different 152
types (dead leaves, hay, and decayed plant residues) and the vegetation into either an herbaceous or 153
ligneous type. During the surveys, the vegetation height was classified as <15 cm, >15 cm or mixed 154
(several vegetation heights all between 0 and 15 cm) and then, converted to 10 cm (maximal 155
vegetation height in this class), 54 cm and 15 cm (maximal vegetation height in this class) height for 156
each class, respectively. The vegetation classified as >15 is, most of the time, as high or even higher 157
than the ditch depth (54 cm) which was thereby taken as default value for this class as it’s the maximum 158
vegetation height that can influence the various ditch functions. The presence or absence of flowers 159
was also monitored. 160
The surveys were conducted every 15 days between April and July and then every month the 161
remainder of the year. In total, 19 ditch property monitoring surveys were conducted between April 162
2015 and May 2016. 163
Soil samples were collected in the upper horizon (0-2 cm) of the 4 control quadrats during July 2015 164
for physicochemical properties measurements. The particle size distributions, pH values, cation 165
exchange capacities (CEC) and organic carbon content of the soil samples were measured at the INRA 166
Soil Analysis Laboratory in Arras (France) using normalized methods. Particle size distribution was 167
measured with the standardized method NF X 31-107, pHH2O with the method NF ISO 10390, CEC
168
Metson with the method NF X 31-130 and OC content with the method NF ISO 10694. To detect any 169
change in soil properties according to the maintenance operations, these properties were again 170
measured on the soil samples collected from the upper 2 cm layer on all quadrats during April 2016, 171
i.e., after approximately 9 months of the distinct maintenance strategies. 172
The soil bulk densities were estimated by sampling a known volume of soil and measuring the dry 173
weight after oven drying for 24 h at 105°C. Six replicates were performed for each quadrat during April 174
2016. 175
176
2.2 Calculation of the pesticide retention indicator
177
For a given pesticide, the retention capacity of a ditch depends on its properties and more specifically, 178
on the abundance and characteristics of the ditch materials in contact with the water column (Dollinger 179
et al., 2016). Dollinger et al. (2016) proposed the sorption-induced pesticide retention indicator (SPRI), 180
which is based on a pesticide mass balance equation and integrates the influence of several factors to 181
evaluate the proportion of pesticides that is potentially retained by sorption processes as it passes 182
through a ditch during a flood event. The factors integrated into the calculation of the SPRI indicator 183
are i) the amount and properties of ditch materials in contact with the water column, ii) the pesticide 184
sorption properties and iii) the flood characteristics (volume, water level). For the purpose of this 185
study, this indicator was used as a means to compare how the different implemented maintenance 186
designs affect the herbicide retention functions of the ditches. 187
𝑆𝑃𝑅𝐼(%) = ∑𝑛𝑖=1𝑀𝑖𝐾𝑑𝑖
∑𝑛𝑖=1𝑀𝑖𝐾𝑑𝑖+𝑉100 (Equation 1)
where Mi is the mass of material i and i is one of the ditch materials [soil (s), decaying (DV) and living
189
vegetation (veg) (g)]; Kdi is the sorption coefficient of material i and V is the volume of water flowing
190
through the ditch during a flood event(cm3).
191
The theory and hypotheses underlying the estimation of pesticide retention in ditches during a flood 192
event with SPRI are detailed in Dollinger et al. (2016). The SPRI indicator was calculated for 2 193
herbicides, glyphosate (N-(Phosphonomethyl)glycine) and diuron (3-(3,4-dichlorophenyl)-1,1-194
dimethyl-urea), which are frequently detected in the water columns of ditches in the study area at 195
concentrations reaching up 1,000 µg l-1 (Dages et al., 2015; Louchart et al., 2001). The SPRI values were
196
calculated for both herbicides on the 19 dates during the year when the ditches were surveyed and for 197
all 20 quadrats. The sorption coefficients of diuron used for the SPRI calculation were 8.6 l kg-1 for soil,
198
3.2 l kg-1 for plants, 46.5 l kg-1 for dead leaves, 28.6 l kg-1 for mowing residues and 1,009.1 l kg-1 for ash;
199
those of glyphosate were 26.2 l kg-1 for soil, 2.0 l kg-1 for plants, 4.4 l kg-1 for dead leaves, 0.8 l kg-1 for
200
mowing residues and 23.6 l kg-1 for ash (Dollinger et al., 2016).
201
The masses of the soil, vegetation, litter and ash materials were calculated as described in Dollinger et 202
al. (2016) from the ditch properties estimated during the surveys, namely, the percentages of the ditch 203
bottom coverage, depths, porosities and bulk densities of all material layers. The values of porosity 204
factors used were those described in Dollinger et al. (2016) for each type of material. The volume of 205
flowing water was set to 122 m3, which corresponds to a typical flood event in the study area generated
206
by a one-month return period rainfall event (Bailly et al., 2015a). The flood usually generated by this 207
type of event lasts approximately 12h and 20 min, and its flow rate is approximately 2.75 10-3 m3 s-1.
208 209 210
2.3 Calculation of the hydraulic capacity
211
The waterlogging control and soil erosion prevention functions, for which ditches were created and 212
managed, both rely on an efficient water conveyance capacity of the ditches (Dollinger etal., 2015). 213
The water conveyance capacity of ditches is related to their shape and roughness (Boutron et al., 2011; 214
Crabit et al., 2011b). The maximal flow rate (Qmax), which is reached when the water level equals the
215
ditch depth, is also called the hydraulic capacity or water conveyance capacity. This value was 216
calculated using the Manning-Strickler equation (Strickler,1923) and assuming flow uniformity (Eq. 2) 217
Qmax = K S Rh2/3 i1/2 (Equation 2)
where Qmax is the water conveyance capacity (m3 s-1), K is the Strickler coefficient (s-1), i is the slope(m
219
m-1), S is the ditch wet cross-section area (m²), Rh is the hydraulic radius (m) or the S/P ratio, and P is
220
the wetted perimeter (m). 221
The primary source of roughness in the ditches is the vegetation (e.g., Jarvela, 2002; Wu et al., 1999). 222
The roughness coefficients (Strickler coefficients, K) were estimated from the vegetation cover data 223
using the empirical Strickler database developed by Bailly et al., (2015b) from measurements in an 224
hydraulically equipped ditch with variable vegetation patches (Vinatier et al., In Press). 225
The ditch cross-section was considered trapezoidal and is characterized by the ditch bottom and top 226
widths and by the ditch depth. The wet cross-section area (S) is equivalent to the ditch cross-section 227
surface area as the water level equals the ditch depth in the calculation of the hydraulic capacity. The 228
wetted perimeter (P) is the sum of the ditch bottom and sidewalls length and the hydraulic radius (Rh) 229
is the ratio between S and P (S/P). 230
The water conveyance capacity of the 20 quadrats was calculated for the 19 dates during the year 231
when ditches were surveyed. 232
233
2.4 Establishment and calculation of the ecological indicators
234
The ditches sustain biodiversity in croplands by providing shelter, food and protected pathways for 235
connecting different populations of auxiliary insects, mammals, frogs or birds (Herzon and Helenius, 236
2008; Marja and Herzon, 2012). The link between the ditch properties and the abundance of certain 237
categories of insects or macrofauna has never been empirically quantified but can be approached 238
thanks to the work conducted on riverine landscapes (Ward, 1992),dry riverbeds (Steward et al., 2012; 239
Wishart, 2000), non-perennial streams (Chester and Robson, 2011) and riparian vegetation (Stella et 240
al., 2013). We assumed that the relations between systems characteristics and the biodiversity 241
described in those studies could be extended to Mediterranean ditches. The works of Dangles et al. 242
(2004), Johnson et al. (2003) and Murphy et al. (2012) show that detritivore insects are the primary 243
consumers of litter in several types of ecosystems. This category of insects relies on a sufficient litter 244
cover as their food sources. We thereby assumed that the litter layer in ditches favours these insects. 245
Second, the linear vegetated elements of landscapes improve the survival and development of insects 246
(Meier et al., 2005) and macrofauna (Andreassen et al., 1996) populations by providing sheltered 247
corridors. However, the surface of the ditch covered by vegetation and the vegetation height modulate 248
the shelter effect of a given ditch. Last, the blooming vegetation provides sources of nectar for auxiliary 249
insects (Nicholls et al., 2001; Sarthou et al., 2005). 250
To evaluate the influence of the ditch properties evolution on their ecological functions, we derived 251
qualitative indicators from these general ecological principles. These indicators are not designed to 252
quantify or qualify the progression of the biodiversity based on the progression of the ditch properties, 253
which would require more empirical work. The indicators only intend to describe the progression of 254
the conditions sustaining or disadvantaging the biodiversity as a function of the ditch properties. Based 255
on the ecological principles, we divided the ditch into 3 layers, the litter, vegetative and canopy layers 256
and computed an ecological indicator for each. The three indicators were calculated for each quadrat 257
as binary functions with thresholds for the respective layers based on i) the litter and surface covering, 258
ii) the vegetation height and surface covering, and iii) the presence of flowers. Considering the absence 259
of experimental data on these ecological functions in the ditches, we arbitrarily chose the thresholds 260
in accordance with the works on closed ecosystems (Andreassen et al., 1996; Chester and Robson, 261
2011) and to emphasize the difference between the maintenance treatments. The thresholds for the 262
litter layer were defined as 5 cm and 50% for height and cover, respectively. The thresholds for the 263
vegetation layer were defined as 20 cm and 50% for height and cover, respectively. Finally, the 264
threshold for the canopy layer was defined as the presence of at least 1 flower in the quadrat. For a 265
given quadrat, the value of every indicator is either 0 or 1. The value 1 represents a situation favouring 266
the biodiversity. For a given treatment, the value of every indicator is the average of the 4 replicates 267
and can, therefore, take the values 0, 0.25, 0.5 and 1. 268 269 270 3. Results 271 272
3.1 Influence of the maintenance operations on the mid-term evolution of ditch properties
273
Figure 3 describes the evolution of the living vegetation layer in all the treatments throughout the year. 274
It must be noted that the high variability of the vegetation height that can be observed among the 4 275
replicates of a given treatment is partly due to the conversion of vegetation height classes into 276
vegetation height. Figure 4 describes the contrasted evolution of the litter layers and Figure 5 the 277
difference in soil physicochemical properties among the treatments. 278
At the beginning of the experiments in April 2015, vegetation covered only approximately 30% of the 279
ditch bottom surface area and was short and scattered. At that time, the vegetation cover was 280
homogeneous all along the ditch. No litter or ash covering could be observed on any of the 20 quadrats 281
and the soil physicochemical properties were relatively homogeneous among the 4 control quadrats. 282
The evolution of the ditch properties for the 5 treatments, namely, no management, dredging, 283
mowing, burning and chemical weeding between April 2015 and May 2016 are described hereafter. 284
For the control treatment, the bottom surface areas of the quadrats were progressively colonized by 285
vegetation during the spring and summer (Fig. S2). The total vegetation covering was reached by about 286
September for all the control quadrats and persisted throughout the fall. Then, the vegetation cover 287
progressively decreased from December 2015 to April 2016. It must be noted that the vegetation 288
covering and density was higher in April 2016 than at the beginning of the experiments in April 2015. 289
This difference is probably due to the contrasting maintenance history in the previous year. Indeed, 290
before April 2015, the ditch was intensively managed, whereas between April 2015 and 2016, it was 291
left unmanaged. The evolution of the relative surface area covered by vegetation was progressive 292
throughout the year, but the vegetation growth and densification was very quick for this treatment. 293
Moreover, the litter layers on the control quadrats were scattered and thin until December, when the 294
progressive vegetation senescence generated a few litter inputs. The major litter inputs were due to 295
the collection of dead leaves from the surrounding vineyards during January 2016. The amount of dead 296
leaves collected considerably varied among the patterns because of their different orientation 297
regarding the dominant wind direction and vine rows. The control quadrats from patterns 2 to 4 298
collected most of this litter, whereas the control quadrat of the first pattern, which was not 299
perpendicular to the wind direction, collected almost nothing. The decrease of the litter layer depth 300
with time can be attributed to a progressive biotransformation and the settling generated by the 301
successive floods. Furthermore, the topsoil physicochemical properties only slightly evolved between 302
July 2015 and April 2016 on the control quadrats. A slight decrease in the clay fraction in favour of the 303
silt fraction can be reported as well as a slight pH rise. The organic carbon content and CEC did not 304
significantly change. 305
After the dredging treatment operation in April 2015, the vegetation recolonized the bottom surface 306
area of the quadrats very progressively throughout the year and stayed relatively short and scattered 307
(Fig. S3). The vegetation senescence during winter was weak and generated only very few litter inputs. 308
Similar to the control treatments, the primary litter provision was ensured by the collection of dead 309
leaves from the surrounding vineyards. These litter inputs were also heterogeneous among the 310
patterns, and an identical decrease in the litter layer depth was observed for both the control and 311
dredged quadrats.The particle size distribution of the topsoil on the dredged quadrats was very similar 312
to that of the controls on the same date and so were the pH values. However, the bulk density, CEC 313
and organic carbon content were slightly lower. During the dredging, a layer of 15 cm of soil was 314
excavated, which corresponded to the first horizon enriched in organic matter compared to the deeper 315
layers. Accordingly, the values of CEC and organic carbon content were similar for the dredged top soil 316
and the second horizon in 2015 (data not shown). 317
For the mowing treatment, the vegetation recolonization and growth after each maintenance 318
operation were very quick, particularly after the second operation in September due to more 319
favourable hydric conditions (Fig. S4, Fig. 6). Both of the mowing operations generated consequent 320
litter layers that were supplemented during winter by the collection of dead leaves. These mowed 321
quadrats were partly or even completely covered by more or less deep litter layers throughout the 322
year.The physicochemical properties of the topsoil of these quadrats were very similar to that of the 323
control. 324
For the burning treatment, the vegetation recolonization in the months following the two burnings 325
was very progressive, but the vegetation growth and densification were very quick (Fig. S5). For this 326
treatment, the litter layer in the quadrats was quasi-inexistent until the dead leaves collection during 327
January 2016. This litter was then rapidly eliminated in February 2016 during the second burning 328
operation. The burning residues or ashes covered the ditch surface until July and then progressively 329
dissipated until the end of August when the ash residues could no longer be observed at the ditch 330
surface. The majority of these ashes were not washed out by the big floods during August (Fig. 6) but 331
were found by visual inspection to be infiltrated and bound to soil down to 2 to 5 cm depth. The ashes 332
seem to have undergone a similar fate after the burning operations that occurred before the 333
experiments, as several soil-bound ash layers were observed at different depths in the soil profile.The 334
physicochemical properties of the topsoil of these quadrats were very similar to those of the control 335
except the pH values, which were higher. The higher pH is consistent with the alkaline properties of 336
ashes (Dollinger et al., 2016). 337
Finally, for the chemical weeding treatment, vegetation senescence was observed during the 2 months 338
following each maintenance operation, and then, the vegetation started to recolonize the ditch 339
surface. The dynamic of the vegetation recolonization was relatively rapid afterwards, but the plants 340
stayed rather short and scattered (Fig. S6). The vegetation decay after the chemical weeding generated 341
a wide but thin litter layer. For the other treatments, the litter layer increased during January on the 342
chemically weeded quadrats due to the dead leaves collected from neighbouring fields. The 343
physicochemical properties of the topsoil of these quadrats were very similar to that of the control. 344
345 346
3.2 Influence of the maintenance operations on the processes and functions sustained by ditches
3.2.1 Hydraulic capacity
348
The estimated hydraulic capacity or maximal flow rate that a ditch can carry without overflowing (Qmax)
349
varied only slightly, i.e., from 7.6 to 14 l s-1, on average, for the control quadrats (Fig. 7). Indeed, these
350
quadrats contained a dense vegetation cover from April 2015 to May 2016 (Fig. 3). The dense 351
vegetation fills the ditches and thereby limits the water volume that they can carry and induces flow 352
resistance (e.g., Crabit et al., 2011b; Jarvela, 2002). By clearing the vegetation cover, all the 353
maintenance operations rapidly improved the hydraulic capacity of the ditches (Fig. 7). However, the 354
different dynamics of the ditch recolonization by vegetation after the four maintenance strategies 355
generated diverse evolutions of the hydraulic capacity as described in Fig. 6. These contrasting changes 356
are not only due to the type of maintenance operation but also to the maintenance calendar. 357
The effect of dredging, mowing and burning on the hydraulic capacity immediately resulted in an 358
increased Qmax, i.e., by 4 times compared to the control treatment. In contrast, after the chemical
359
weeding operations, a vegetation clearing took longer than for the other maintenance operations and 360
the optimal hydraulic capacity was reached only approximately a month after each operation. The 361
hydraulic capacity dropped (Fig. 7) as the vegetation recolonized the ditches (Fig. 3). Generally, the 362
Qmax decreased to the level of the control quadrat within 1 to 3 months, depending both on the
363
maintenance operations performed and on the calendar. As an example, when the mowing was 364
performed during June, i.e., during the dry season, this operation helped maintain an optimal Qmax
365
during the following 2 months, whereas the Qmax dropped to the control treatment level within a
366
month when performed during September. 367
Dredging was performed in spring, and therefore, the hydraulic capacity of these quadrats was optimal 368
during spring and early summer. This maintenance design optimizes the ditch hydraulic capacity for 369
the storms that generate massive runoff amounts and have a high occurrence frequency during spring 370
in the study area (Fig. S1) (Levavasseur et al., 2014; Moussa et al., 2002). On the other hand, the 371
hydraulic capacity is minimal under this maintenance design during late summer and fall when the 372
highest intensity rainfall events generally occur in the study area (Fig. S1) (Moussa et al., 2002). 373
Mowing was performed in June and September, and Qmax was optimal from June to the beginning of
374
August and from September to October. The occurrence probability of high-intensity rainfall events in 375
June and July is very low. However, this maintenance design optimizes the ditch hydraulic performance 376
for the big storms that usually occur between late summer and fall. The optimal hydraulic capacity was 377
maintained longer under the chemical weeding design than under the others. However, the chemical 378
weeding was performed once a year during April, and thus the hydraulic capacity of the ditches was at 379
the level of those of the control treatment during the periods when big floods likely occur. Last, burning 380
was performed during April 2015 and then again during February 2016, which generated an optimal 381
hydraulic capacity for the floods occurring in spring but not for those in fall. 382
383 384
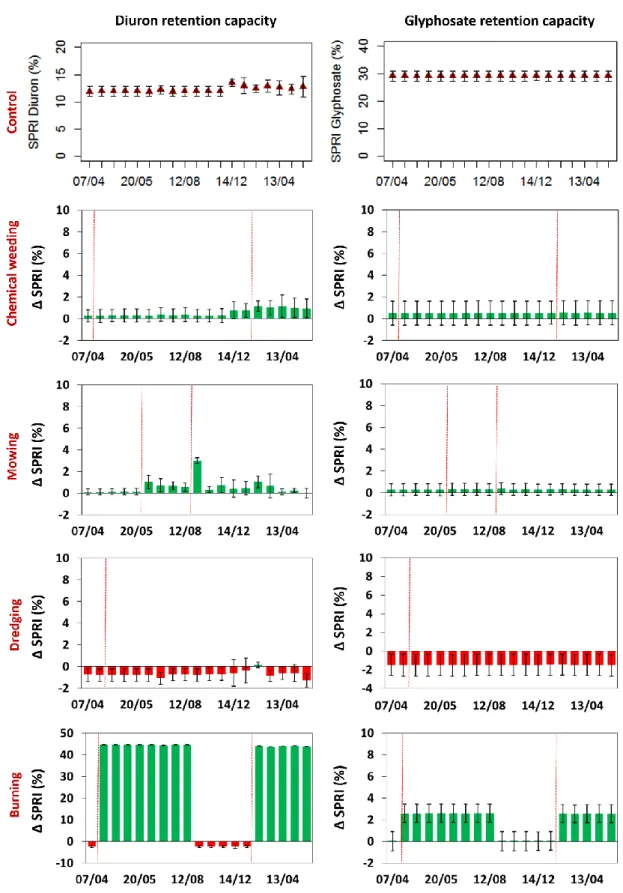
3.2.2 Herbicide retention
385
At the scale of a flood event, sorption was reported to be the primary pesticide retention mechanisms 386
in ditches (Dollinger et al., 2015; Stehle et al., 2011). The SPRI indicator provides estimations of the 387
herbicide fractions potentially retained by sorption on the ditch bottom during a flood event (Dollinger 388
et al., 2016). Figure 8 shows the evolution of the SPRI values for the 2 herbicides, diuron and 389
glyphosate, on the control quadrats and the difference, which is either positive or negative, that the 390
changes in the ditch properties due to the different maintenance strategies imply regarding herbicide 391
retention. 392
For the control quadrats, the glyphosate SPRI values did not evolve between April 2015 and May 2016. 393
This outcome is consistent with the relative affinity and masses of the different ditch materials 394
(Dollinger et al., 2016). Indeed, glyphosate has a very high sorption affinity for soils and a reduced 395
sorption affinity for litters and living vegetation. Moreover, the mass of living vegetation and litters is 396
slight compared to the mass of soil in contact with the ditch water column. The glyphosate sorption 397
capacity of ditches is thereby mostly driven by the properties of their soils. Soil properties did not 398
significantly change during the study period. The average glyphosate SPRI value for the control 399
treatments was 29%. The SPRI values of diuron for the control treatment did not evolve until January 400
2016 but then increased by approximately 3%. The sorption affinity of diuron for the different ditch-401
bed materials is different than that of glyphosate, i.e., low for living vegetation, moderate for soil, high 402
for litters and very high for ash. The soil properties did not evolve, and the litter layer was very scarce 403
until January 2016, when the ditch collected dead leaves from the surrounding vineyards, which 404
improved the diuron retention capacity. 405
Chemical weeding and mowing had no effect on the glyphosate retention capacity of the ditches 406
estimated with SPRI. On the other hand, the dredging slightly decreased the glyphosate retention 407
capacities while burning increased the retention by approximately 3% during the periods when ashes 408
are covering the ditch surface. For diuron, the impact of chemical weeding and mowing on the 409
evolution of the ditch retention capacities was also limited. The inputs of litter after chemical weeding 410
and particularly after mowing slightly increased the retention capacity of ditches. For glyphosate, 411
dredged ditches had lower diuron retention capacities than the control ditches throughout the year. 412
Burning, however, increased the diuron retention capacity of the ditches by almost 50% during the 413
period when ashes are covering the ditch surface. 414
In the study area, the herbicide spraying period stretches from April to June (Levavasseur, 2012; 415
Louchart et al., 2001) during the growth of the vines. Accordingly, the peak of herbicide concentrations 416
in runoff water is monitored in April/May, whereas from August to March, the concentrations are 417
relatively low (Louchart et al., 2001). Optimizing the herbicide retention capacity of ditches is therefore 418
particularly important during the growth season, particularly if over the same period there is a high 419
risk of storm events as in the study area. In this respect, the burning practices are welcome since, when 420
ditches are burned in winter, the ashes are covering the ditch surface during spring and summer, which 421
slightly increases the retention of glyphosate and substantially increases that of diuron during that 422 crucial period. 423 424 3.2.3 Biodiversity conservation 425
Figures 9 represents the evolution of the ecological indicators or, more precisely, of the ditch 426
conditions that influence the detritivore and auxiliary insects and macrofauna populations. Due to the 427
non-additivity of the three ecological indicators, we present their evolution separately. The duration 428
of the study was divided into three periods to facilitate the description of the indicator evolutions. The 429
period from March to May is a crucial period for animal and insect biodiversity, as it corresponds to 430
the breeding season of most species in the study area. This duration includes the beginning of the first 431
and the third periods. 432
In the control treatment, the vegetation was dense in late summer and fall, and blooming flowers were 433
abundant in the ditch until December 2015 and again from March 2016, but the litter layer was rather 434
scattered throughout the year. In accordance, the indicator scores were high for the canopy and 435
vegetation layer during spring to fall but were low for the litter layer. This treatment thus most likely 436
generates conditions that favour the development and the survival of pollinators and small animals 437
(e.g., Herzon and Helenius, 2008; Meier et al., 2005; Murphy et al., 2012). However, this treatment 438
does not provide ideal conditions for detritivore insects populations (Dangles et al., 2004; Johnson et 439
al., 2003;Murphy et al., 2012) 440
For the dredging treatments, the vegetation remained scattered throughout the year, and the litter 441
layer and blooming flower were only abundant at the beginning of the second period. Accordingly, the 442
indicator scores for all layers were low and only reached the same values as the control during the last 443
period. Thus, as could be expected, this treatment is unlikely to efficiently sustain the biodiversity in 444
ditches and can even reduce this factor (e.g., Herzon and Helenius, 2008). 445
For the mowing treatment, the ecological indicators were highest in the canopy and vegetation layer 446
from April to June, which covers the breeding season. The mowing operations in June and September 447
drastically decreased these scores but increased those of the litter layer. Overall, this treatment most 448
likely generates conditions that favour the development and the survival of auxiliary and detritivore 449
insects (Dangles et al., 2004; Johnson et al., 2003;Murphy et al., 2012) and small animals (e.g., Herzon 450
and Helenius, 2008; Meier et al., 2005; Murphy et al., 2012). 451
The burning treatment exhibited the same behaviour as the control for the two first periods due to the 452
quick recolonization of the vegetation after the maintenance operation. However, the second burning 453
operation in February 2016 led to very low indicator scores during the third period. Due to the timing 454
of the burning, it can be concluded that this operation, when performed in late winter or spring, can 455
reduce the biodiversity. 456
The chemical weeding treatment generated low ecological indicator scores during the breeding season 457
and overall improved scores in summer. This treatment is, along with dredging, the least able to sustain 458
a rich biodiversity and can even be detrimental. 459
In summary, we can rank the management operations in increasing order on biodiversity conservation: 460
dredging, chemical weeding, burning and finally mowing. The differences observed among the 461
different strategies could be related to the maintenance calendar constraints and the plant 462
recolonization dynamics after each treatment. 463 464 465 4. Discussion 466 467
4.1 Representativeness and accuracy of the empirical and indicator data
468
To our knowledge, the yearly evolution of ditch properties after the common maintenance operations 469
has not yet been described in the literature. However, the literature contains few studies where ditch 470
maintenance strategies and properties were punctually surveyed. In accordance with the literature, 471
our results show that all of the maintenance operations have a direct effect on the removal of the 472
living vegetation (Dollinger et al., 2015). As in our study, the surveys performed by Levavasseur et al. 473
(2014) in the same region also highlighted that the chemically weeded and mowed ditches had higher 474
litter layers than the other types and that all the ditches, regardless of their maintenance design, 475
tended to collect dead leaves during winter. The decrease in the organic carbon content of the ditch 476
soil after dredging was similarly reported by several studies across the world (e.g., Smithand Pappas, 477
2007; Vaughan et al., 2008). 478
479
The estimated values of the hydraulic capacity (Qmax) can be associated with the high uncertainties that
480
stem from both the estimation of vegetation cover (Levavasseur et al., 2014) and the derivation of the 481
Strickler coefficients from the vegetation cover data (Bailly et al., 2015b). However, it must be 482
underlined that the Strickler coefficients over the range of vegetation densities were similar to those 483
measured by Crabit et al. (2011) in similarly vegetated ditches or presented in the Chow tables for 484
small channels (Arcement and Schneider, 1989; Lagacherie et al., 2006).This estimation yields the 485
confidences in the hydraulic capacity trends obtained with this semi-quantitative approach. 486
The estimation of glyphosate and diuron retention in ditches might also be associated with some 487
uncertainties due, in the one hand, to precision of the ditch properties data and, on the other hand, to 488
the hypotheses underlying the calculation of the SPRI indicator (Dollinger et al., 2016). We found no 489
studies reporting measurement of glyphosate retention rates in ditches that would allow assessing the 490
accuracy of the indicator. However, the average diuron SPRI value for the control treatments was 12%, 491
which is in the range of the diuron retention measured in vegetated ditches with variable litter layers 492
by Margoum et al. (2003). Therefore, the estimation yields the confidences in the herbicide retention 493
capacity trends obtained with this semi-quantitative approach. 494
The indicators developed to compare the evolution of the biodiversity conservation function in ditches 495
among treatments are entirely qualitative. These indicators allow the discrimination of properties that 496
would either favour or reduce the biodiversity function. However, these indicators do not allow the 497
estimation of the presence or absence of certain categories of insects or animals. Moreover, the 498
thresholds were set based on expert estimations and should be confirmed by additional empirical 499
work. 500
501
4.2 Designing maintenance strategies for sustaining multiple functions
502
In the study area, the hydraulic capacity of the ditches needs to be optimal during spring, late summer 503
and fall when high-intensity storms have a high probability of occurrence (Levavasseur et al., 2014; 504
Moussaet al., 2002). Second, the herbicide retention capacity of the ditches needs to be optimal during 505
the growth period and particularly during spring when herbicides are sprayed, which results in high 506
concentrations in the runoff water (Levavasseur, 2012; Louchart et al., 2001). Last, biodiversity must 507
be especially sustained in spring and early summer during the breeding season (Herzon and Helenius, 508
2008). 509
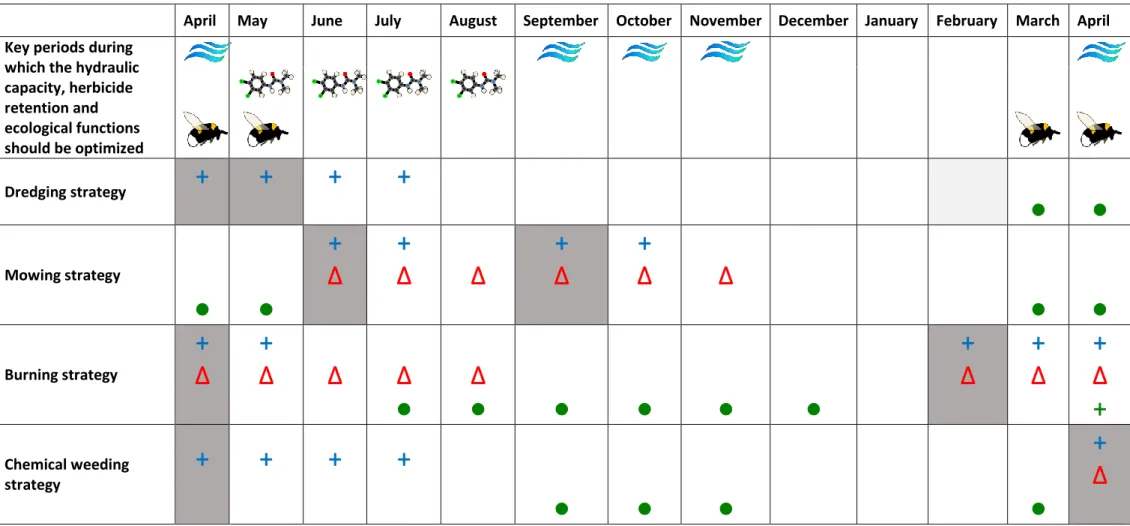
In this area, dredging and chemical weeding performed once a year in the early spring do not allow the 510
simultaneous optimization of the water conveyance capacity, herbicide retention and biodiversity 511
conservation of the ditches (Table 1). These maintenance designs only allow for the optimization of 512
the hydraulic capacity of the ditches for the spring storms. However, the designs have a null or negative 513
impacts on the other functions during the critical periods when they should be optimal, which includes 514
the hydraulic performance during the late summer and fall storms. However, mowing performed in 515
June and September and burning performed in the winter allows for the optimization of the three 516
investigated functions at least for some of the critical periods (Table 1). Indeed, if mowing is performed 517
too late for the optimization of the hydraulic performance of ditches during the spring floods, the 518
hydraulic performance is still optimized for the late summer and fall floods. Moreover, the dense litter 519
layer produced during the mowing operations increase the retention of hydrophobic herbicides such 520
as diuron. The rapid recolonization by the vegetation after mowing along with the dense litter layer 521
and late flowering sustain biodiversity in ditches from fall until the end of spring. Conversely, burning 522
optimizes the hydraulic capacity for the spring floods but not for the late summer and fall floods. 523
Burning is the maintenance operation that has the greatest impact on herbicides retention and 524
biodiversity during the spring and summer. 525
For this study, only the succession of single maintenance operations (as opposed to a combination of 526
operations) was investigated on a given ditch. Successions in a period of the two different operations 527
are relatively frequent in the study area (Levavasseur et al., 2014). Successions of burning plus mowing 528
during the year in the same ditch has a probability of occurrence even greater than each operation 529
alone in the study area. The impact of this succession on the multiple functions supported by ditches 530
can be extrapolated from the ditch properties evolution data. Burning performed in February would 531
cover the ditch with ashes during spring and early summer, which optimizes the herbicides retention 532
and limits the vegetation coverage in early spring, which optimizes the hydraulic capacity. The 533
subsequently rapid vegetation recolonization and flowering in spring would help sustain biodiversity. 534
Then, in the late summer when the ditch properties are equivalent to those of an unmanaged ditch, 535
mowing would clear the vegetation. This operation would thereby optimize the hydraulic performance 536
for the late summer and fall floods and generate a dense litter layer that would improve the retention 537
of hydrophobic pesticides. This common succession thereby appears to optimize all the considered 538
functions during all important periods. 539
The 4 maintenance operations have similar short-term impacts on ditch vegetation but contrasting 540
impacts on the mid-term evolution of the ditch properties (Fig. 3 to 5). The different biochemical 541
processes involved in the multiple functions supported by ditches are modulated by the ditch 542
properties and thereby by the maintenance operations (Dollinger et al., 2015). These modulations of 543
the water conveyance capacity, herbicide sorption and biodiversity conservation of ditches related to 544
the evolution of ditch properties assessed with the semi-quantitative indicators may be associated 545
with significant uncertainty related both to the precision of the ditch properties data and to the 546
simplification hypothesis inherent to the calculation of the various indicators. However, the range of 547
Strickler coefficients or diuron retention was where the estimated values correspond well to those 548
measured in similar ditches or channels (Crabit et al., 2011b; Margoum et al., 2003), which yields 549
confidence in the trends derived from these indicators. 550 551 552 5. Conclusion 553 554
This study aimed at characterizing the influence of maintenance on the yearly dynamics of ditch 555
properties in order to identify strategies that would allow simultaneous optimization of a panel of 556
agricultural and ecological functions. The primary maintenance operations of i.e., dredging, chemical 557
weeding, mowing and burning, were shown in this work to lead to significant changes the ditch 558
properties. They all induce vegetation clearance that increases the hydraulic capacity of ditches but 559
decreases their biodiversity support. Moreover, the chemical weeding, and even more mowing 560
generate dense litter layers that improve the retention of hydrophobic herbicides such as diuron and 561
sustain detritivore insects. Furthermore, burning covers the ditch bottom with ashes that greatly 562
increase their herbicide retention capacity. The hydraulic capacity of ditches has to be optimal during 563
the periods when big floods are likely to occur in a given area, while their herbicides retention 564
capacities should be increased during the herbicide-spraying season when concentrations in runoff are 565
likely to be high. Biodiversity should be preferentially sustained during the breeding season. The 566
periods of the year over which these respective ditch functions should be optimal may not overlap. As 567
such, not only the type of maintenance operation but also the calendar of maintenance, by modifying 568
ditch properties at given periods during a year, can help optimizing the multiple ditch functions. The 569
combination of different operations at critical periods of the year allows for the optimization of 570
successively most of the functions that ditches can support. In the Mediterranean context, for 571
example, burning in winter and mowing in late summer is the combination of operation and timing 572
that appears to improve the best of the functions during the crucial periods. 573
The evolution of ditch properties after the 4 primary maintenance operations may differ under various 574
pedoclimatic contexts, particularly because the maintenance calendar and operation type chosen are 575
likely to be constrained by the climate. The period over which the different functions of the ditch 576
should be optimized may vary as well. This study, performed in the specific Mediterranean context, 577
provides trends of ditch properties evolutions and of their impact on the ditch hydraulic performance, 578
herbicide retention and biodiversity conservation that may help design maintenance strategies. 579
However, maintenance design should be site-specific and should consider the local problematics of 580
agricultural water management, the environmental problematics and the pedoclimatic context. 581
582
Acknowledgments
583
We would like to cheerfully thank Mr. Cros and Mr. Boulade for kindly letting us perform the 584
experiments on their ditch. This work was performed in the framework of a research and development 585
project co-funded by the French Office for Water and Aquatic Bodies (ONEMA) and INRA. 586
587
References
588
Andreassen, H.P., Ims, R.A., Steinset, O.K., 1996. Discontinuous Habitat Corridors: Effects on Male 589
Root Vole Movements. J. Appl. Ecol. 33, 555–560. doi:10.2307/2404984 590
Arcement, G.J., Schneider, V.R., 1989. Guide for selecting Manning’s roughness coefficients for 591
natural channels and flood plains, United State Geological Survey. ed, Water-Supply. Denver, 592
USA. 593
Bailly, J.S., Dages, C., Dollinger, J., Lagacherie, P., Voltz, M., 2015a. Protocole de spatialisation et 594
d’évolution d’états de surface de fossés (No. 3). INRA. 595
Bailly, J.S., Vinatier, F., Belaud, G., Combemale, D., 2015b. Vegetation patch effects on flow resistance 596
at channel scale, in: E-Proceedings of the 36th IAHR World Congress. IAHR, The Hague, 597
Netherlands, pp. 1–5. 598
Boutron, O., Margoum, C., Chovelon, J.-M., Guillemain, C., Gouy, V., 2011. Effect of the submergence, 599
the bed form geometry, and the speed of the surface water flow on the mitigation of 600
pesticides in agricultural ditches. Water Resour. Res. 47, n/a–n/a. 601
doi:10.1029/2011WR010378 602
Chester, E.T., Robson, B.J., 2011. Drought refuges, spatial scale and recolonisation by invertebrates in 603
non-perennial streams. Freshw. Biol. 56, 2094–2104. doi:10.1111/j.1365-2427.2011.02644.x 604
Crabit, A., Colin, F., Bailly, J., Ayroles, H., Garnier, F., 2011. Soft Water Level Sensors for 605
Characterizing the Hydrological Behaviour of Agricultural Catchments. Sensors 11, 4656– 606
4673. doi:10.3390/s110504656 607
Crabit, Colin, F., Moussa, R., 2011. A soft hydrological monitoring approach for comparing runoff on a 608
network of small poorly gauged catchments. Hydrol. Process. 25, 2785–2800. 609
Dages, C., Samouëlian, A., Negro, S., Storck, V., Huttel, O., Voltz, M., 2015. Seepage patterns of 610
Diuron in a ditch bed during a sequence of flood events. Sci. Total Environ. 537, 120–128. 611
doi:10.1016/j.scitotenv.2015.07.130 612
Dangles, O., Gessner, M.O., Guerold, F., Chauvet, E., 2004. Impacts of stream acidification on litter 613
breakdown: implications for assessing ecosystem functioning. J. Appl. Ecol. 41, 365–378. 614
Dollinger, J., Dagès, C., Bailly, J.-S., Lagacherie, P., Voltz, M., 2015. Managing ditches for 615
agroecological engineering of landscape. A review. Agron. Sustain. Dev. 35, 999–1020. 616
doi:10.1007/s13593-015-0301-6 617
Dollinger, J., Dagès, C., Negro, S., Bailly, J.-S., Voltz, M., 2016. Variability of glyphosate and diuron 618
sorption capacities of ditch beds determined using new indicator-based methods. Sci. Total 619
Environ. 573, 716–726. doi:10.1016/j.scitotenv.2016.08.168 620
Herzon, I., Helenius, J., 2008. Agricultural drainage ditches, their biological importance and 621
functioning. Biol. Conserv. 141, 1171–1183. doi:10.1016/j.biocon.2008.03.005 622
Jarvela, J., 2002. Flow resistance of flexible and stiff vegetation: a flume study with natural plants. J. 623
Hydrol. 269, 44–54. doi:http://dx.doi.org/10.1016/S0022-1694(02)00193-2 624
Johnson, B.R., Cross, W.F., Wallace, J.B., 2003. Long-term resource limitation reduces insect 625
detritivore growth in a headwater stream. J. North Am. Benthol. Soc. 22, 565–574. 626
doi:10.2307/1468353 627
Lagacherie, P., Diot, O., Domange, N., Gouy, V., Floure, C., Kao, C., Moussa, R., Robbez-Masson, J.M., 628
Szleper, V., 2006. An indicator approach for describing the spatial variability of artificial 629
stream networks with regard to herbicide pollution in cultivated watersheds. Ecol. Indic. 6, 630
265–279. doi:10.1016/j.ecolind.2005.02.003 631
Lecce, S.A., Pease, P.P., Gares, P.A., Wang, J., 2006. Seasonal controls on sediment delivery in a small 632
coastal plain watershed, North Carolina, USA. Geomorphology 73, 246–260. 633
doi:10.1016/j.geomorph.2005.05.017 634
Levavasseur, F., 2012. Structure du paysage et fonctionnement hydrologique : application aux 635
réseaux de fossés en zone viticole méditerranéenne. Montpellier SupAgro, Montpellier, 636
France. 637
Levavasseur, F., Bailly, J.S., Lagacherie, P., 2016. Are ditch networks optimised for mitigating rill 638
erosion in cultivated Mediterranean landscapes? A numerical experiment. Land Use Policy 639
50, 441–448. doi:10.1016/j.landusepol.2015.08.033 640
Levavasseur, F., Bailly, J.S., Lagacherie, P., Colin, F., Rabotin, M., 2012. Simulating the effects of 641
spatial configurations of agricultural ditch drainage networks on surface runoff from 642
agricultural catchments. Hydrol. Process. doi:10.1002/hyp.8422 643
Levavasseur, F., Biarnès, A., Bailly, J.S., Lagacherie, P., 2014. Time-varying impacts of different 644
management regimes on vegetation cover in agricultural ditches. Agric. Water Manag. 140, 645
14–19. doi:10.1016/j.agwat.2014.03.012 646
Louchart, X., Voltz, M., Andrieux, P., Moussa, R., 2001. Herbicide Transport to Surface Waters at Field 647
and Watershed Scales in a Mediterranean Vineyard Area. J. Environ. Qual. 30, 982–991. 648
Margoum, C., Gouy, V., Laillet, B., Dramais, G., 2003. Rétention des produits phytosanitaires dans les 649
fossés de connexion parcelle-cours d`eau. J. Water Sci. 16, 389–405. 650
Marja, R., Herzon, I., 2012. The importance of drainage ditches for farmland birds in agricultural 651
landscapes in the Baltic countries: does field type matter? Ornis Fenn. 89, 170–181. 652
Meier, K., Kuusemets, V., Luig, J., Mander, Ü., 2005. Riparian buffer zones as elements of ecological 653
networks: Case study on Parnassius mnemosyne distribution in Estonia. Ecol. Eng. 24, 531– 654
537. doi:10.1016/j.ecoleng.2005.01.017 655
Moussa, R., Voltz, M., Andrieux, P., 2002. Effects of the spatial organization of agricultural 656
management on the hydrological behaviour of a farmed catchment during flood events. 657
Hydrol. Process. 16, 393–412. doi:10.1002/hyp.333 658
Murphy, S.M., Wimp, G.M., Lewis, D., Denno, R.F., 2012. Nutrient Presses and Pulses Differentially 659
Impact Plants, Herbivores, Detritivores and Their Natural Enemies. PLoS ONE 7, e43929. 660
doi:10.1371/journal.pone.0043929 661
Needelman, Kleinman, P.J.A., Strock, J.S., Allen, A.L., 2007. Improved management of agricultural 662
drainage ditches for water quality protection: An overview. J. Soil Water Conserv. 62, 171– 663
178. 664
Nicholls, C.I., Parrella, M., Altieri, M.A., 2001. The effects of a vegetational corridor on the abundance 665
and dispersal of insect biodiversity within a northern California organic vineyard. Landsc. 666
Ecol. 16, 133–146. 667
Reichenberger, S., Bach, M., Skitschak, A., Frede, H.-G., 2007. Mitigation strategies to reduce 668
pesticide inputs into ground- and surface water and their effectiveness; A review. Sci. Total 669
Environ. 384, 1–35. doi:10.1016/j.scitotenv.2007.04.046 670
Sarthou, J.P., Ouin, A., Arrignon, F., Barreau, G., Bouyjou, B., 2005. Landscape parameters explain the 671
distribution and abundance of Episyrphus balteatus (Diptera: Syrphidae). Eur. J. Entomol. 672
102, 539–545. 673
Schultz, R.C., Collettil, J.P., Isenhart, T.M., Simpkins, W.W., Mize, C.W., Thompson, M.L., 1995. Design 674
and placement of a multi-species riparian buffer strip system. Agrofor. Syst. 29, 201–226. 675
doi:10.1007/BF00704869 676
Smith, D.R., Pappas, E.A., 2007. Effect of Ditch Dredging on the Fate of Nutrients in Deep Drainage 677
Ditches of the Midwestern United States. J. Soil Water Conserv. 62, 252–261. 678
Stehle, S., Elsaesser, D., Gregoire, C., Imfeld, G., Niehaus, E., Passeport, E., Payraudeau, S., Schäfer, 679
R.B., Tournebize, J., Schulz, R., 2011. Pesticide risk mitigation by vegetated treatment 680
systems: a meta-analysis. J. Environ. Qual. 40, 1068–1080. doi:10.2134/jeq2010.0510 681
Stella, J.C., Rodríguez-González, P.M., Dufour, S., Bendix, J., 2013. Riparian vegetation research in 682
Mediterranean-climate regions: common patterns, ecological processes, and considerations 683
for management. Hydrobiologia 719, 291–315. doi:10.1007/s10750-012-1304-9 684
Steward, A.L., von Schiller, D., Tockner, K., Marshall, J.C., Bunn, S.E., 2012. When the river runs dry: 685
human and ecological values of dry riverbeds. Front. Ecol. Environ. 10, 202–209. 686
doi:10.1890/110136 687
Strickler, A., 1923. Contributions to the question of a velocity formula and roughness data for 688
streams, channels and closed pipelines. 689
Tang, X., Zhu, B., Katou, H., 2012. A review of rapid transport of pesticides from sloping farmland to 690
surface waters: Processes and mitigation strategies. J. Environ. Sci. 24, 351–361. 691
doi:10.1016/S1001-0742(11)60753-5 692
Vaughan, R.E., Needelman, B.A., Kleinman, P.J.A., Rabenhorst, M.C., 2008. Morphology and 693
Characterization of Ditch Soils at an Atlantic Coastal Plain Farm. Soil Sci. Soc. Am. J. 72, 660. 694
doi:10.2136/sssaj2006.0102 695
Vinatier, F., Bailly, J.-S., Belaud, G., In Press. From3D grassy vegetation point cloud to hydraulic 696
resistance grassy vegetation point cloud to hydraulic resistance: Application to close-range 697
estimation of Manning coefficients for intermittent open channels. Ecohydrology. 698
doi:10.1002/eco.1885 699
Ward, S.A., 1992. Environmental Uncertainty and Polyphagy in Herbivorous Insects. Oikos 63, 506– 700
512. doi:10.2307/3544978 701
Wishart, M.J., 2000. The terrestrial invertebrate fauna of a temporary stream in southern Africa. Afr. 702
Zool. 35, 193–200. doi:10.1080/15627020.2000.11657090 703
Wu, F.C., Hsieh Wen, S., Chou, Y.-J., 1999. Variation of roughness coefficients for unsubmerged and 704
submerged vegetation. J. Hydraul. Eng. 125, 934–942. 705 706 707 708 709 710 711
712 713 714 715
716
Fig. 1: Experimental design. For each pattern, the quadrats C, D, M, B, CW were respectively
717
unmanaged (control), dredged, mowed, burned and chemically weeded with frequencies and timing
718
that apply to farmers in the study area. Each pattern is 30 m long, quadrats are 4 m long each and
719
are separated by 2 m long buffer sections.
720 721 722
723
Fig. 2: Ditch maintenance. A: burning; B: mowing; C: chemical weeding and D: dredging. During the
724
burning operation the fire was contained in the 4 m long sections by suffocating the flames with
725
broom branches. Mowing was done manually using a strimmer. Chemical weeding was performed by
726
applying glyphosate with a manual sprayer. Dredging consisted in excavating a 15 to 20 cm soil layer
727
from the ditch bottom and walls.
729
Fig. 3: Yearly evolution of vegetation in the ditches. From top to bottom, the graphs picture the
730
evolution of the vegetation cover in the unmanaged, chemically weeded, mowed, dredged and
731
burned ditches. The graphs in the left column represent the evolution of the ditch bottom surface area
732
covered by vegetation and the graphs on the right the vegetation height. The red dashed lines
733
represent the calendar of the maintenance operations. The green dots represent the mean value
734
among the 4 replicates of each treatment and the vertical bars represent the standard deviations.
736
Fig. 4: Yearly evolution of litter in ditches. From top to bottom, the graphs picture the evolution of
737
the vegetation cover in the unmanaged, chemically weeded, mowed, dredged and burned ditches.
738
The graphs in the left column represent the evolution of the ditch bottom surface area covered by
739
litter, and the graphs on the right represent the litter height. The red dashed lines represent the
740
calendar of the maintenance operations. The brown dots represent the mean value among the 4
741
replicates of each treatment and the vertical bars represent the standard deviations.
743
Fig. 5: Ditch top soil physicochemical properties. A: clay content (%), B: silt content (%), C: sand
744
content (%); D: cation exchange capacity (cmol kg-1), E: organic carbon content (%), F: pH, G: density
745
(g cm-3). For each soil property, the distribution of the values are given from the left to the right for
746
the control quadrats in 2015 (2015), the control quadrats in 2016 (C), the dredged quadrats in 2016
747
(D), the mowed quadrats in 2016 (M), the burned quadrat in 2016 (B) and the chemically weeded
748
quadrats in 2016 (CW).
749 750