HAL Id: hal-02621504
https://hal.inrae.fr/hal-02621504
Submitted on 26 May 2020
HAL is a multi-disciplinary open access
archive for the deposit and dissemination of
sci-entific research documents, whether they are
pub-lished or not. The documents may come from
teaching and research institutions in France or
abroad, or from public or private research centers.
L’archive ouverte pluridisciplinaire HAL, est
destinée au dépôt et à la diffusion de documents
scientifiques de niveau recherche, publiés ou non,
émanant des établissements d’enseignement et de
recherche français ou étrangers, des laboratoires
publics ou privés.
Distributed under a Creative Commons Attribution| 4.0 International License
Artificial barriers prevent genetic recovery of small
isolated populations of a low-mobility freshwater fish
R. A. Coleman, B. Gauffre, Alexandra Pavlova, L. B. Beheregaray, J. Kearns,
J. Lyon, M. Sasaki, Raphaël Leblois, C. Sgro, Paul Sunnucks
To cite this version:
R. A. Coleman, B. Gauffre, Alexandra Pavlova, L. B. Beheregaray, J. Kearns, et al.. Artificial barriers
prevent genetic recovery of small isolated populations of a low-mobility freshwater fish. Heredity,
Nature Publishing Group, 2018, 120 (6), pp.515-532. �10.1038/s41437-017-0008-3�. �hal-02621504�
https://doi.org/10.1038/s41437-017-0008-3 ARTICLE
Arti
ficial barriers prevent genetic recovery of small isolated
populations of a low-mobility freshwater
fish
R.A. Coleman1●B. Gauffre2,3,4 ●A. Pavlova 2●L.B. Beheregaray5●J. Kearns6●J. Lyon6●M. Sasaki5●R. Leblois7,8●
C. Sgro2●P. Sunnucks 2
Received: 27 July 2017 / Revised: 5 September 2017 / Accepted: 8 September 2017 / Published online: 12 January 2018 © The Author(s) 2018. This article is published with open access
Abstract
Habitat loss and fragmentation often result in small, isolated populations vulnerable to environmental disturbance and loss of genetic diversity. Low genetic diversity can increase extinction risk of small populations by elevating inbreeding and inbreeding depression, and reducing adaptive potential. Due to their linear nature and extensive use by humans, freshwater ecosystems are especially vulnerable to habitat loss and fragmentation. Although the effects of fragmentation on genetic structure have been extensively studied in migratoryfishes, they are less understood in low-mobility species. We estimated impacts of instream barriers on genetic structure and diversity of the low-mobility river blackfish (Gadopsis marmoratus) withinfive streams separated by weirs or dams constructed 45–120 years ago. We found evidence of small-scale (<13 km) genetic structure within reaches unimpeded by barriers, as expected for afish with low mobility. Genetic diversity was lower above barriers in small streams only, regardless of barrier age. In particular, one isolated population showed evidence of a recent bottleneck and inbreeding. Differentiation above and below the barrier (FST= 0.13) was greatest in this stream, but in
other streams did not differ from background levels. Spatially explicit simulations suggest that short-term barrier effects would not be detected with our data set unless effective population sizes were very small (<100). Our study highlights that, in structured populations, the ability to detect short-term genetic effects from barriers is reduced and requires more genetic markers compared to panmictic populations. We also demonstrate the importance of accounting for natural population genetic structure in fragmentation studies.
Introduction
Widespread loss of habitat and associated fragmentation of wildlife populations is a major threat to global biodiversity (Sala et al.,2000; Foley et al., 2005; Fischer and Linden-mayer,2007). Fragmentation often results in small, isolated
populations that are more vulnerable to stochastic events. For example, fluctuations in climate such as drought, nat-ural catastrophes such as wildfires and demographic varia-tion such as annual breeding success. As a consequence small, isolated populations are vulnerable to loss of genetic diversity through genetic drift (Fischer and Lindenmayer,
2007). Loss of genetic diversity contributes to increased extinction risk for small populations, because it reduces the potential of populations to adapt to future environmental changes such as disease, pollutants, and climate change, and * R. A. Coleman
rhys.coleman@melbournewater.com.au
1 Applied Research, Melbourne Water Corporation, Docklands, VIC
3008, Australia
2 School of Biological Sciences, Monash University, Clayton, VIC
3800, Australia
3 Centre d’Etudes Biologiques de Chizé, UMR 7372, CNRS and
Université de La Rochelle, F-79360 Beauvoir sur Niort, France
4 INRA, USC 1339 CEBC, F-79360 Villiers en Bois, France
5 Molecular Ecology Lab, Flinders University, Adelaide, SA 5001,
Australia
6 Arthur Rylah Institute for Environmental Research, Department of
Environment, Land, Water and Planning, Heidelberg, VIC 3084, Australia
7 CBGP, INRA, CIRAD, IRD, Montpellier SupAgro, University of
Montpellier, Montpellier, France
8 Institut de Biologie Computationnelle, University of Montpellier,
Montpelier, France Electronic supplementary materialThe online version of this article
(https://doi.org/10.1038/s41437-017-0008-3) contains supplementary material, which is available to authorized users.
123456789
can result in loss offitness through inbreeding and fixation of deleterious alleles (Frankham,2005; Willi et al.,2006). Loss of genetic diversity in small, isolated populations has been observed across a broad range of taxonomic groups including mammals, birds, reptiles, andfishes (Frankham,
1996; Taylor et al., 2003; Whiteley et al., 2013; Rivera-Ortíz et al.,2014). Where population isolation and loss of genetic diversity through drift threatens the viability of small populations, the managed movement of individuals into these populations from a suitable source population (assisted geneflow) can rapidly increase genetic diversity and improve populationfitness (Frankham,2015; Whiteley et al.,2015). Thus, assessing levels of genetic diversity and the strength of genetic drift after population isolation can assist in developing effective conservation strategies.
Freshwater ecosystems are especially vulnerable to habitat loss and fragmentation, given the linear nature of rivers and streams and the need for many aquatic organisms to undertake longitudinal (upstream and downstream) and lateral (notably onto adjacentfloodplains during high flows) movements as a part of their life history. Along with other threats, such as overexploitation, water pollution, flow modification, and invasion by exotic species, these aspects of freshwater ecosystems have contributed to a pro-portionally higher number of threatened freshwater species per area compared to terrestrial and marine ecosystems (Dudgeon et al.,2006; Strayer and Dudgeon, 2010). Arti-ficial barriers to the movement of freshwater organisms include dams, pipes, culverts, weirs, levees, altered flow regimes, and aquatic pollution, with many freshwater sys-tems affected worldwide (Jackson et al., 2001; Nilsson et al.,2005). Here we use the term “barrier” to mean any restriction to the movement of individuals and their genes. The negative impacts of barriers on fish distribution and abundance have been well documented, and with>60% of the world’s 227 largest rivers classified as highly frag-mented, barriers are recognised as a major threat to fresh-waterfishes (Lucas et al.,2001; Reid et al., 2013; Hansen et al.,2014). In some cases, fragmentation due to dams has led to extirpation of populations, while in others it has exerted negative genetic effects by restricting geneflow and causing population declines (Angermeier, 1995; Faulks et al.,2011; Hansen et al.,2014).
To understand the threats associated with barriers to freshwaterfish communities and find appropriate manage-ment solutions, it is important to evaluate the genetic consequences of barriers for species with a range of mobility. While several studies have assessed the impact of natural or artificial barriers on genetic structure and diver-sity of freshwater fish species that have the potential to move substantial distances throughout their life, especially salmonid species (for example, Morita and Yamamoto,
2002; Costello et al., 2003; Taylor et al., 2003; Wofford
et al., 2005; Beneteau et al., 2009; Whiteley et al.,2013; Gouskov et al., 2016), studies of non-salmonid and low-mobility species are comparatively rare in the fragmentation literature (Dehais et al., 2010; Roberts et al., 2013; Lean et al., 2017). Assessing the impact of recent barriers on genetic structure is challenging for species with low mobility: when mating occurs preferentially within areas that are small relative to the global population range, genetic differentiation can increase across the landscape with distance (isolation-by-distance (IBD), Wright, 1943). In such structured populations, the rate of loss of genetic variability globally is reduced compared to a panmictic population of the same size (Leblois et al.,2006), and so it takes more generations for the genetic signature of a barrier effect to develop (Landguth et al., 2010). To avoid erro-neously attributing pre-existing genetic structure to barrier effects, background levels of spatial genetic structure must be considered.
In this study, we focus on the impacts of artificial barriers on the genetic structure and diversity of a non-migratory freshwater fish species, the southern river blackfish, Gadopsis marmoratus. As well as having low mobility, this highly territorial species has low fecundity, making its small populations highly vulnerable to environmental stochasti-city (Jackson et al.1996; Huey et al.,2017). Over much of its range, the distribution of G. marmoratus is contracting and population sizes are declining (Morris et al., 2001; Lintermans,2007; Hammer et al.,2009; Huey et al.,2017; Unmack et al., 2017). Recent genetic studies of G. mar-moratus across the Murray-Darling Basin (Lean et al.,
2017) and in northern south-eastern Australia (Huey et al.,
2017) showed low local genetic diversity, suggestive of limited capacity of small populations to adapt to future environmental changes. In addition, strong genetic structure was found at both large and small spatial scales, suggestive of low gene flow across sites and strong effects of genetic drift. While no IBD was detected in both studies, it was suggested that patterns of IBD could be detected over the spatial scale of a stream or catchment unimpeded by bar-riers. It remains unclear whether the observed genetic structure in G. marmoratus is a natural outcome of low dispersal or a result of the combined effect of low dispersal and habitat fragmentation. Here we test for an effect of artificial barriers on genetic structure in G. marmoratus in south-eastern Australia at a small spatial scale (from 1.5 to 15 km within individual streams) after accounting for nat-ural genetic structure. The upper Yarra River system near Melbourne, Victoria, Australia presents an excellent opportunity to design an assessment of the impacts of bar-riers of known age on the genetic structure of a low-mobility freshwaterfish. In response to Melbourne’s human population growth, a network of stream flow diversion weirs of known age has progressively increased in extent in
the upper Yarra River system, with staged installation of water supply weirs and dams since 1893.
We aimed to test the hypothesis that isolation of a low-mobility freshwater fish by artificial barriers increases genetic drift upstream, resulting in (1) stronger differentia-tion between populadifferentia-tions above and below barriers than would be expected under natural processes, and (2) reduced genetic diversity and inbreeding within populations above barriers compared to populations below barriers. More specifically, we predicted that loss of genetic diversity in populations above each barrier and genetic differentiation across the barrier would depend on (1) the age of the barrier, (2) the size of the above-barrier population (based on catchment area) and (3) the disturbance history (for exam-ple, wildfire and severe drought) that could lead to bottle-necks compounding genetic drift due to fragmentation. To achieve our aims, we analysed microsatellite DNA marker data for populations above and below water supply barriers infive streams, where barrier ages were 45–120 years old (~9–24 G. marmoratus generations) and catchment sizes were 14–337 km2. To assess our ability to distinguish bar-rier effects from background genetic structure, we first estimated the background levels of differentiation across sample sites within connected parts of the catchment. We then simulated the effects of genetic drift on genetic diversity and differentiation (FST) across a barrier for
dif-ferent densities of populations with background genetic structure similar to those estimated in our observed data set. We also used simulations to investigate whether barrier effects on genetic differentiation were masked by uni-directional downstream gene flow (Dehais et al., 2010; Roberts et al.,2013).
Materials and methods
Study area
The Yarra River catchment, Victoria, Australia, covers a total area of over 4000 km2, with our study area comprising two distinct sub-catchments: the Watts River sub-catchment (including Donnellys Creek) and the upper Yarra River sub-catchment (including Armstrong and McMahons creeks) (Fig. 1). Land use in the Watts River sub-catchment is 81.0% forested, 15.1% rural and 3.9 % urban, and in the upper Yarra River sub-catchment is 99.3% forested and 0.7% rural. There are also two distinct stream types: rivers with large catchments and reservoirs (upper Yarra River 337 km2, Upper Yarra Reservoir–capacity 200,579 mega-litres (ML) and surface area 777 ha; Watts River 165 km2, Maroondah Reservoir–22,179 ML, 199 ha) and creeks with small catchment areas and diversion weirs (Donnellys Creek–14 km2, McMahons Creek–44 km2 and Armstrong
Creek–55 km2) (Table1). At the time of this study, the ages of water supply structures in the upper Yarra River system were 45–120 years, with Donnellys Creek weir being the oldest, constructed in 1893. Maroondah Reservoir in the Watts River was constructed in 1927, Upper Yarra Reser-voir in the Yarra River in 1959, and Armstrong Creek and McMahons Creek weirs in 1968. The heights of these structures range from ~1.5 m (Donnellys Creek weir) to 91 m (Upper Yarra dam), with heights for Maroondah dam on the Watts River, Armstrong weir, and McMahons weir being ~41 m, 4.5 m and 2.7 m, respectively. Although occasional downstream migrations may occur over the smaller barriers (namely, Donnellys, McMahons, and Armstrong creeks), all barriers were expected to perma-nently restrict upstream movement for the study species. The main disturbance events that occurred since installation of the water supply barriers were droughts and wildfires. Significant droughts that affected the entire study area were during 1967–1968, 1982–1983, and late 1996–mid 2010. Wildfires in 1983 affected the entire McMahons Creek system, and small areas and Armstrong and Upper Yarra below the barriers (Woodgate,1984), and wildfires in 2009 resulted in severe burning of substantial areas of the Arm-strong Creek catchment above the barrier, and low-severity burning within the Donnellys Creek and Watts River catchments (Feikema et al.,2013).
Southern river black
fish (Gadopsis marmoratus)
Gadopsis marmoratus sensu lato has a range across south-eastern Australia, being widespread in Victoria and present in parts of south east Queensland, eastern New South Wales and south east South Australia (Allen et al.,2002). Differ-ences in morphological features and multiple genetic studies indicate that G. marmoratus represents a species complex— most notably between“northern” and “southern” geographic regions (Sanger,1986; Ovenden et al., 1988; Miller et al.,2004; Ryan et al.,2004; Hammer et al., 2014). The candi-date species in this study, the southern-basin lineage (“SBA”), includes Victorian and Tasmanian systems drain-ing to Bass Strait (Hammer et al., 2014; Unmack et al.,
2017).
Based on 757 G. marmoratus individuals from our study area, Sanger (1986) measured a mean total length of 157 mm (range 27–420 mm) and growth rates of ~40 mm/year for thefirst 6 years of life. Their lifespan is at least 8 years (Sanger,1986; Koehn et al.,1994), with sexual maturity of females from 2 years old (Sanger, 1986). On the basis of these sexual maturity and lifespan estimates, we assume a generation time of 5 years for G. marmoratus, which cor-responds to between 9 and 24 generations of isolation due to the construction of water supply barriers in this study. Annual fecundity is low (usually <500 eggs), increasing
withfish size (Jackson,1978; Sanger,1986; Jackson et al.,
1996). Although movement of all life stages of G. mar-moratus is poorly understood, adults have a very small home range, usually <30 m of channel length, with occa-sional longer movements of up to ~200 m (Koehn, 1986; Khan et al.,2004; Koster and Crook,2008).
Sample collection
Between 2 April 2012 and 14 March 2013, a total of 366 G. marmoratus were caught using a backpack electrofishing unit (Smith-Root, Vancouver, WA, USA) from 28 sites
across five streams (Fig. 1; Supplementary Table S1). A total of 24–45 individuals were sampled from 2 to 3 sites above and 2 to 3 sites below each barrier. At each site, backpack electrofishing (Smith-Root Model 20b) was undertaken to sample between 50 and 600 m (mean 200, SE 7) of stream in an attempt to collect up to 15fish. Although the goal was to have similar distances between sites above and below each barrier, site selection was constrained by suitable access and the length of each stream. River dis-tances between sample sites, calculated with Network Analyst in Arc GIS 10.4 (ESRI), were 1.4–3.8 km (mean 2.2, SE 0.3) above each barrier and 0.9–5.6 km (mean 2.6, Fig. 1 Yarra River catchment, the location of water supply weirs and study sites. ARM Armstrong Creek, DON Donnellys Creek, MCM McMahons Creek, WAT Watts River, YAR Yarra River
SE 0.5) below each barrier. Total reach length surveyed above each barrier (the distance from the uppermost survey site to the barrier) ranged from 1.4 (Donnellys Creek) to 5.4 km (Yarra River), with a mean reach length of 3.9 km (SE 0.8). Total reach length surveyed below each barrier (the distance from the most downstream survey site to the bar-rier) ranged from 0.9 (Donnellys Creek) to 7.6 km (Watts River), with a mean reach length of 4.6 km (SE 1.1). Instream habitat (for example, stream width, riparian vegetation cover, substratum composition) was primarily homogenous across all sites within each stream, and catchment land cover was dominated by forest, except in the Watts River where the catchment below Maroondah Reservoir has been partially cleared for agriculture and the Healesville township. Given the small spatial scale between sample sites in each stream, historical biogeographic factors are unlikely to be influencing population genetic structure above and below each barrier.
The total length and the total weight of each captured individual were measured and a small piece of caudal fin (~3–5 mm2depending on fish size) was collected and pre-served in 100% ethanol prior to being stored in the laboratory at−20 °C. Fish were released after sampling. In this study, total length of G. marmoratus was 38–455 mm (mean 216.8, SE 4.7) and weight 1–830 g (mean 136.0, SE 7.2) (see also Supplementary Table S2 in Supplementary Material). To reduce the potential of closely related off-spring skewing population assessments, juveniles<60 mm total length (n= 5) were removed from genetic analyses.
Genetic variation
Total DNA was extracted from G. marmoratus fin clips using a salting-out DNA extraction protocol (Sunnucks and Hales, 1996) or a DNeasy Blood and Tissue kit (Qiagen, Hilden, Germany). Samples were genotyped using 11 microsatellite DNA markers developed for G. marmoratus (Ling et al., 2013) and amplified in two separate multiplex reactions (Plex A and B) following Beheregaray et al. (2004)—see also Supplementary Appendix S1 in Supple-mentary Material. Genotypes were determined using Gen-eMapper v4.0 software (Applied Biosystems, Foster City, CA, USA). Three loci previously found to be variable in other G. marmoratus populations (Gama02, Gama05, and Gama12) were monomorphic in all samples of this study (Supplementary Table S3 in Supplementary Material) and were removed from subsequent analyses, leaving eight polymorphic loci for statistical analyses. Tests for devia-tions from Hardy–Weinberg for each locus and linkage equilibria for each locus pair were performed using GEN-EPOP 4.1 (Rousset, 2008) for each sample site, and for ‘pooled samples’ (the 2–3 sample sites above each barrier in each stream, and the same for below the barrier). This
Table 1 Genetic characteristics of Gadopsis marmoratus populations above and below barriers in selected waterways within the Yarra River catchment, Victoria, Australia Waterway Barrier installed Barrier height (m) Upstream or Downstream of Weir Area above weir (km 2) nN a Ar Ho He HWE P -value FIS Ne Fe Armstrong 1968 4.5 Upstream 55 40 4.50 4.11 0.476 0.461 0.461 − 0.033 98.1 (23.2-Inf) − 0.043 Downstream 45 5.00 4.53 0.467 0.442 0.032 − 0.055 137.7 (49.1-Inf) Donnellys 1893 1.5 Upstream 14 30 3.50 3.47 0.516 0.477 0.117 − 0.083 10.9 (4.6 –25.7) 0.055 Downstream 30 3.88 3.80 0.542 0.505 0.995 − 0.073 10.7 (5.8 –19.9) McMahons 1968 2.7 Upstream 44 24 2.50 2.50 0.396 0.396 0.078 0.002 8.3 (1.7 –205.6) 0.161 Downstream 44 4.13 3.94 0.472 0.472 0.802 0.000 30.3 (13.5 –110.9) Watts 1927 41 Upstream 165 45 5.25 4.93 0.507 0.507 0.268 − 0.003 Inf (87.4-Inf) − 0.095 Downstream 29 4.75 4.53 0.397 0.463 0.036 0.144 39.3 (14.1-Inf) Yarra 1959 90 Upstream 337 28 4.50 4.33 0.473 0.466 0.861 − 0.015 67.5 (15.2-Inf) − 0.112 Downstream 45 4.88 4.37 0.403 0.419 0.565 0.039 632.5 (52.5-Inf) Number of individuals (n ), average number of alleles per locus (N a ), allelic richness (A r ) corrected for a minimal sample size of 24 individuals, expected (H e ) and observed heterozygosity (H o ), P -value of the Hardy –Weinberg Equilibrium (HWE) exact test, FIS value, effective population size estimates (N e , with 95% con fi dence intervals) based on the LDNe method and effective inbreeding coef fi cient (F e ).
pooling was justified because there was no spatial auto-correlation at this spatial scale (<5.6 km), and even though pooling would tend to increase homozygous excess and
linkage disequilibrium, no deviations from
Hardy–Weinberg and linkage equilibria were significant after correction for multiple tests (Supplementary Appen-dices S2 and S3 in Supplementary Material, and Results section). Significance of tests was assessed following a false discovery rate correction for multiple tests (Benjamini and Hochberg,1995) with a nominal significance level of 5%. Observed and expected heterozygosities (Ho and He) and
Weir and Cockerham’s (1984) estimate of FISwere
calcu-lated using GENEPOP 4.1, for each sample site, and for pooled samples (one pool above each barrier in each stream, and one below). Using the rarefaction procedure imple-mented in FSTAT 2.9.3.2 (Goudet,1995, 2001; El Mou-sadik and Petit,1996), for each locus we calculated allelic richness corrected for sample size (Ar) for≥6 individuals at
single sample sizes, and ≥24 individuals in the pooled samples.
Regional genetic structure
To understand the extent to which populations might be interconnected throughout the entire study area, population genetic structure across all sample sites was assessed using Bayesian clustering in STRUCTURE Version 2.2 (Pritchard et al.,2000), with the admixture model and correlated allele frequencies (Falush et al.,2003). To determine the number of clusters (K) within the complete data set, ten replicate runs of 2× 10⁶ Markov chain Monte Carlo (MCMC) iterations, after an initial burn-in period of 5× 10⁵ itera-tions, were performed for values of K ranging from 1 to 10 (the maximum set to the number of pooled samples). Results were summarised using the standard pipeline on the CLUMPAK web server (Kopelman et al.,2015). The most likely number of clusters (K) was explored using the esti-mated logarithm of likelihood (LnP(D)) and the Evanno et al. (2005) ΔK method that finds the point of greatest change in the distribution of LnP(D) with STRUCTURE HARVESTER Version 0.6.92 (Earl and vonHoldt,2012). We further explored genetic structure within the two main infered clusters by analyzing them independently using the same settings (Supplementary Appendix S2 in Supple-mentary Material).
Assessing the background level of genetic structure
To assess the extent of background genetic structure, we performed spatial autocorrelation analyses and IBD tests for below-barrier sample sites that are still connected via the mainstem of the Yarra River (that is, nine below-barrier sites in Armstrong Creek, McMahons Creek and Yarra
River, separated by up to 13.2 km). Spatial autocorrelation was investigated with SPAGEDI 1.5 (Hardy and Vekemans,
2002), computing the kinship coefficient of Ritland (1996) to assess genetic similarity among pairs of individuals using 2000-m distance class sizes from 0 to 13.2 km (the maximal distance between two sample sites). Thefirst distance class (0 m) included individuals caught from the same sampling location. For each distance class, significant deviation of spatial autocorrelation patterns from a random distribution of genotypes was tested by 10,000 random permutations of individuals (for the same sampling location) and individual locations (for the other distance classes). IBD was analysed by regressing pairwise estimates of FST /(1−FST) against
river distance between sample sites (Rousset, 1997), and tested using a Mantel test (10,000 permutations) with GENEPOP 4.1. Similar analyses were not performed for the Watts River sub-catchment due to low number of samples and low sample sizes below barriers.
Comparing differentiation across barriers to
background level of differentiation
To compare genetic differentiation across barriers to back-ground levels of genetic differentiation, we used the pooled samples above and below each barrier within each stream. Using FSTAT, we calculated Weir and Cockerham (1984) pairwise FST values: (1) above versus below each barrier,
and (2) between the below-barrier samples in each sub-catchment (Watts River or Upper Yarra). The significance of FST values was determined using 45,000 permutations.
We also explored Dest values, which more accurately
account for differences in allelic diversity than does FST
(Jost, 2008), calculated with GENALEX Version 6.5 (Peakall and Smouse,2012). However, since Destvalues did
not show different patterns than FST, we only report Dest
values but do not discuss them further.
Assessing the effect of barriers on genetic diversity
and inbreeding
To test for differences in genetic diversity above and below each barrier, Ar was used instead of Hebecause it is more
sensitive to recent reductions in population size (Schwartz et al.,2007). Linear mixed models were run using the“lmer” function implemented in the lme4 package (Bates et al.,
2015) in R 3.1.3, with Ar at individual sample sites as the
response variable. The location of sample sites relative to barriers (weir_side, two levels- above- and below barrier) was included as afixed factor. Because progressive loss of genetic diversity through drift in small, isolated populations above barriers was expected to depend on: i) population size above the barrier and ii) the number of generations since isolation, we included a fixed factor (catchment_type, two
levels) separating the two rivers with large catchments (Yarra and Watts rivers) from the three creeks with small catchments (Donnellys, Armstrong and McMahons creeks) as a proxy for population size, and the age of the barrier (weir_age) as a proxy for the number of gen-erations since isolation of above-barrier populations. We also included the pairwise interactions weir_side:catch-ment_type and weir_side:weir_age. Locus identity was included as a random intercept. Models were validated a posteriori by checking plots of residuals. Significance of fixed effects was assessed with analysis-of-deviance tables (function Anova in the R package car). Post-hoc compar-isons of mean allelic richness between populations above and below barriers (pooled into small streams and large rivers separately) was performed using the“lsmeans” func-tion implemented in the lsmeans package (Lenth,2016) for R 3.1.3.
To approximate inbreeding due to small Ne,
hetero-zygosity can be scaled by the heterohetero-zygosity of a known outbred population using the effective inbreeding coef fi-cient“Fe” that is, Fe= 1−He inbred/He outbred, where He inbredis
heterozygosity (for neutral variation) of a population in question and He outbred is heterozygosity of an outbred
population (Frankham,1998). We assumed that the pooled samples below each barrier in each stream are not impacted by isolation, and thus can be used as the outbred reference for above-barrier sites in the respective stream. At Fe of
>0.2, inbreeding depression is typically observed for populations of naturally outcrossing species (Frankham,
1995; Woodworth et al.,2002; Szulkin and Sheldon,2007; Walling et al., 2011), and major reductions in lifetime reproductive success can occur even below Fe of 0.1
(Huisman et al.,2016).
Testing for bottlenecks and estimating effective
population size (N
e)
To test for evidence of recent reductions in effective population size that might relate to disturbance events, we used BOTTLENECK (Cornuet and Luikart, 1996) on the pooled samples above or below each barrier within each stream. BOTTLENECK performs a test of heterozygosity excess that compares observed results to theoretical expectations based on a population at equilibrium. Tests were performed using the stepwise mutation model (SMM) and the two-phase model of mutation (TPM), although TPM is likely to be more suitable for most microsatellite loci (Cornuet and Luikart, 1996). Default settings con-sidered appropriate for most microsatellites were applied that is, variance for TPM 30, with 70% of mutations fol-lowing SMM. Wilcoxon’s signed-rank test was applied to determine significance of a heterozygosity excess based on 1,000 iterations (Cornuet and Luikart,1996).
Effective population sizes (Ne) were estimated using the
linkage disequilibrium method (LDNe) (Waples and Do,
2008) in NeESTIMATOR V2.0 (Do et al., 2014). Newas
calculated for the pooled samples, as estimates from small sample sizes are not reliable (Tallmon et al., 2010). A threshold of 2% was applied to remove rare alleles, which have been shown to bias estimates. The LDNe method makes the following important assumptions: (1) loci are selectively neutral and unlinked, (2) populations are closed, and (3) generations are discrete. Due to low dispersal and breeding likely constrained to small local areas, G. mar-moratus fail to meet the second assumption. Our estimates do not reflect the global (above or below barrier) ‘popula-tion’ but reflect the effective size in the sampled area (Neel et al., 2013). In addition, because G. marmoratus are iter-oparous and have overlapping generations, they also fail to meet the third assumption. Thus, it is possible that Ne
estimates from this study are downwardly biased by more than 50% (Waples et al.,2014). Nevertheless, Neestimates
provide useful comparisons between streams, and between populations above and below each barrier.
Assessing the effect of a barrier, accounting for
background genetic structure
To evaluate our power to detect an effect of a barrier through time for various Ne values and using a
space-for-time substitution design (in the absence of temporal data, contemporary spatial patternsare observed to infer likely historical or future changes, see for example, Blois et al.
2013), we ran simulations using a generation-by-generation coalescent algorithm that can simulate spatially limited dispersal (and resulting background genetic structure), implemented in IBDsim 2.0 (Leblois et al. 2003, 2009). Consistent with our G. marmoratus data set for each stream, simulated data sets had 90 diploid individuals genotyped at 8 independent microsatellite loci. Mutations of the micro-satellite loci followed a generalised stepwise mutation model with variance of 0.36 and a maximum range of allelic states of 60. We fixed the mutation rate to 0.0003, which resulted in ranges of expected heterozygosity values similar to those observed in our data. We simulated a single stream as a linear network with 160 nodes and 200 m between two successive nodes, and sampled 15 individuals per node, every 10 nodes, for 9 nodes starting from the 70th node (Supplementary Fig. S4). The barrier was placed between nodes 125 and 126. This spatial model reflected a scenario where the stream was connected to a larger downstream system with a much smaller upstream catchment. Sampled nodes were subsequently pooled to mimic the spatial design of our real data set (Supplementary Fig. S4). We ran simulations for three dispersal scenarios: (1) Panmixia, (2) IBD, and (3) IBD+ asymmetric migration. For each
dispersal scenario, we ran simulations for three effective densities (De): 3, 10 and 30 individuals per node (or 15, 50
and 150 individuals per km of stream) to cover the range of population sizes in each study stream. According to the formula Ne= Nt/ (1-FST) (Wright 1943), where Nt is the
total number of individuals, these densities correspond to Ne
values for above-barrier populations of ~110, 370 and 1100 individuals, respectively. Limited dispersal for the IBD scenario was simulated using a geometric dispersal dis-tribution. Dispersal was spatially limited to obtain levels of genetic structure that were compatible with the values observed in the Yarra River sub-catchment (based on IBD regression slopes among sample sites and pairwise FST
values among the pooled samples below each barrier). Maximal dispersal distance was set to 40 nodes, the emi-gration rate (e) and geometric distribution parameter (g) were set to 0.5/0.95, 0.25/0.9 and 0.15/0.85 for Deof 3, 10
and 30 individuals per node, respectively. To evaluate the impact of asymmetric migration across the barrier, we ran an IBD+ asymmetric migration scenario with the same set of parameters, while allowing downstream geneflow at a rate of 0.2. To compare simulation results with a more typical scenario where there is no genetic structure along each stream prior to the installation of barriers, we also ran a Panmixia scenario, for which the maximum dispersal dis-tance was set to 160 nodes (the size of the network), the emigration rate (e) and the geometric distribution parameter (g) were set to 1/1. For each dispersal scenario and effective density, 50 data sets were simulated assuming no barrier and assuming a complete barrier introduced at various number of generations prior to sampling (5, 10, 15, 20, 25, 50 and 100), chosen to incorporate the range of barrier ages observed in our study area (45–120 years or ~9–24 generations).
For 50 data sets simulated with each combination of parameters (dispersal, De and age of the barrier), we
cal-culated allelic richness in pooled sampled nodes above (nodes 130, 141 and 151) and below the barrier (nodes 100, 110 and 120), and IBD regression slopes for the simulations without a barrier using the GENEPOP 4.1 and adegenet package in R 3.1.3. Weir and Cockerham’s pairwise FST
was calculated using genpop for each locus and globally among (i) pooled sampled nodes 130, 141, and 151 (above the barrier at node 126) and pooled sampled nodes 100, 110 and 120 (below the barrier at node 126), and (ii) among pooled sampled nodes 100, 110 and 120 and 70, 80 and 90 (all below the barrier at node 126). To determine whether pairwise FSTvalues between pooled nodes above and below
the barrier were significantly higher than pairwise FST
values between pooled nodes below the barrier, we used a paired Wilcoxon test and each locus as replicate unit. We also conducted similar Wilcoxon tests using the observed data, where pairwise FSTvalues between pooled sites above
and below each barrier were compared to pairwise FST
values between pooled sites below barriers, but connected via the Yarra River mainstem, within each sub-catchment. Finally, to evaluate our power to detect an effect of a barrier with more markers, we ran the same simulations with 20 microsatellite loci and the same characteristics as above.
Results
Low levels of genetic variation
Genotypic data revealed low levels of genetic diversity at eight polymorphic microsatellite loci, with the number of alleles per locus ranging from 3 to 14 per population (Supplementary Table S1 and S3 in Supplementary Mate-rial). After false discovery rate correction, there was no significant departure from HWE for any sample site, or for the pooled samples above and below each barrier (Table1, Supplementary Table S1). No pair of loci showed sig-nificant LD. Within the pooled samples, observed and expected heterozygosities were between 0.396–0.516 and 0.396–0.507, respectively, and allelic richness ranged from 2.50 to 4.93 (Table1). At individual sample sites, observed and expected heterozygosities were between 0.266–0.583 and 0.362–0.534, respectively, and allelic richness ranged from 2.12 to 3.52 (Supplementary Table S1).
Regional and local population genetic structure
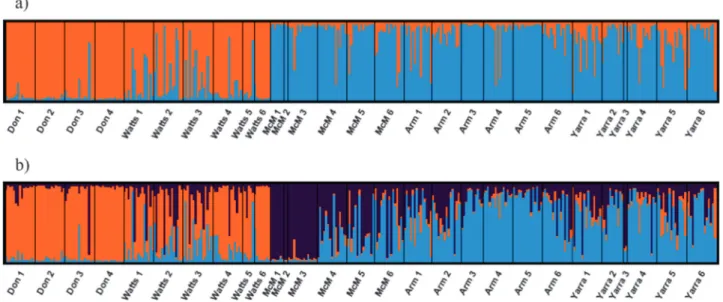
The most likely value of K from the STRUCTURE analysis based on the method of Evanno et al. (2005) was two (Supplementary Table S4 in Supplementary Material), dif-ferentiating the two geographically distinct sub-catchments, namely, the Watts River sub-catchment and the upper Yarra River sub-catchment (Fig. 2a). However, LnP(K) was highest for K= 3 (Supplementary Table S4 in Supple-mentary Material). With K= 3, STRUCTURE identified a third cluster corresponding to samples above the barrier in McMahons Creek (Fig. 2b). Lack of further fine-sale structure within the upper Yarra River sub-catchment was confirmed by a separate analysis of this sub-catchment (Supplementary Appendix S2 in Supplementary Material). Separate analysis of the Watts River sub-catchment revealed a cluster represented predominantly in the above-barrier samples of the Watts River when K= 2 was assumed (Supplementary Appendix S2 in Supplementary Material).
Spatial genetic autocorrelation analysis between pairs of individuals below barriers in the Yarra River sub-catchment showed significant and positive kinship values for the first distance class only (Fig. 3a), suggesting limited migration rates in the species. Furthermore, genetic similarity between
individuals decreased from 0 to 10 km, suggesting IBD at this scale. A pattern of IBD was suggested by the positive relationship between genetic differentiation and spatial distance among below-barrier sample sites in the Yarra River sub-catchment, although slightly below statistical significance (Fig. 3b, Slope= 2.61 × 10⁻⁶, 95% CI: (−8.24 × 10⁻⁷–6.23 × 10⁻⁶) with distance expressed in metres, Mantel test P-value= 0.069).
Comparing differentiation across barriers to
background differentiation
Pairwise FST values between all pooled sites were all
sig-nificantly different from zero (Table2). Pairwise FSTvalues
between above- and below-barrier pooled samples calcu-lated for each stream (FST= 0.029–0.038) were similar to
values between the below-barrier samples pooled within each sub-catchment (FST= 0.023–0.035). The exception
was McMahons Creek, where FST between above and
below-barrier pooled samples was 0.129.
Effect of barriers on genetic diversity and
inbreeding
Linear mixed modelling did not identify a significant effect of weir_side on allelic richness across all sample sites (P-value= 0.086), although allelic richness in above-barrier sample sites was significantly lower in smaller catchments (Donnellys, Armstrong and McMahons creeks) compared to larger catchments (Watts and Yarra rivers)—that is, there was a significant weir_side:catchment_type interaction; estimate= −0.62 SE 0.23, P-value = 0.007 (Table 3). In Fig. 2 Summary of results of STRUCTURE analysis for K= 2 a and K = 3 b: plots indicate proportional assignment of individuals (bars) to the colour-coded genetic clusters. The population of origin is indicated on the x axis in upstream to downstream order for each stream
Fig. 3 a Autocorrelogram showing the Ritland kinship coefficient (Ritland,1996) as a function of distance (expressed in metres) on pairs of individuals from below-barrier sample sites of the Yarra River sub-catchment. The first distance class represents pairwise comparisons between individuals from the same sampling location. Filled dots indicate departure from the 95% CI for the null hypothesis of a random distribution of genotypes determined by 10,000 random permutations of individuals (first distance class) and individual locations (for the other distance classes). b Pairwise FSTamong sample sites regressed
over distance in the Yarra River sub-catchment. Black dots represent pairwise FSTvalues between sample sites above and below barriers in
each stream, while grey dots represents pairwise FSTvalues among all
smaller catchments, below-barrier sample sites had sig-nificantly higher allelic richness than above-barrier ones (estimate= 0.314 SE 0.149, P-value = 0.037), while in larger catchments, there was no significant difference (estimate= -0.308 SE 0.175, P-value = 0.08). There was no effect of barrier_age or interaction with catchment_type on allelic richness. The variance estimate for the random intercept on loci was 1.69 (SD 1.3).
The effective inbreeding coefficient (Fe) calculated in
pooled samples above barriers within each stream was positive in Donnelly’s Creek (Fe= 0.055) and McMahons
Creek (Fe= 0.165, Table 1), suggesting inbreeding in G.
marmoratus populations within these streams, particularly McMahons Creek.
Bottleneck tests and estimation of N
eBOTTLENECK test results provided evidence for a recent bottleneck in the pooled samples above McMahons Creek
weir under the TPM and SMM mutation models, but no bottlenecks were found in any other population (Table 4). Confidence intervals for Ne estimates included infinite
values for populations in the Watts and Yarra rivers and in Armstrong Creek, suggesting insufficient power in our data to estimate Nein these three larger streams (Tallmon et al.
2010). For the pooled samples above and below barriers within the two smallest creeks, small Ne estimates were
obtained in Donnellys Creek and were similar above and below the barrier (10.9 and 10.7, respectively), while in McMahons Creek, Ne was lower above than below the
barrier (8.3 and 30.8, respectively).
Table 2 FST(lower diagonal) and Dest(upper diagonal) values for Gadopsis marmoratus populations pooled according to stream and either
upstream (‘US’) or downstream (‘DS’) of each water supply weir
Stream ARMUS ARMDS DONUS DONDS MCMUS MCMDS WATUS WATDS YARUS YARDS
ARMUS 0.032 0.115 0.115 0.148 0.027 0.062 0.065 0.038 0.023 ARMDS 0.037 0.126 0.153 0.165 0.031 0.065 0.082 0.029 0.018 DONUS 0.115 0.130 0.029 0.151 0.087 0.056 0.073 0.083 0.088 DONDS 0.111 0.147 0.029 0.155 0.109 0.057 0.034 0.128 0.103 MCMUS 0.162 0.183 0.161 0.157 0.117 0.153 0.193 0.127 0.144 MCMDS 0.030 0.035 0.088 0.103 0.129 0.060 0.079 0.017 0.026 WATUS 0.062 0.067 0.054 0.053 0.151 0.059 0.034 0.058 0.044 WATDS 0.071 0.091 0.076 0.035 0.203 0.083 0.035 0.092 0.056 YARUS 0.042 0.034 0.085 0.119 0.143 0.018 0.057 0.096 0.031 YARDS 0.028 0.023 0.099 0.109 0.172 0.031 0.049 0.067 0.038
All pairwise FSTand Destestimates are significant after adjustment for multiple comparisons.
ARM Armstrong Creek, DON Donnellys Creek, MCM McMahons Creek, WAT Watts River, YAR Yarra River
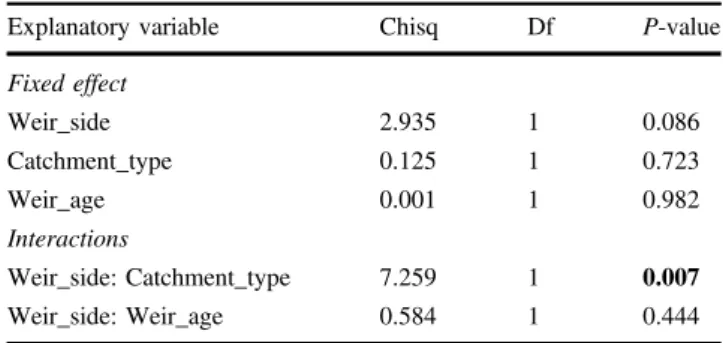
Table 3 Linear mixed model results to test the direct effects and interaction of barriers (weir_side), catchment size (catchment_type) and barrier age (weir_age) on Gadopsis marmoratus populations in the Yarra River system
Explanatory variable Chisq Df P-value
Fixed effect Weir_side 2.935 1 0.086 Catchment_type 0.125 1 0.723 Weir_age 0.001 1 0.982 Interactions Weir_side: Catchment_type 7.259 1 0.007 Weir_side: Weir_age 0.584 1 0.444
Significant P-value is shown in bold
Table 4 BOTTLENECK results for Gadopsis marmoratus populations upstream and downstream of water supply barriers in the Yarra River systema,b
Waterway Upstream or Downstream of Weir TPM SMM Mode shift Armstrong Upstream 0.770 0.980 No Downstream 0.656 0.961 No Donnellys Upstream 0.230 0.629 No Downstream 0.234 0.711 No
McMahons Upstream 0.020 0.039 Yes
Downstream 0.055 0.406 No
Watts Upstream 0.371 0.844 No
Downstream 0.844 0.990 No
Yarra Upstream 0.594 0.852 No
Downstream 0.963 0.990 No
aProbability of heterozygote excess according to the Wilcoxon
sign-rank test under the TPM (Two-phased model of mutation) and SMM (Stepwise Mutation Model) for each population.
Assessing the effect of a barrier, accounting for
background genetic structure
With limited dispersal (IBD and IBD+ asymmetric migra-tion scenarios) and for each effective density, simulated data sets without a barrier yielded pairwise FST values among
pooled sampled nodes above and below node 126 (barrier location) and IBD regression slopes among sampled nodes consistent with observed values between sample sites below barriers in the Yarra River sub-catchment (Table 5). Simulations with 20 loci indicated increased power to detect sigificant IBD patterns compared to 8 loci, where using the 20 loci, simulation IBD regression slopes ranged from 3.026× 10⁻⁶ (SD 1.992× 10⁻⁶) to 3.275× 10⁻⁶ (SD 1.587× 10⁻⁶) and the percentage of significant Mantel tests ranged from 66 to 96. This result compares to the simula-tions with eight loci where regression slopes ranged from 2.395× 10⁻⁶ (SD 3.431× 10⁻⁶) to 3.417× 10⁻⁶ (SD 2.562× 10⁻⁶) and the percentage of significant Mantel tests ranged from 28 to 76. Even without a barrier, allelic rich-ness in pooled upstream nodes was slightly lower than in pooled downstream nodes (Supplementary Table S8).
Simulations with a complete barrier suggested that low effective densities (De) would be required for genetic drift to
increase FST values substantially (for example, FST>0.1)
over the number of generations since the installation of barriers in the study area (up to ~25 generations) regardless of the dispersal scenario (Fig. 4). However, substantial differences in the ability to detect a barrier effect with a space-for-time substitution design were evident between Panmixia and IBD scenarios (Supplementary Table S8). In the Panmixia scenario, within only 15 generations, sig-nificantly higher FSTvalues were detected across the barrier
in more than half the simulated data sets with low and medium effective densities (15 and 50 individuals per km), while 100 generations are likely to be required in the IBD scenario to reach a similar threshold (Fig. 4). Simulations with asymmetric migration showed that downstream gene flow slightly delays the development of genetic differ-entiation and the ability to detect a barrier effect (Fig.4and Supplementary Table S8). Allelic richness in pooled nodes above the barrier was predicted to progressively decrease with the number of generations since barrier installation.
Variation in FSTestimates was high among our simulated
data sets, and most likely reflects the limited statistical power of eight polymorphic loci. Indeed, simulations with 20 microsatellite loci with same characteristics showed a substantial increase in power to detect barrier impacts (Supplementary Table S9 and Supplementary Fig. S5 in Supplementary Material).
Comparing these simulations with observed pairwise FST
values above and below each barrier compared to pooled sites below barriers (Supplementary Table S10) and the number of generations since barrier installation for each stream, the above-barrier population of McMahons Creek is likely to have recently experienced strong genetic drift–with effective densities much lower than 15 individuals per km (global upstream population of <110 individuals). This is consistent with our Ne estimate (~10 individuals over the
sampled area) and the detection of a bottleneck. For Don-nellys Creek, however, where the barrier is the oldest (~25 generations) and Newas estimated to be similar to
McMa-hons Creek above the barrier, the low level of differentia-tion (FST= 0.029) cannot be attributed to downstream gene
flow only.
Table 5 IBDsim simulation parameter summary and mean values based on 50 simulations without a barrier, compared to the observed data set for all sites downstream of barriers in the Yarra sub-catchment
Dispersal scenario Observed
data set
Panmixia IBD
Density of individuals per km (De) 15 50 150 15 50 150
Dispersal parameters
maximum dispersal distance 160 nodes 40 nodes
emigration rate (e) 1 1 1 0.50 0.25 0.15
geometric distribution (g) 1 1 1 0.95 0.90 0.85 Summary statistics IBD slope (SD) 2.61× 10⁻⁶ NA NA NA 2.395× 10⁻⁶ (3.431× 10⁻⁶) 3.417× 10⁻⁶ (2.562× 10⁻⁶) 3.306× 10⁻⁶ (1.991× 10⁻⁶) FSTabove-below node 125 (SD) 0.023–0.035 0 (0) 0 (0) 0 (0) 0.027 (0.023) 0.029 (0.011) 0.027 (0.009)
Arratio (pooled nodes 100,110,120)/
pooled nodes 130,140,150)
1.000 1.000 1.000 0.951 0.957 0.948
Discussion
Evaluating the impacts of barriers on low-mobility
species
We sought to address a lack of studies that assess the genetic impacts of artificial barriers on freshwater fish species with low mobility. On the basis of spatially explicit simulations and an extensive empirical data set, our study highlights the importance of accounting for background genetic structure in species of low mobility to avoid falsely attributing genetic impacts to barriers. For example, a simple test of genetic differentiation across a barrier may be insufficient to establish the effect of a barrier alone. In these cases, barrier effects can only be identified if there is a significant increase in genetic differentiation that exceeds background levels of genetic structure. This can be assessed
with temporal sampling (Schwartz et al., 2007) or with a space-for-time substitution study design (such as the present study). Genetic impacts from barriers were most evident in one of our small streams. This result is likely to be asso-ciated with a recent bottleneck and restricted gene flow imposed by the barrier that limits population recovery. In the other study streams, a lack of evidence for significant barrier effects can be attributed to larger population sizes or, in the case of the smallest barrier, gene flow across the barrier.
Background levels of genetic structure and diversity
Genetic differentiation was greatest between the two geo-graphically distinct sub-catchments: the‘Upper Yarra River sub-catchment’ (Upper Yarra River, Armstrong Creek and McMahons Creek) and the ‘Watts River sub-catchment’ Fig. 4 Simulated increases in population differentiation (pairwise FST
± SD based on 50 simulated data sets) with time (number of genera-tions) using eight microsatellites markers. Pairwise FST values are
shown (i) between pooled nodes above the barrier (nodes 130, 140 and 150) and pooled nodes below the barrier (nodes 100, 110, 120) (grey),
and (ii) among two pools of nodes below the barrier (nodes 100, 110, 120 compared to nodes 100, 110, 120) (black) per dispersal scenario: Panmixia a–c, IBD d–f and IBD + asymmetric migration g–i and effective density: 15 individuals per km a, d, g, 50 individuals per km b, e, h and 150 individuals per km c, f, i
(Watts River and Donnellys Creek). Given that the two sub-catchments are currently hydrologically connected via the mainstem of the Yarra River, differentiation between these two sub-catchments is likely due to the low mobility of G. marmoratus (Koehn,1986; Khan et al., 2004; Koster and Crook, 2008). Within the Yarra River sub-catchment, a pattern of isolation-by-distance was suggested and spatial genetic autocorrelation was significant between individuals at the scale of individual sample sites only. Inference of poor dispersal is consistent with thefindings of substantial genetic structure and population differentiation at spatial scales of <5 km to 100’s of km between study sites for northern G. marmoratus within the Murray-Darling Basin (Huey et al., 2017; Lean et al., 2017). While genetic diversity of G. marmoratus within the study area was generally low at all sample sites, low genetic diversity was also found within other populations across the broader range of the species complex (Huey et al.,2017; Lean et al.,
2017). A strong effect of drift due to restricted migration rates and low population effective size is the most likely explanation and has been suggested to relate either to fragmentation due to human activities or to life history characteristics of the species (Huey et al.,2017; Arias et al.,
2013; Lean et al., 2017).
Effects of barriers on population differentiation and
genetic diversity in structured populations
Theory and simulation-based studies predict that the effect of genetic drift on genetic diversity and structure depends on the effective population size and the number of gen-erations since population isolation (Leblois et al., 2006; Gauffre et al., 2008; Landguth et al., 2010). Failing to account for prior population structure at small spatial scales (for example, within streams) for low-mobility species, however, could lead to erroneously attributing natural levels of differentiation to the effect of a barrier; but examples where local background structure is present and explicitly accounted for in tests of barrier effects in freshwater sys-tems appear to be rare. The presence of population structure also results in longer lag times before genetic patterns can be detected (Leblois et al., 2006; Landguth et al., 2010). Our spatially explicit simulations suggest that, even without barriers, we could expect: (i) slightly lower genetic diversity (Ar) within upper reaches compared to the lower reaches,
and (ii) significant differentiation between upper and lower reaches within our study streams. Hence, in non-panmictic populations such as G. marmoratus in our study area, sig-nificant genetic differentiation (FST) across barriers cannot
be solely attributed to barrier effects.
Our simulations also showed that, when a barrier was introduced, if the number of generations since population isolation is low (<25 generations), substantial loss of
diversity above a barrier and development of genetic dif-ferentiation across barriers will only occur in IBD popula-tions when effective densities are small (for example, 15 individuals per km). In addition, when asymmetrical gene flow was taken into account in IBD populations, effects of barriers were unlikely to become evident even in the smallest simulated effective density of 15 individuals per km for up to 50 generations. Results from the IBD simu-lations with and without asymmetrical gene flow were in clear contrast to those for panmictic populations. In the simulations for panmictic populations, substantial loss of diversity above a barrier and development of genetic dif-ferentiation across barriers can be expected within much smaller timeframes (for example, <5 generations for effective densities of up to 50 individuals per km) and for larger population densities (for example, <25 generations for effective densities up to 150 individuals per km). On the basis of our estimates of effective population sizes and number of generations since the presence of barriers (~9–24), an effect of barriers on genetic structure and diversity was only expected in the two smallest study streams (Donnellys and McMahons creeks).
High variance among simulated data sets reflects the limited ability of a small number of microsatellite markers with low diversity to detect genetic effects (Landguth et al.,
2012). This inference was supported results from our simulations using 20 loci, which suggest that impacts from barriers had the potential to be detected much sooner with a greater number of loci (for example, for IBD scenarios with or without asymmetrical geneflow, within 5–10 generations for effective densities of 15 individuals per km or within 15–50 generations for effective densities of 50 and 100 individuals per km, respectively). Simulations with 20 loci also indicated an increased power to detect IBD compared to eight loci based on the percentage of simulations with a significant Mantel test.
We originally hypothesised that populations isolated upstream of barriers would have lower genetic diversity compared to downstream populations that are more inter-connected over a much larger area of habitat. In particular, we hypothesised that genetic diversity in isolated popula-tions upstream of barriers would vary depending on barrier age, the size of the upstream population and disturbance history. Using our observed data set, we found support for the effect of population size, but not the age of the barrier. The size of the populations (based on catchment area) was found to be important for retention of genetic diversity above barriers. Importantly, we cannot relate this result directly to barrier effects, because simulations showed that even in the absence of a barrier upstream, genetic diversity is still expected to be lower above barriers. In addition, contrary to expectations based on simulations, we found more genetic diversity above barriers in the two largest
streams (upper Yarra and Watts rivers)–indicating likely large densities of individuals above barriers in these two rivers. This finding is consistent with those of Whiteley et al. (2010,2013), who observed in brook trout (Salvelinus fontinalis) and cutthroat trout (Oncorhynchus clarkii clar-kii) populations that the largest patches above barriers had higher genetic diversity than adjacent below-barrier patches, and Gouskov et al. (2016), who observed that large lake populations of European chub (Squalius cephalus) were important for sustaining genetic diversity in fragmented rivers. It is likely that large reservoirs in our system (Mar-oondah reservoir for the Watts River and upper Yarra reservoir for the Yarra River) sustain large populations and provide refuge habitats for G. marmoratus during droughts, such as those experienced in 1982–83 and late 1996–mid 2010.
On the other hand, genetic differentiation across the barrier in McMahons Creek was the highest and was associated with a reduction in genetic diversity above the barrier. This suggests that low diversity is likely to be the driver of the differentiation (similar to the results of Cole-man et al.2013for dwarf galaxias (Galaxiella pusilla) and Weeks et al.2016 for Australian mammals). Compared to expectations based on simulations, the population density in McMahons Creek is anticipated to be below the lowest simulated effective density (<15 individuals per km), which is consistent with evidence of a recent bottleneck in the upper McMahons Creek population. One likely explanation for a bottleneck in McMahons Creek is the 1983 wildfires that affected the entire McMahons Creek catchment (Woodgate 1984). Impacts of fire on aquatic ecosystems include a range of chemical, physical and biological chan-ges that can be direct and immediate, as well as indirect and long-term. These impacts are strongest for populations isolated by anthropogenic activities, wherefish are unable to recover post-fire via immigration from below into affected areas (Gresswell, 1999; Lyon and O’Connor,
2008). For example, habitat connectivity was inferred to be important for the recovery of rainbow trout (Oncorhynchus mykiss) populations following catchment disturbance from fires, where genetic diversity was lower in populations upstream of barriers due to culverts (Neville et al.,2009). By preventing geneflow following a bottleneck, the water supply weir on McMahons Creek appears to have impeded recovery of the upstream population compared to the downstream population that has greater genetic diversity.
Given that the Donnellys Creek population above the barrier has the smallest catchment and the oldest weir, we expected loss of genetic diversity and elevated pairwise FST
above and below the barrier. Whilst loss of genetic diversity upstream was lower than expected, FST was smaller than
predicted in simulations, even with substantial downstream geneflow. This finding suggests that downstream gene flow
alone cannot explain results for this stream. Donnellys Creek weir is the lowest of the study barriers (~1.5 m high), so it is plausible that there has also been some upstream migration of individuals over the weir during extreme streamflows or from undocumented translocations into the upstream weir pool. Homogenisation of gene pools of Roanoke logperch (Percina rex) above and below older (c. 1920), but smaller artificial barriers (~10 m high), was thought to be associated with at least one-way gene flow across the barrier (Roberts et al.,2013).
Management implications
In the context of the classic Wright-Fisher model for closed panmictic populations, the minimum effective population sizes necessary for viable isolated populations are estimated to be ~100 individuals to avoid inbreeding depression in the short-term, and 1000 or more to maintain adaptive potential in the long-term (Frankham et al., 2014). In IBD popula-tions, however, where dispersal is restricted and there is a higher probability that individuals preferentially breed with those in close proximity, detection of genetic impacts such as loss of genetic diversity due to habitat reduction, is expected to differ from panmictic populations for a given population size and temporal scale (Leblois et al., 2006). Accordingly, in order to accurately evaluate the impacts of barriers on species with low mobility and determine the need for management intervention, it is essential to take underlying IBD genetic patterns into account.
Observations of genetic impacts in this study were not related to barrier age and, instead, we demonstrated impacts in one stream within 45 years of isolation (approximately nine generations). The G. marmoratus population above the McMahons Creek weir is likely to be at risk from inbreeding and poor adaptive potential, which is supported by a higher effective inbreeding coefficient (Fe= 0.161).
This finding highlights the importance of maintaining population connectivity in small streams where genetic impacts of a barrier due to restricted geneflow following a disturbance event can develop within just a few generations. Immediate actions to improve connectivity and gene flow could include the installation of fishways on the smaller streams showing signs of genetic drift above barriers, as demonstrated for European chub (Gouskov et al., 2016). Where afishway is not feasible (for example, due to site or cost constraints), intermittent translocations from down-stream populations might be advantageous for improving genetic diversity and adaptive potential–especially in upper McMahons Creek, where a recent bottleneck leading to high inbreeding and loss of genetic diversity was detected.
This study indicates that activities aiming to facilitate geneflow for freshwater fish along streams are particularly relevant for small, isolated populations that are more
vulnerable to disturbance events (such as wildfire or drought) and are currently unable to recover via geneflow from downstream populations. In addition, the need for assisted geneflow is increased for species with low mobility that may take longer to recover from genetic impacts than more mobile species (Landguth et al., 2010). Loss of genetic diversity in these situations must be addressed alongside more commonly considered threats, in this case exemplified by habitat modification (especially removal of large woody debris), sedimentation (for example, smother-ing of eggs), altered stream flows, interactions with alien species (such as brown trout, Salmo trutta) and recreational fishing (Koehn and O’Connor,1990; Lintermans,2007).
To determine the effectiveness of interventions to increase gene flow, genetic monitoring is recommended, that is, collection of tissue samples from populations upstream and downstream of (former) barriers to assess temporal changes in Ne, Ar, or He (see Category II
mon-itoring described in Schwartz et al.,2007). As part of further genetic monitoring and evaluation of the need for genetic intervention in the larger streams, the application of a greater number of markers would be more powerful for early detection of genetic impacts.
Data archiving
Data available from the Dryad Digital Repository:http://dx. doi.org/10.5061/dryad.hn050.
Acknowledgements This work was supported by an Australian Research Council Linkage Grant (LP110200017) to Monash Uni-versity, Flinders University of South Australia, the University of Canberra, and University of Montana. Funding and other support was also contributed by industry partner organizations namely, Melbourne Water Corporation, ACTEW Corporation, Victorian Department of Sustainability and Environment (now Department of Environment, Land, Water and Planning) and Fisheries Victoria (now Department of Economic Development, Jobs, Transport and Resources). L.B.B. was supported by an ARC FT130101068 grant. Justin O’Mahony, Renae Ayres, Scott Raymond and Mike Nicol from the Arthur Rylah Institute assisted with the collection of tissue samples. This publication has been written with the support of the AgreenSkills+fellowship pro-gramme, which has received funding from the EU’s Seventh Frame-work Programme under grant agreement N° FP7-609398 (AgreenSkills+contract). Part of this work was carried out by using the resources of the INRA MIGALE (http://migale.jouy.inra.fr) and GENOTOUL (Toulouse Midi-Pyrénées) bioinformatics platforms and the Montpellier Bioinformatics Biodiversity platform services. RL was supported by the Agence Nationale de la Recherche (project GENO-SPACE ANR-16-CE02-0008). Thanks to Andrew Weeks and anon-ymous reviewers for useful comments on the early draft of this manuscript.
Compliance with ethical standards
Conflict of interest The authors declare that they have no conflict of interests.
Open Access This article is licensed under a Creative Commons Attribution 4.0 International License, which permits use, sharing, adaptation, distribution and reproduction in any medium or format, as long as you give appropriate credit to the original author(s) and the source, provide a link to the Creative Commons license, and indicate if changes were made. The images or other third party material in this article are included in the article’s Creative Commons license, unless indicated otherwise in a credit line to the material. If material is not included in the article’s Creative Commons license and your intended use is not permitted by statutory regulation or exceeds the permitted use, you will need to obtain permission directly from the copyright holder. To view a copy of this license, visithttp://creativecommons. org/licenses/by/4.0/.
References
Allen GR, Midgley SH, Allen M (2002) Field Guide to the Freshwater Fishes of Australia. Western Australian Museum, Perth, Australia.
Angermeier PL (1995) Ecological attributes of extinction-prone spe-cies: loss of freshwater fishes of Virginia. Conserv Biol 9:143–158.
Arias M, Atteke C, Augusto S, Bailey J, Bazaga P, Beheregaray LB, Benoit L, Blatrix R, Born C, Brito R (2013) Permanent genetic resources added to Molecular Ecology Resources Database 1 February 2013–31 March 2013. Mol Ecol Res 13:760–762. Bates D, Maechler M, Bolker B, Walker S (2015) Fitting linear
mixed-effects models using lme4. J Stat Softw 67:1–48.
Beheregaray LB, Möller LM, Schwartz TS, Chao NL, Caccone G (2004) Microsatellite markers for the cardinal tetra Para-cheirodon axelrodi, a commercially importantfish from central Amazonia. Mol Ecol Not 4:330–332.
Beneteau CL, Mandrak NE, Heath DD (2009) The effects of river barriers and range expansion of the population genetic structure and stability in Greenside Darter (Etheostoma blennioides) populations. Conserv Genet 10:477–487.
Benjamini Y, Hochberg Y (1995) Controlling the false discovery rate: a practical and powerful approach to multiple testing. Roy Stat Soc Ser B 57:289–300.
Blois JL, Williams JW, Fitzpatrick MC, Jackson ST, Ferrier S (2013) Space can substitute for time in predicting climate-change effects on biodiversity. Proc Natl Acad Sci USA 110:9374–9379. Coleman RA, Weeks AR, Hoffmann AA (2013) Balancing genetic
uniqueness and genetic variation in determining conservation and translocation strategies: a comprehensive case study of threatened dwarf galaxias, Galaxiella pusilla (Mack) (Pisces: Galaxiidae). Mol Ecol 22:1820–1835.
Cornuet JM, Luikart G (1996) Description and power analysis of two tests for detecting recent population bottlenecks from allele fre-quency data. Genetics 144:2001–2014.
Costello AB, Down TE, Pollard SM, Pacas CJ, Taylor EB (2003) The influence of history and contemporary stream hydrology on the evolution of genetic diversity within species: an examination of microsatellite DNA variation in bull trout, Salvelinus confluentus (Pisces: Salmonidae). Evolution 57:328–344.
Dehais C, Eudeline R, Berrebi P, Argillier C (2010) Microgeographic genetic isolation in chub (Cyprinidae: Squalius cephalus) popu-lation of the Durance River: estimating fragmentation by dams. Ecol Freshw Fish 19:267–278.
Do C, Waples RS, Peel D, Macbeth G, Tillett BJ, Ovenden JR (2014) NeEstimator v2: re‐implementation of software for the estimation of contemporary effective population size (Ne) from genetic data.