ELSEVIER Cardiovascular Research 30 (1995) 212-221
Gwdiovamdar
Research
Intracellular calcium transients underlying interval-force relationship
in whole rat hearts: effects of calcium antagonists
Christian E. Zaugg ap
*, Shoji Kojima a, Shao T. Wu a, Joan W&man-Coffelt
a,
William W. Parmley a, Peter T. Buser b
a Department of Medicine and Cardiovascular Research Institute, University of California San Francisco, San Francisco, CA 94143, USA b Division of Cardiology Department of Medicine, University Hospitals, Base& Switzerland
Received 9 December 1994; accepted 27 March 1995
Abstract
Objectives: Much of the understanding about the cardiac interval-force relationship of the whole heart, including mechanical restitution and postextrasystolic potentiation (PESP), has been inferred from isolated muscle studies. We tested whether results from isolated muscles about intracellular Ca2’([Ca2+li) transients underlying the interval-force relationship can be substantiated in whole hearts. Additionally, we investigated whether Ca2+ antagonists could alter [Cazcli transients underlying mechanical restitution and postextrasystolic potentiation. Methods: [Ca2+li transients were studied in isolated perfused rat hearts by surface fluorometry and Indo-1. Using computer-controlled pacing protocols, we performed restitution curves for left ventricular developed pressure and [Ca2+li (developed pressure and [Ca2+], plotted as a function of extrasystolic intervals). To quantify restitution curves, we fitted monoexponential functions to plots and analyzed their shift and slope. Then, we used Ca2+ antagonists, low extracellular Ca2+([Ca2+],) and PESP to modify restitution curves. [Ca’+], transients in isolated rat hearts were interpreted as Ca2+ released from the sarcoplasmic reticulum. Results: Interval-dependent changes in developed pressure were strongly correlated to interval-dependent changes in the amplitude of [Ca2+li transients in isolated whole rat hearts. Additionally, nifedipine and low [Ca2’], led to similar downward shifts but not to a changed slope of restitution curves for [Ca2+li. On the other hand, PESP increased the slope of restitution curves for [Ca*+],. Furthermore, the effect of PESP on developed pressure was blunted by high concentrations of Ca2+ antagonists. Conclusions: The results from isolated muscles about [Ca2+li transients underlying the interval-force relationship could be substantiated in whole hearts. Additionally, low [Ca*+], (induced by nifedipine LX low [Ca2’],) decreased the maximal Ca2+ release of the sarcoplasmic reticulum but did not change the release kinetics. On the other hand, PESP presumably accelerated Ca*+ release kinetics of the sarcoplasmic reticulum.
Keywords: Interval-force relationship; Postextrasystolic potentiation; Calcium intracelhilar concentration; Calcium antagonists; Indo-1; Surface fluorome- try; Rat heart; Calcium transients
1. Introduction
Cardiac contractile force is closely related to time inter- vals between heart beats. This interval-force relationship includes two properties of cardiac muscle, described as mechanical restitution [l] and postextrasystolic potentia- tion [2]. The first property, mechanical restitution, de- scribes the recovery of myocardial contractility during the
interval between heart beats. Mechanical restitution is
studied experimentally by the mechanical restitution curve
which represents a plot of the cardiac force as a function of increasing time intervals between heart beats. The sec- ond cardiac property, postextrasystolic potentiation, de-
scribes the force of the first contraction after a premature beat. Both of these properties have been widely studied in
various species and interval-dependent changes in the am- plitude of intracellular Ca2+ ([Ca*+],) transients were shown to be responsible for the interval-dependent changes in the force of contraction [for review, see Ref. 31. So far,
much of the understanding about the interval-force rela-
tionship of the whole heart has been inferred from isolated
muscle studies. Moreover, all studies involving measure- ments of [Ca2+li transients were performed in isolated
muscle preparations. However, certain disadvantages are re1ate.d to isolated muscle preparations. First, a fast physio- logical pacing rate can not be used in isolated muscle preparations because of potential central ischemia [4]. Sec- ond, in isolated muscles, recirculating activator Ca*+ and
* Corresponding author. M-1186, Cardiology Division, University of California San Francisco, 505 Pamassus, San Francisco, CA 94143-0124, USA. Tel.: 415-476-1710; Fax 415-476-0424.
0008-6363/95/$09,50 0 1995 Elsevier Science B.V. All rights reserved SSDIOOO8-6363(95)00020-8
C.E. Zaugg et al. / Cardiovascukzr Research 30 (1995) 212-221 213
Ca2+ entering during the action potential might contribute differently to [Ca2+li transients than in whole hearts 151. Therefore, an isolated heart would be a more nearly physi- ological preparation to study [Ca2+], transients underlying the interval-force relationship. Furthermore, measure- ments of [Ca2+li transients in an isolated rat heart primar- ily reflect sarcoplasmic reticulum function because in rat myocardium, peculiarly 90% of the [Ca2+li transients are composed of Ca2+ released from the sarcoplasmic reticu- lum [6]. Consequently, the contribution of the sarcoplasmic reticulum to restitution and postextrasystolic potentiation as well as drug effects on this contribution could be studied in isolated whole rat hearts.
The aim of the present study was to test whether the results from isolated muscle preparations about [Ca2+li transients underlying the interval-force relationship can be substantiated in whole hearts. For this purpose, we studied [Ca2+li transients in isolated perfused rat hearts by surface fluorometry and Indo-1. Using computer-controlled pacing protocols we generated restitution curves for left ventricu- lar developed pressure and, simultaneously, for [CaZfli transients. In addition, we sought to evaluate the sarcoplas- mic reticulum function involved in mechanical restitution and postextrasystolic potentiation in whole rat hearts. For this purpose, we used Ca2+ antagonists and postextrasys- tolic potentiation to modify the restitution curves. Because Cazf antagonists have been proposed to alter sarcoplasmic reticulum function [7,8], we also investigated whether such an effect could alter [Ca2+], transients underlying mechan- ical restitution and postextrasystolic potentiation. For this purpose, we compared the effects of Ca2+ antagonists and low extracellular Ca2+ ([Ca2+],) on restitution curves for [Ca2 + ]i transients.
2. Methods
2.1. Animals
Sprague-Dawley rats, weighing 450-500 g, were used in the present study. The animal use protocol was ap- proved by the Animal Research Committee of the Univer- sity of California San Francisco.
2.2. Perjicsed heart model
After ether anesthesia, hearts were excised rapidly through a midline stemotomy and perfused at 36°C within 30-60 s according to a modified Langendorff method [9-111. All hearts were perfused at a perfusion pressure of 110 cm H,O with a modified Krebs-Henseleit solution containing 117.0 mM NaCl, 4.3 mM KCl, 1.80, 1.00, or 0.55 mM CaCl,, 1.2 mM MgSO,, 25.0 mM NaHCO,, 0.25 mM NaEDTA and 15 mM glucose. Free Ca2+ con- centrations in the perfusate ([Ca’+], concentrations) were estimated to be 1.55, 0.75, and 0.30 with 1.80, 1.00, and 0.55 mM CaCl, according to the multiequilibrium calcula- tion developed by Perrin and Sayce [12]. The perfusate was saturated with a gas mixture of 95% 0, and 5% CO,.
To dissolve maximum oxygen the temperature of the perfusate was raised subsequently from 25°C to 36°C. This procedure resulted in an oxygen tension of the perfusate between 500 and 600 mm Hg and a pH of 7.4. In order to create atrioventricular block, the interatrial septum was incised through an approach via the right atria1 appendage. The incision was patched with a surgical suture to ensure accurate pressure measurement. Then, a pair of platinum pacemaker wires from a computer-controlled pulse genera- tor (Medtronic model 5320) were implanted in the left ventricular free wall and the hearts were stimulated at a steady-state frequency of 3.3 Hz (300 ms steady-state interval). A bipolar electrocardiogram (ECG) was recorded from electrodes implanted in the right atrium and the apex. 2.3. Pacing protocols
The isolated perfused rat hearts underwent two prepro- grammed pacing protocols that were consecutively gener- ated by the computer-controlled pulse generator. To obtain restitution curves (RC), the first pacing protocol introduced extrasystolic beats at different extrasystolic intervals which varied from 120 to 860 ms (120, 180, 240, 300, 360, 420, 480, 540, 600, 660, 720, and 860 ms). In the second pacing protocol, extrasystolic beats at different extrasys- tolic intervals from 120 to 860 ms (120, 180, 240, 300, 360, 420, 480, 540, 600, 660, 720, and 860 ms> were introduced after a premature beat which was triggered 120 ms after a steady-state beat. Thus, the second pacing protocol led to postextrasystolic restitution curves (PES- RC) and allowed us to investigate the effect of postex- trasystolic potentiation on restitution curves. During both pacing protocols, hearts were allowed to return to steady- state values before a new extrasystole was introduced. 2.4. Experimental protocol
All hearts underwent the two pacing protocols for resti- tution curves and postextrasystolic restitution curves re- peatedly during different perfusion conditions (all at 36°C). First, both pacing protocols were performed during control perfusion (1.55 mM [Ca2’],>. Then, they were repeated during perfusion with different concentrations of nifedip- ine, verapamil, diltiazem (1.55 mM [Ca2’],) or perfusate containing low Ca2+ (to produce low [Ca2+],). The same hearts were perfused with two different Ca2+ antagonists (on condition that the first treatment was reversible). Vera- pamil was always the final treatment. Controls were per- formed for each perfusion condition (for each of the three Ca2+ antagonists and for low [Ca2+],).
During the two pacing protocols for restitution curves and postextrasystolic restitution curves, simultaneous mea- surements of left ventricular developed pressure (LVDP) and [Ca2+], were performed under different perfusion con- ditions. Developed pressure was measured for all perfusion conditions (control, three different concentrations of all three Ca2+ antagonists and two different concentrations of low [Ca2+],). Because all three Ca2+ antagonists led to very similar responses of developed pressure during the pacing protocols, [Ca2’li was measured only for three
214 C.E. Zaugg et al. /Cardiovascular Research 30 (1995) 212-221
selected perfusion conditions (control, 1.00 PM nifedipine 2.7. Limitation and evaluation of [Ca’ ‘Ii measurement by
and 0.30 mM [Ca2f],). surface fluorometry and Indo-l
2.5. Measurements of left ventricular pressure
A 500 ~1 thin latex balloon was inserted into the left ventricle through the left atrium. Left ventricular devel- oped pressure (difference in systolic and diastolic values) was measured by a plastic tube located inside the balloon, sutured at the proximal end of the balloon, and connected to a Statham P23 Db pressure transducer (Gould, Cleve- land, OH). The volume of the saline-filled balloon was adjusted with a calibrated microsyringe through a three-way stopcock contained in this plastic tube to establish a con- stant physiological end-diastolic pressure in the range of 5-10 mm Hg. Thus, the left ventricle contracted isovolu- mically throughout the experiment.
2.6. Measurements of [Ca’ ‘Ii by surface jIuorometry and Indo-l
Fluorescence excitation was provided by ultraviolet light from a 100 W mercury vapor lamp. The ultraviolet light was directed through a 365 f 10 nm discriminating filter and a custom-made silica fiberoptic cable, designed to assess excitation and emission simultaneously on a 38.5 mm2 circular area of the cardiac surface [9-111. The emitted fluorescence was sensed by a co-axial cable of 300 quartz fiberoptics, divided by a beam splitter, and then filtered at 400 f 5 and 510 + 12.5 nm before reaching the photomultiplier tubes. Photomultiplier output at 400 and 510 nm and its ratio F4OO/F510, an index of [Ca2+li, were recorded on a 6-channel dynograph (Gould, Cleve- land, OH) simultaneously with the left ventricular pressure and the ECG. To place the fiberoptic on the interventricu- lar septum, the tip of the fiberoptic was inserted through a circular cut in the right ventricular free wall and fixed firmly on the right ventricular side of the interventricular septum. This approach of the fiberoptic through a hole in the right ventricular wall does not interfere with left ventricular or septal perfusion because the right ventricular coronary artery does not supply the left ventricular wall or the interventricular septum in rat hearts [13]. Firm contact between the optic fiber and cardiac surface was required to obtain a reliable signal. Because forceful compression by the fiberoptic could cause changes in the shape of the left ventricle and alterations in myocardial perfusion, the placement of the fiberoptic was confirmed not to change developed pressure more than 5% of the control value.
Some limitations and their consequences on the evalua- tion of the surface fluorometry technique with Indo-l have to be cited. A possible limitation includes sequestration of Indo-l in mitochondria potentially leading to interferences of mitochondrial with cytosolic fluorescence. However, transition of cytosolic Ca*+ to mitochondria is slow and it was demonstrated that mitochondrial Ca*+ showed no transient [16]. For these reasons, F4OO/F510 transients are considered to reflect cytosolic phenomena. Yet, sequestra- tion of Indo-l in mitochondria potentially provokes a spatial heterogeneity of fluorescence [16,17] and therefore makes it less accurate to estimate the cytosolic Ca*+ levels from F400/F510. Moreover, evaluation of peak cytosolic Ca*+ as a regulator of cardiac function in isolated hearts may be perturbed by both changes of the threshold for cross-bridge interaction due to altered Ca*+ sensitivity of the sarcoplasmic reticulum [18] or changes of the Ca2+- force relationship due to myocardial stretch [19]. There- fore, we expressed [Ca*+ Ii as percentages of the control amplitude of F4OO/F510 instead of estimating a cytosolic Ca*+ concentration. Accordingly, the amplitude of [Ca2+li transients has been used in numerous studies to evaluate [Ca2+:li transients as the important modulator of left ven- tricular developed pressure (and oxygen consumption) in isolated whole hearts [9-11,20-251. In particular, the am- plitude of F4OO/F510 has recently been used to describe [Ca*+ li transients mediating postextrasystolic potentiation after multiple extrasystolic beats in isolated perfused rat hearts [4].
The fluorometer was offset for autofluoroscence (400 and 510 nm) of the heart [14]. Then, the hearts were loaded with the cell-permeable fluorescent dye Indo-l acetoxymethylester by perfusion for 60 min. This perfusate consisted of 16 mg of Indo-l acetoxymethylester dissolved in 1 ml of dimethylsulfoxide and 600 ml of Krebs-Henseleit containing 5% calf serum. Indo-l loading was facilitated by perfusion at 30°C [15] and was followed by 30 min washout at 36°C. This procedure of Indo-l loading led to fluorescence readouts of approximately 1 V at both 400 nm and 510 nm (autofluorescence approximately 0.08 V).
Another possible limitation arises from reduced fluores- cence by time-dependent ultraviolet bleaching and Indo-l leakage during the experiment. At the end of the experi- ments, the fluorescence at 400 and 510 nm was reduced by lo-15%. However, reduced fluorescence does not influ- ence the ratio of fluorescence (F400/F510) and estimation of [Ca2+li [26]. Yet, reduced fluorescence could be of importance because of variation of autofluorescence be- tween hearts or because of changes of autofluorescence over the experimental period. Such changes could possibly alter the ratio of Indo-l fluorescence to autofluorescence [27]. However, after attenuation, the range of autofluores- cence variation between hearts (less than 0.01 V) and the change of autofluorescence over the experimental period (approx. 0.01 V) is negligible in our experiments. Another limitation could be caused by fluorescence from the en- dothelium or the vasculature. However, the contribution of the endothelium and vasculature to Indo-l fluorescence was shown to be almost negligible in this preparation, as evaluated by bradykinin administration [18]. Finally, inter- ference with the Indo-l signals with cardiac motion are absent since hearts subjected to zero flow &hernia showed similar fluorescence transients, followed by a gradual in- crease, despite contractile cessation [ 141.
2.8. Curve-fitting procedure and characterization of resti- tution curves
The mean amplitude of [Ca2+li transients (difference in systolic and diastolic values of F4OO/F510) and mean left
C.E. Zaugg et al./ Cardiovascular Research 30 (1995) 212-221 215
ventricular developed pressure of extrasystolic beats were plotted as a function of extrasystolic intervals leading to restitution curves and postextrasystolic restitution curves for [Ca2+ 1, and developed pressure, These curves were described by a monoexponential function [28-301 using a fitting procedure according to a non-linear least-square method. The mathematical equation (1) for the monoexpo- nential function may be written:
postextrasystolic restitution curves were characterized and statistically analyzed by two variables: maximal values of fitted curves at the 860 ms interval (F400/F510,,, and L~%lax respectively) and time to reach 75% of these maximal values (75%-time). 75%-times were used to de- scribe the slope and thus, time course of curves.
2.9. Evaiuation and statistical analysis
y = A(1 - e-‘lT)
(1)
Because of the resting spontaneous activity of rat hearts with atrioventricular block, the pacing protocols could not be performed at longer intervals than 860 ms. Thus, asymptote and time constant r of Eqn. (1) could only be estimated. In a more precise way, restitution curves and
To determine whether interval-dependent changes of left ventricular developed pressure and interval-dependent changes of the amplitude of [Ca2+li transients are corre- lated in isolated whole rat hearts, restitution curves for developed pressure and [Ca2+li were linearized and tested for correlation by linear regression. For this purpose, LVDP
RC
1
.OO
FM Nifedipine
ECG
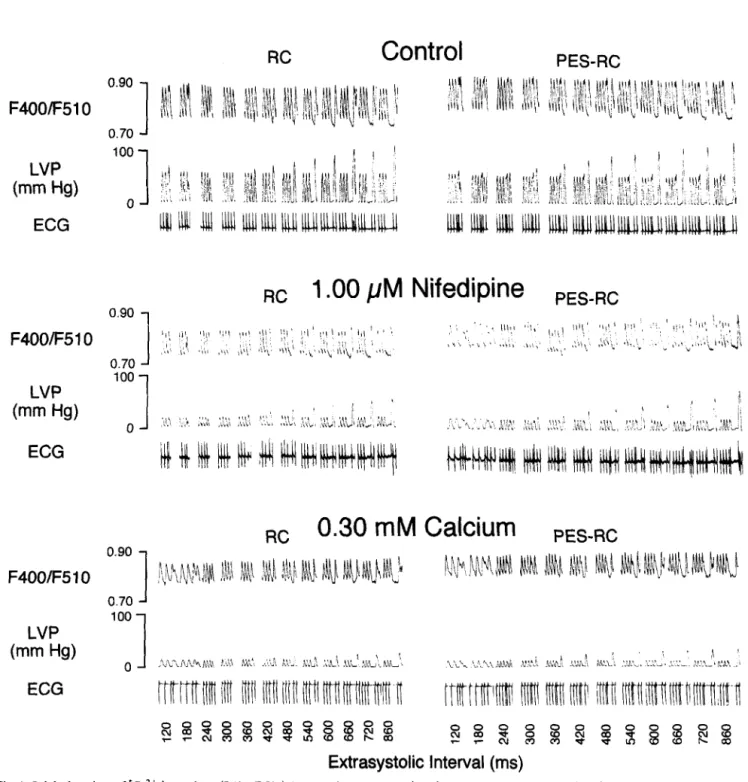
Fig. 1. Original tracings of [Ca2+ Ii transients (F4OO/F510), left ventricular pressure (LVP) and the electrocardiogram (ECG) of isolated perfused rat hearts during pacing protocols for restitution curves CRC) and postextrasystolic restitution curves (PES-RC). Three-panel set for control (1.55 mh4 [Ca2+ I,), 1.00 FM nifedipine (1.55 mM [Ca” I,) and 0.30 mM [Ca2+ I,.
216 C.E. Zaugg et al. / Cardiovascular Research 30 (1995) 212-221 l Control 150- d 1 .OO pM Niiedipine 0 0.30 mM Calcium PES-RC O- I 0 ZOO 400 604 600 0 200 400 600 600 Extrasystolic Interval (ms)
Fig. 2. Restitution curves (RC) and postextrasystolic restitution curves (PES-RC) for [Ca*+ Ii (amplitude of F4OO/F510) of isolated perfused rat hearts during control (1.55 mM [Ca*+ I,), 1.00 PM nifedipine (1.55 mM [Ca*+ I,), and 0.30 mM [Ca*+ I,. Horizontal dashed line shows steady-state amplitude of F4OO/FSlO. Vertical dashed lines show steady-state interval between beats (300 ms). Values are mean f s.e.m.; II = 7 hearts.
and simultaneously measured amplitudes of F400/F510 were linearized according Eqns. (2) and (3) respectively.
(2)
x= -In l-
i
F400/F510
F4OO/F510,,, (3)
Then, linearized values of LVDP were plotted against linearized amplitudes of F4OO/F510 for corresponding extrasystolic intervals. Finally, linear regression was ap- plied to this plot and the resulting correlation coefficient was used to quantify the strength of the relation between LVDP and the amplitude of F400/F510. Because of the sigmoid relationship between developed pressure and am- plitudes of F4OO/F510 [lo], direct comparisons of the 75%-times of pressure and F4OO/F510 were not per- formed.
To determine whether Ca2+ antagonists or low [Ca2’],
change restitution curves and, if so, whether these changes are similar or not, statistical analysis between restitution curves during control perfusion and different concentra- tions of one Ca2+ antagonist or of low [Ca2+], were performed by repeated measures ANOVA with the Bonfer- roni t-test.
To determine whether postextrasystolic potentiation changes the restitution curves and, if so, whether these changes can be affected by Ca2+ antagonists or low [Ca’+ I,, statistical analysis between restitution curves and postextrasystolic restitution curves was performed by paired C-test.
To test for differences between the controls for each perfusion condition (nifedipine, verapamil, diltiazem and low [Ca2’],) one-way ANOVA with the Bonferroni t-test was performed.
All results are expressed as mean +s.e.m. For all statistical analysis, P-values of 0.05 or less were consid- ered significant. 200 1 . Cantn 200 l Control o 0.01 jA4 Nitedipine Nifedipine 200- . Control Low Calcium 0 0.75 mM Calcium S l5o _ 0 0.30 mM Calcium I E loo- B 50- . . . . . 3 0 200 400 600 800 0 200 400 600 600 Extrasystolic Interval (ms)
Fig. 3. Restitution curves (RC) and postextrasystolic restitution curves (PES-RC) for left ventricular developed pressure (LVDP) of isolated perfused rat hearts during control (1.55 mM [Ca*+ I,), nifedipine (1.55 mM [Ca*+ I,), and low [Ca*+ I,. Horizontal dashed lines show steady-state LVLIP. Vertical dashed lines show steady-state interval between beats (300 ms). Values are mean +s.e.m.; n numbers see Table 2.
C.E. Zaugg et al. /Cardiovascular Research 30 (1995) 212-221 211
3. Results
3.1. Restitution curves
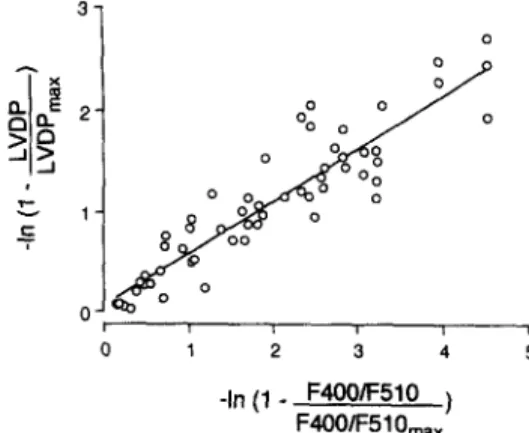
During control perfusion, the pacing protocol for resti- tution curves led to similar responses of left ventricular developed pressure and amplitudes of [Ca2+li measured by surface fluorometry and Indo-l in isolated whole rat hearts (original tracings in Fig. 1). Restitution curves for both [Ca2+li, assessed by amplitudes of F400/F510 (Fig. 2 left panel), and developed pressure (Fig. 3 controls of left panels) followed a very similar monoexponential pattern. Linearized plotting of developed pressure against ampli- tudes of F400/F510 and linear regression provided a strong correlation between these two variables (Fig. 4; r = 0.92; P < 0.01). The controls for each perfusion condi- tion (nifedipine, verapamil, diltiazem and low [Ca2’],) did not differ from each other among steady-state LVDP (P = 0.92) and among the two characteristic variables for resti- tution curves, LVDP,,, (P = 0.54) and 75%-time of LVDP (P = 0.33).
-In (1 - F4OOIF510 ) F4OO/F51 O,,
Fig. 4. Relation of linearized left ventricular developed pressure (LVDP) and linearized amplitudes of F4OO/F510 (simultaneously measured) for corresponding extrasystolic intervals in isolated perfused rat hearts. The continuous line was fitted to the data by linear regression. Slope = 0.52; x-axis intercept = - 0.12; correlation coefficient r = 0.92 (P < 0.01).
were shifted downward as during nifedipine in a very similar concentration-dependent manner. The characteristic restitution variables were similarly affected by verapamil and diltiazem (Table 2).
3.2. Effects of Ca2 + antagonists and low [Ca”], on restitution curves
During perfusion with 1.00 PM nifedipine, the restitu- tion curve for [Ca2+li was shifted downward (Fig. 2 left panel; original tracings in Fig. 1). This downward shift was expressed by decreased F400/F510,,, (Table 1). However, the slope of the restitution curve for [Ca2+li was not changed during 1.00 PM nifedipine. Specifically, the 75%-time of F400/F510 was not significantly changed by 1.00 PM nifedipine (P = 0.91 vs. control). On the other hand, the restitution curve for pressure was not only shifted downward by 1.00 PM nifedipine but had a re- duced slope (Fig. 3, left top panel). Specifically, LVDP,,, was decreased by half and the 75%-time of LVDP was prolonged by 289 ms (Table 2). During perfusion with a lower nifedipine concentration (0.10 PM), LVDP,,, was less decreased and the 75%-time was less prolonged. Thus, restitution curves for pressure were shifted downward by nifedipine in a concentration-dependent manner (Fig. 3 left top panel). During perfusion with the lowest nifedipine concentration (0.01 I.LM), the restitution curve for pressure was not affected, expressed by unchanged restitution vari- ables, LVDP,,,,, (P = 0.26 vs. control) and 75%-time (P
= 0.45 vs. control).
During 0.30 mM [Ca2+],, the restitution curve for [Ca2+li was shifted downward as during 1.00 PM nifedip- ine (Fig. 2, left panel; original tracings in Fig. 1, left bottom panel). This downward shift was expressed by decreased F400/F510,,, (Table 1). However, the slope of the restitution curve for [Ca2+li was not changed during 0.30 mM [Ca2’],. Specifically, the 75%-time was not changed by 0.30 mM [Ca2+l, (P = 0.40 vs control; P = 0.42 vs. 1.00 PM nifedipine). On the other hand, the restitution curve for pressure was not only shifted down- ward by 0.30 mM [Ca’+ I, but had a reduced slope (Fig. 3, left bottom panel). Specifically, LVDP,,, was decreased by half and the 75%-time was prolonged by 187 ms (Table 2). During a higher [Ca2+], concentration (0.75 mM), LVDP,,, was less decreased and the 75%-time less pro- longed as during a lower concentration of nifedipine (0.10 PM). Thus, restitution curves for pressure were shifted downward depending on the [Ca2+ I, concentration. 3.3. Postextrasystolic restitution curves
During perfusion with the two other Ca2+ antagonists, verapamil and diltiazem, restitution curves for pressure
During control perfusion, the slope of the postextrasys- tolic restitution curve for [Ca2+li was greater than the corresponding restitution curve (Fig. 2, right panel; origi- nal tracings in Fig. 1). Specifically, the 75%-time of the postextrasystolic restitution curve for [Ca2+ Ii was 49 ms shorter than the 75%-time of the corresponding restitution
Table 1
Effects of nifedipine and low calcium perfusion on characteristic restitution variables of intracellular calcium in isolated perfused rat hearts
Thearts) F4OO/F510,, (o/o) F4OO/FSlO,,, (%) 75%-time (ms) RC PES-RC RC PES-RC Control 1.00 PM Nifedipine 0.30 mM Calcium I lOOf 134f7 130&-g 304 + 23 255+ 9+ 7 68f4 86i-7 ’ 86*7 l 306*11 268flS + 7 60*5 81*6 * 87*7 * 322 i 17 291*15 +
Values are mean fs.e.m. F400/FS10ss, steady state amplitude of F4OO/F510 (an index of intracelhdar calcium); F4OO/FSlO,,, = maximal amplitude of F4OO/F510 of monoexponentially fitted restitution curves; 75%-time = time to reach 75% of F4OO/F510,,,; RC = restitution curve; PES-RC = postextrasystolic restitution curve; * P < 0.05 vs. control of corresponding group; ’ P s 0.05 vs. corresponding value of RC.
218 C.E. Zaugg et al. /Cardiovascular Research 30 (1995) 212-221
100
1
A 1 .oO PM Medipine (PES-RC)
. 0.30 mt.4 Calcium (PES-RC) A 100 PM Niiedipine (RC) 0 0.30 mM Calcium (RC) - 0 50 loo Amplitude of F4OO/F510 (%)
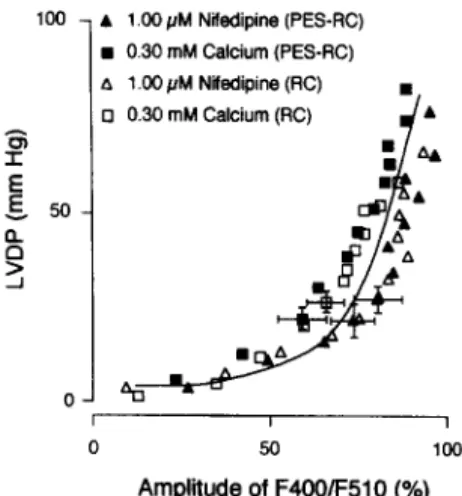
Fig. 5. Relationship between mean left ventricular developed pressure (LVDP) and mean amplitudes of F4OO/FSlO for corresponding extrasys- tolic intervals in isolated perfused rat hearts during 1.00 PM nifedipine and 0.30 mM [Ca’+ 1, for restitution curves CRC) and postextrasystolic restitution curves (PES-RC). Representative SEM for some data are shown (for complete information of variability, see Figs. 2 and 3). The relationship was fitted to the initial part of a single sigmoid curve according to a modified Hill equation [lo].
curve (Table 1). However, the plateau of the postextrasys- tolic restitution curve for [Ca’+ Ii was not shifted, as seen by unchanged F4OO/F510,,, (P = 0.30 vs. RC). On the other hand, the postextrasystolic restitution curve for left ventricular pressure was not only steeper than the corre- sponding restitution curve but also shifted upward (Fig. 3 controls of right panels). The 75%-time of the postex- trasystolic restitution curve for pressure was about 100 ms shorter than the 75%-time of the restitution curve (Table 2). LVDP,,, was about 7 mmHg higher for the postex- trasystolic restitution curve than for the restitution curve. The controls for each perfusion condition (nifedipine, vera- pamil, diltiazem and low [Ca’+],) did not differ from each other among the two characteristic variables for postex-
trasystolic restitution curves, LVDP,,,,, (P = 0.39) and 75%-time of LVDP (P = 0.11).
During perfusion with 1.00 ,uM nifedipine, the greater slope of the postextrasystolic restitution curve for [Ca2+li was preserved (Fig. 3, right panel). Specifically, the 75%- time of the postextrasystolic restitution curve for [Ca2+li was 38 ms shorter than the 75%-time of the corresponding restitution curve during 1.00 PM nifedipine. However, the plateau of the postextrasystolic restitution curve for [Ca2+li was not shifted, as seen by unchanged F400/F510,,, (P = 0.95 vs. RC). In addition, the increased slope of the postextrasystolic restitution curves for left ventricular pres- sure was abolished. This abolishment was expressed by very similar 75%-times of postextrasystolic restitution curves and restitution curves for pressure during 1.00 PM nifedipine (P = 0.49 vs. RC). Nevertheless, the upward shift of the postextrasystolic restitution curve for pressure was preserved during all nifedipine concentrations ex- pressed by higher LVDP,,, values of postextrasystolic restitution curves than those of restitution curves. During perfusion with a lower nifedipine concentration (0.10 PM), the slope of the postextrasystolic restitution curve for pressure was blunted but still greater than the slope of the corresponding restitution curve. Specifically, the 75%-time of the postextrasystolic restitution curve for pressure was still 48 ms shorter than the 75%-time of the corresponding restitution curve. Thus, the greater slope of the postex- trasystolic restitution curve for pressure was blunted by nifedipine in a concentration-dependent manner. During the lowest nifedipine concentration (0.01 PM), the slope and the shift of the postextrasystolic restitution curve for pressure did not differ from control (75%-time of LVDP P = 0.89 vs. control; LVDP,,, P = 0.11 vs. control).
During perfusion with the two other Ca*+ antagonists, verapamil and diltiazem, effects paralleled those of nifedipine (Table 2). Thus, the greater slope of the postex-
Table 2
Effects of calcium antagonists and low calcium perfusion on characteristic restitution variables of left ventricular developed pressure in isolated perfused rat hearts
n LWPSS LVDP,,, (mmHg) 75%-time (ms)
(hearts) (mmHgl RC PES-RC RC PES-RC
Control 5 78klS 123 f 15 129+17 + 372*31 277+20+ 0.01 PM Nifedipine 5 72k16 117* 17 123i-20 + 381*39 279k-25 + 0.10 PM Nifedipine 5 48*14 103*16 110&19+ 431+ 42 383*40 *+ 1.00 @M Nifedipine 4 19% 4 66*11* 78*15 *+ 661*10 * 654+13 * Control 6 73+17 125 f 20 130+20 + 423 + 26 303+13 + 0.01 /AM Verapamil 6 67k27 111+19 123+21+ 411+16 301+ 18 + 0.10 PM Verapamil 6 39*13 82klS * 92k19 *+ 496k30 * 411+39 *+ 1.00 PM Verapamil 6 12+ 2 31+ 6* 39* 8 *+ 589k34 * 589*68 * Control 5 87+10 151* 9 164* 9+ 433 f 10 33Ok 16 + 0.1 PM Diltiazem 5 851klO 148!c 5 155* 9+ 430 f 13 324+26 + 1.0 PM Diltiaxem 5 64kl7 129klO * 144* 8 *+ 511+13 * 416+26 ‘+ 10.0 PM Diltiaxem 4 22* 6 71+ 5’ 76k 6 *+ 657& 7 * 653f 8 * Control 6 8OjI13 127 f 10 133*13 + 409 + 20 286fll+ 0.75 mM Calcium 5 52k19 98+ 7’ 117*11 l + 486*22 * 311*16+ 0.30 mM Calcium 5 20* 8 59* 4’ 83Yk 7 *+ 596k16 * 583+22 *
Values are mean f s.e.m. LVDP, = steady state left ventricular developed pressure; LVDP,,, = maximal left ventricular developed pressure of monoexponentially fitted restitution curves; 75%-time = time to reach 75% of LVDP,,,; RC = restitution curve; PES-RC = postextrasystolic restitution curve; * P I 0.05 vs. control of corresponding group; ‘P I 0.05 vs. corresponding value of RC.
C.E. Zaugg et al. /Cardiovascular Research 30 (1995) 212-221 219
trasystolic restitution curve for pressure was blunted by all Ca2+ antagonists in a concentration-dependent manner. Furthermore, the upward-shift of the postextrasystolic restitution curve for pressure was preserved during all Ca2+ antagonists in all concentrations.
During 0.30 mM [Ca2+10, effects paralleled those of 1.00 PM nifedipine. The greater slope of the postextrasys- tolic restitution curve for [Ca2+li was preserved during 0.30 mM [Ca2’], (Fig. 2, right panel). Specifically, the 75%-time of the postextrasystolic restitution curve for [Ca2+li was 31 ms shorter than the 7.5%-time of the corresponding restitution curve. However, the plateau of the postextrasystolic restitution curve for [Ca2+li was not shifted, as seen by unchanged F400/F510,,, (P = 0.12 vs. RC). In addition, the increased slope of the postex- trasystolic restitution curves for left ventricular pressure was abolished (Fig. 3 right bottom panel). This abolish- ment was expressed by very similar 75%-times of postex- trasystolic restitution and restitution curves for pressure during 0.30 mM [Ca2+], (P = 0.41 vs. RC). Nevertheless, the upward shift of the postextrasystolic restitution curve for pressure was preserved during 0.30 and 0.75 mM [Ca2’],. This upward shift was expressed by the higher LvJ%ax of postextrasystolic restitution curves than L-%la, of restitution curves.
4. Discussion
In the present study, we demonstrate for the first time that the results from isolated muscle preparations about [Ca2+ Ii transients underlying the interval-force relation- ship can be substantiated in whole hearts. Specifically, we found in isolated perfused rat hearts that restitution curves for both left ventricular developed pressure and amplitudes of [Ca2+li transients, measured by surface fluorometry and Indo-1, followed similar monoexponential functions. Moreover, linearized plotting of left ventricular developed pressure against the amplitude of F4OO/F510 (an index of [Ca2+li showed a strong correlation between these two variables (Fig. 4). Thus, interval-dependent changes in left ventricular developed pressure are strongly correlated to interval-dependent changes in the amplitude of [Ca2+ Ii transients in isolated whole rat hearts. This finding is consistent with observations in ferret papillary muscles where interval-dependent changes in contractility were mo- noexponentially described and linearly correlated with esti- mated peak concentrations of [Ca2+], assessed by a similar technique with the Ca2+ -sensitive photoprotein, aequorin [29l.
To discuss our findings in whole rat hearts, we inter- preted [Ca2+li transients as Ca2+ released from the sar- coplasmic reticulum as it has been done in isolated muscle studies [28,29] and other studies in isolated rat hearts [4,11]. The reason for this interpretation is that 90% of the [Ca2+li transients is composed of Ca2+ released from the sarcoplasmic reticulum [6]. Moreover, in rat myocardium, peculiarly most of the activator Ca2+ circulates between the sarcoplasmic reticulum and myofilaments [31]. In the isolated whole rat heart, we consequently assumed that the interval-dependent Ca2+ release from the sarcoplasmic
reticulum caused the interval-dependent changes in the amplitude of [Ca2+li transients and, thus, caused the inter- val-dependent changes in developed pressure.
Based on this interpretation, we evaluated the effects of Ca2+ antagonists, low [Ca” 1, and postextrasystolic poten- tiation on restitution curves for [Ca2+li as effects on interval-dependent Ca2+ release from the sarcoplasmic reticulum. The Ca2+ antagonist nifedipine and low [Ca2+ I, both led to similar downward shifts but not to a changed slope of the restitution curve for [Ca2+li, in the present study. Specifically, both 1.00 PM nifedipine and 0.30 mM [Ca*+], decreased F4OO/F510,,, but did not change the 75%-time of the restitution curves for [Ca2+li. Thus, low [Ca2+Ii (induced by nifedipine or low [Ca2+],) decreased the maximal Ca2+ release of the sarcoplasmic reticulum but did not essentially change the Ca2+ release kinetics. This interpretation is consistent with the view that the plateau of the restitution curve is determined by the amount of Ca2+ accumulated in the sarcoplasmic reticulum during the preceding [Ca2+li transient and the amount of Ca2+ that remained in the sarcoplasmic reticulum during the preceding Ca2+ release [29]. Moreover, it has been pro- posed that the time course of the restitution curve is determined by the property of the sarcoplasmic reticulum that Ca2+ taken up is only gradually available for release in the interval between beats [29]. The cause of this gradual availability might be Ca2+ diffusion within the sarcoplasmic reticulum from an “uptake compartment” to a “release compartment” or more likely the recovery from inactivation of the sarcoplasmic reticulum Ca*+ release [3]. However, we suggest that different [Ca2+li concentra- tions do not affect this gradual Ca2+ availability since both Ca2+ antagonists and low [Ca2+], did not change the slope of the restitution curve for [Ca2+], in the present study.
On the other hand, it may be that postextrasystolic potentiation increased the gradual Ca2+ availability of the sarcoplasmic reticulum since postextrasystolic potentiation increased the slope of the restitution curve for [Ca2+li. Specifically, the 75%-time of the postextrasystolic restitu- tion curve for [Ca2+li was 49 ms shorter than the corre- sponding 75%-time of the restitution curve (Table 1). Postextrasystolic potentiation has been proposed to depend on additional Ca2+ uptake of the sarcoplasmic reticulum by transmembrane entry of [Ca2’], during a premature beat [3,28,29,32,33]. However, different [Ca2+li concentra- tions were found not to change the Ca2+ release kinetics of the sarcoplasmic reticulum in the present study. There- fore, we speculate that a premature beat accelerated the Ca2+ release kinetics of the sarcoplasmic reticulum, maybe by a greater shift of Ca2+ inside the sarcoplasmic reticu- lum from uptake to release sites as proposed [34,35], or a faster recovery from inactivation of the sarcoplasmic retic- ulum Ca2+ release. In addition, it seemed that postex- trasystolic potentiation increased the Ca2’ availability of the sarcoplasmic reticulum mainly for short extrasystolic intervals after a premature beat. The reason for this sugges- tion is that postextrasystolic potentiation increased the slope but did not shift the plateau of the restitution curve for [Ca2+li (expressed as unchanged F400/F510,,,). One discrepancy is that postextrasystolic potentiation did not
220 C.E. Zaugg et al. /Cardiovascular Research’ 30 (1995) 212-221
shift F4OO/F510,,, but did shift LVDP,,,. It may be that, after long extrasystolic intervals and especially during control conditions, high [Ca2+li concentrations of postex- trasystolic potentiated beats were slightly underestimated by F400/FSlO because of the non-linear relationship be- tween F4OO/F510 and true [Ca*+& at high [Ca*+l, con- centrations [14,15-J. Alternatively, it may be that monoex- ponential curve fitting in this study was not accurate enough to describe actual restitution, which is the sum of several exponential functions if very long extrasystolic intervals are included [30].
Although Ca*+ antagonists have been proposed to alter sarcoplasmic reticulum function [7,8], the effects of nifedipine on the restitution curve and the postextrasystolic restitution curve for [Ca*+& did not differ from those of low [Ca*+], (Table 1 and Fig. 2). Thus, nifedipine had no effect on the sarcoplasmic reticulum which would have altered [Ca*+ Ii transients underlying mechanical restitution and postextrasystolic potentiation in the isolated rat heart.
Unexpectedly and in contrast to the restitution curve for [Ca2+li, the restitution curve for pressure was not only shifted downward but also less steep during high concen- trations of Ca*+ antagonists (nifedipine, verapamil and diltiazem) and 0.30 mM [Ca*+], (Fig. 3). An explanation for this decreased slope of the restitution curve for pres- sure may be the sigmoid nature of the relationship between developed pressure and amplitudes of F400/F510 de- scribed by a modified Hill equation [lo]. During high concentrations of nifedipine and during 0.30 mM [Ca*+],, amplitudes of F400/F510 after short extrasystolic inter- vals fell mainly in the initial range (below 60%) of the sigmoid relationship between developed pressure and the amplitudes of F400/F510 (Fig. 5). In this range, changes in amplitudes of F400/F510 lead only to minimal changes in developed pressure. Consequently, the slope of the restitution curves for pressure was decreased although the slope of the restitution curves for [Ca2+li was preserved during high concentrations of Ca*+ antagonists and low [Ca*+ I,. Similarly, the increased slope of the postextrasys- tolic restitution curve for pressure was blunted by high concentrations of Ca* + antagonists and by very low [Ca*+],. Evidence for this finding arises from the compari- son of the 75%-time of the postextrasystolic restitution curves for [Ca*+ Ii and pressure with the corresponding variables of the restitution curves (Tables 1 and 2). As discussed above for restitution curves during low [Ca*+&, the pressure response can be explained by the sigmoid nature of the relationship between developed pressure and the amplitude of F4OO/F510. Although amplitudes of F400/F510 were increased by postextrasystolic potentia- tion after short extrasystolic intervals, they still fell mainly in the initial range (below 60%) of the sigmoid curve of the relationship between developed pressure and ampli- tudes of F400/F510 (Fig. 5). In this range, changes in amplitudes of F4OO/F510 lead only to minimal changes in pressure. Consequently, the slope of the postextrasystolic restitution curves for pressure was decreased although the slope of the postextrasystolic restitution curves for [Ca*+ Ii was preserved during high concentrations of Ca*+ antago- nists and low [Ca*+],. It appears from Fig. 5 that nifedip- ine slightly shifted the Ca*+ -pressure relationship to the
right, suggesting a reduced responsiveness of the myofila- ments to Ca*+. However, the comparison of the [Ca*+]i transients for similar values of developed pressure revealed no significant difference (P = 0.18, ANOVA) among hearts treated with nifedipine or low [Ca*+ I,.
In ‘conclusion, in this study we demonstrate that the results from isolated muscle preparations about [Ca*+ Ii transients underlying the interval-force relationship can be substantiated in whole hearts. According to previous obser- vations in ferret papillary muscles [29], we found in iso- lated perfused rat hearts that interval-dependent changes in the amplitude of [Ca2+li transients were strongly corre- lated to interval-dependent changes in left ventricular de- veloped pressure. [Ca*+& transients in isolated rat hearts could be interpreted as Ca*+ released from the sarcoplas- mic reticulum. In our experiments in whole rat hearts, we additionally found that both nifedipine or low [Ca*+ 1, led to similar downward shifts but not to a changed slope of the restitution curve for [Ca2+li. Thus, low [Ca2+li (in- duced by nifedipine or low [Ca*+],) decreased the maxi- mal Ca*+ release of the sarcoplasmic reticulum but did not change the Ca*+ release kinetics. On the other hand, we found that postextrasystolic potentiation increased the slope of the restitution curve for [Ca2+li. Thus, postextrasystolic potentiation presumably accelerated Ca*+ release kinetics of the sarcoplasmic reticulum. Furthermore, nifedipine ap- peared to have no effect on the sarcoplasmic reticulum which would have altered [Ca2+li transients underlying mechanical restitution and postextrasystolic potentiation in the isolated rat heart. However, the effect of postextrasys- tolic potentiation on pressure was blunted by high concen- trations of Ca*+ antagonists and very low [Ca*‘l,.
Acknowledgment
Christian E. Zaugg was supported by the Swiss Na- tional Science Foundation. Peter T. Buser was supported by a career development grant (SCORE) from the Swiss National Science Foundation. This study was supported in part by the George D. Smith Fund.
References
[I] Braveny P, Kruta V. Dissociation de deux facteurs: restitution et potentiation dam l’action de l’amplitude de la contraction du myo- carde. Arch Int Physiol Biochem 1958;66:633-652.
[2] Hoffman BF, Bindler E, Suckling EE. Postextrasystolic potentiation of contraction in cardiac muscle. Am J Physiol 1956;185:95-102. [3] Bers DM. Excitation-contraction coupling and cardiac contractile
force. Dordrecht: Kluwers Academic Press, 1991;155-170. [4] Kojima S, Wu ST, Wikman-Coffelt J, Parmley WW. Intracellular
calcium transients in potentiated contractions induced by multiple extrasystolic beats in isolated perfused rat hearts. Cell Calcium 1994;16:219-226.
[5] Wohlfart B, Elzinga G. Electrical and mechanical responses of the intact rabbit heart in relation to the excitation interval. A comparison with the isolated papillary muscle preparation. Acta Physiol Stand 1982;115:331-340.
[6] Wier WG. Cytosolic [Ca*+ ] in mammalian ventricle: dynamic control by cellular process. Annu Rev Physiol 1990;52:467-485. [7] Bayer R, Hennekes R, Kaufmann R, Mannhold R. Inotropic and
C.E. Zaugg et al. /Cardiovascular Research 30 (1995) 212-221 221
myocardium. I. Pattern of inotropic effects of the racemic com- pounds. Naunyn Schmiedebergs Arch Pharmacol 1975;290:49-68. [8] Zucchi R, Limbruno U, Ronca-Testoni S, Yu G, Galbani P, Ronca
G, Effects of verapamil, gallopamil, diltiazem and nifedipine on sarcoplasmic reticulum function in rat heart. Cardioscience 1992;3:167-172.
[9] WikmanCoffelt J, Stefenelli T, Wu ST, Parmley WW, Jasmin G. [Ca’* Ii transients in the cardiomyopathic hamster heart. Circ Res 1991;68:45-51.
[lo] Kojima S, Wu ST, W&man-Coffelt J, Parmley WW. Acute effects of ethanol on cardiac function and intracellular calcium in perfused rat heart. Cardiovasc Res 1993;27:811-816.
[ll] Kojima S, Wikman-Coffelt J, Wu ST, Parmley WW. Nature of intracellular calcium transients during ventricular fibrillation and quinidine treatment in perfused rat hearts. Am J Physiol 1994;266:H1473-H1484.
[12] Perrin DD, Sayce IG. Computer calculation of equilibrium concen- tration in mixtures of metal ions and complexing species. Talanta 1967;14:833-842.
(131 Halpern MH. The dual blood supply of the rat heart. Am J Anat 1957;101:1-16.
1141 Wagner S, Wu ST, Pannley WW, Wikman-Coffelt J. Influence of ischemia on [Ca’+ Ii transients following drug therapy in hearts from aortic constricted rats. Cell Calcium 1990;11:431-444.
[lS] W&man-Coffelt J, Wu ST, Pannley WW, Mason DT. Angiotensin II and phorbol esters depress cardiac performance and decrease diastolic and systolic [Ca’+ Ii in isolated perfused rat hearts. Am Heart J 1991;122:786-794.
[16] Miyata H, Silverman HS, Sollott SJ, Lakatta EG, Stem MD, Hans- ford RG. Measurement of mitochondrial free Ca*+ concentration in living single rat cardiac myocytes. Am J Physiol 1991;261:H1123- H1134.
[17] Williford DJ, Sharma VK, Korth M, Sheu SS. Spatial heterogeneity of intracellular Ca2+ concentration in nonbeating guinea pig ventric- ular myocytes. Circ Res 1990,66:241-248.
[18] W&man-Coffelt 3, Wu ST, Parmley WW. Intracellular endocardial calcium and myocardial function in rat hearts. Cell Calcium 1991;12:39-50.
[19] Fabiato A, Fabiato F. Dependence of the contractile activation of skinned cardiac cells on the sarcomere length. Nature (Land) 1975;256:54-56.
[20] Auffermann W, Stefenelli T, Wu ST, Parmley WW, Wikman-Cof- felt J, Mason DT. Influence of positive inotropic agents on intracel- lular calcium transients. I. Normal rat heart. Am Heart J 1989;118:1219-1227.
[21] Wu ST, Kojima S, Parmley WW, W&man-Coffelt J. Relationship
between cytosolic calcium and oxygen consumption in isolated rat hearts. Cell Calcium 1992;13:235-247.
[22] Lorell BH, Apstein CS, Cunningham MJ, et al. Contribution of endothelial cells to calcium-dependent fluorescence transients in rabbit hearts loaded with Indo 1. Circ Res 1990,67:415-425. [23] &nacho SA, Figueredo VM, Brandes R, Weiner MW. Ca(2 + l-
dependent fluorescence transients and phosphate metabolism during low-flow ischemia in rat hearts. Am J Physiol1993;26S:H114-H122. [24] Figueredo VM, Brandes R, Weiner MW, Massie BM, Camacho SA.
Cardiac contractile dysfunction during mild coronary flow reduc- tions is due to an altered calcium-pressure relationship in rat hearts. J Clin Invest 1992;90:1794-1802.
[25] Stefenelli T, Wu ST, Parmley WW, Mason DT, Wikman-Coffelt J. Influence of positive inotropic agents on intracellular calcium tran-
sients. II. Cardiomyopathic hamster hearts. Am Heart J 1989;118: 1228-1236.
[26] Wahl M, Lucherini MJ, Gruenstein E. Intracellular Ca2+ measure- ment with Indo-l in substrate-attached cells: advantages and special considerations. Cell Calcium 1990;11:487-500.
[27] Fralix TA, Heineman FW, Balaban RS. Effects of tissue absorbance on NAD(P)H and Indo-l fluorescence from perfused rabbit hearts. FEBS 1990;262:287-292.
[28] Yue DT, Burkhoff D, Franz MR, Hunter WC, Sagawa K. Postex- trasystolic potentiation of the isolated canine left ventricle. Relation- ship to mechanical restitution. Circ Res 1985;56:340-350.
[29] Wier WG, Yue DT. Intracellular calcium transients underlying the short-term force-interval relationship in ferret ventricular myo- cardium. J Physiol 1986;376:507-530.
[30] Cooper IC, Fry CH. Mechanical restitution in isolated mammalian myocardium: species differences and underlying mechanisms. J Mol Cell Cardiol 1990;22:439-452.
[31] Bers DM. Ca influx and sarcoplasmic reticulum Ca release in cardiac muscle activation during postrest recovery. Am J Physiol
1985;249:H366-H381.
1321 Wood EH, Hepner RL, Weidmann S. Inotropic effects of electrical currents. Circ Res 1969;24:409-445.
[33] Nilius B, Schuttler K, Boldt W. [Properties of the premature ex- trasystolic action potentials in the rabbit atria1 myocardium]. Acta Biol Med Ger 1981;40:275-286.
[34] Kerker JP, Ruigrok TJC, Nieuwenhuijs HS, Borst C, Meijler FL. Postextrasystolic potentiation: influence of calcium and verapamil in rat and rabit hearts. Eur Heart J 1985;6:532-538.
[35] De Mello WC. Post-extrasystolic potentiation; effect of Ca, his- tamine, caffeine and epinephrine. Arch Int Pharmacodyn Ther.