Cost Metrics for Unmanned Aerial Vehicles
Ricardo Valerdi*Massachusetts Institute of Technology, Cambridge, MA 02139
This paper aims to enhance the understanding of UAV cost metrics and their uses. The paper is organized into three main areas: (1) overview of current approaches for aircraft, (2) life cycle issues with UAV cost estimation, and (3) cost metrics and model approach as applied to UAVs. As a result of this work we hope to provide a better understanding of the cost factors influencing the recently publicized scrutiny of UAV cost overruns. More importantly, we hope to begin the foundation for the development of Cost Estimating Relationships (CERs) that can potentially lead to the development of a parametric cost model for UAVs.
I.
Introduction
ECENT military operations have greatly benefited from the use of Unmanned Aerial Vehicles (UAV) as part of the high-tech arsenal of the US military. The focus of operations has undergone a paradigm shift with an added emphasis on intelligence soldiers. Similarly, a paradigm shift has taken place in the field of cost estimation. Traditional cost estimation approaches no longer apply to the new wave of UAVs being developed for the military. As the Department of Defense continues to increase its investment on UAVs and similar autonomous drones it faces a challenge of understanding the acquisition challenges of a new type of system.
The Coast Guard’s Deepwater program is relying heavily on UAVs. Thirty two percent of their deep water searches are done with UAVs. Other applications include: smuggling operations, weapons of mass destruction monitoring, migrations, customs, drug trafficking, search and rescue (S&R). The Predator UAV has played a major role in Afghanistan and Iraq. As the first U.S. assets deployed in Iraq after 9-11 there were controlled from the continental U.S. Hot air balloons are also receiving attention. The DoD is funding the development of a blimp that can navigate in High Altitude Airspace (HAA) which is designated at greater than 65k feet. It will be 25x larger than the Goodyear blimp and is currently an Advanced Concept Technology Demonstration (ACTD). Together, the Services fund $1.662 billion in 79 UAS-related R&D projects, a significant increase over the $1.241 billion and 60 projects funded in 2000.1
Industry analysts consider UAVs a “market discontinuity” because they are a disruptive innovation which is changing the industry just as the telephone and personal computers did so in the 1870’s and 1970’s, respectively. As the operational benefits for UAVs become more apparent the market will continue to expand and create applications beyond the current military scope. The Defense Science Board of the Office of the Secretary of Defense (OSD) released a report in February 2004 that outlined the keys to success of the U.S. military. The three key points included: decision weapons, UAVs, and knowledge.2 The report also claimed that the major benefit of UAVs is their digital acuity, or ability to perform ISR duties with consistent resolution over time.
These operational attributes introduce new challenges in the area of cost estimation that were not previously addressed for military aircraft. Regardless of the application, the acquisition community will need to adopt new methods for estimating the total cost of ownership of this new breed of systems. Traditional software and hardware cost models do not provide this capability because the systems that were used to create and calibrate these models were not UAVs. New Cost Estimating Relationships (CERs) need to be developed so that total ownership costs can be more accurately estimated and controlled. A useful starting point is the domain of unmanned space vehicles. These systems can provide lessons learned in cost model development and data collection.
*
Research Associate, Lean Aerospace Initiative, 77 Vassar Street/41-205, Member
R
II.
Estimation approaches
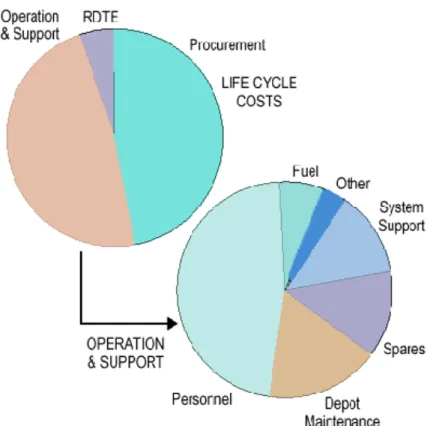
Part of the exploration of new methods involves the understanding of the cost metrics relevant to UAVs as well as an understanding of their sensitivity to cost from a production and operational standpoint. In this light, this section provides an overview of different cost estimation approaches use to date. Significant work has been done to understand the costs of aircraft manufacturing3,4,5 but these studies only deal with manned commercial and military aircraft. Nevertheless, they provide useful insight on how one could approach the estimation of UAV life cycle cost which are shown in Figure 1.
In addition to acquisition-related costs, operation and support (O&S) costs for manned aircraft typically represent nearly half of the overall life-cycle cost of military aircraft.5 In the UAV arena, however, the distribution of cost across these categories is different based on their operational nature.
A. Expert opinion
This is the most informal of the approaches because it simply involves querying the experts in a specific domain and taking their subjective opinion as an input. This approach is useful in the absence of empirical data and is very simple. The obvious drawback is that an estimate is only as good as the expert’s opinion, which can vary greatly from person to person. However, many years of experience is not a guarantee of future expertise due to new requirements, business processes, and added complexity. Moreover, this technique relies on experts and even the most highly competent experts can be wrong. A common technique for capturing expert opinion is the Delphi method8which was later improved and renamed Wideband Delphi.9
B. Bottom Up & Activity Based
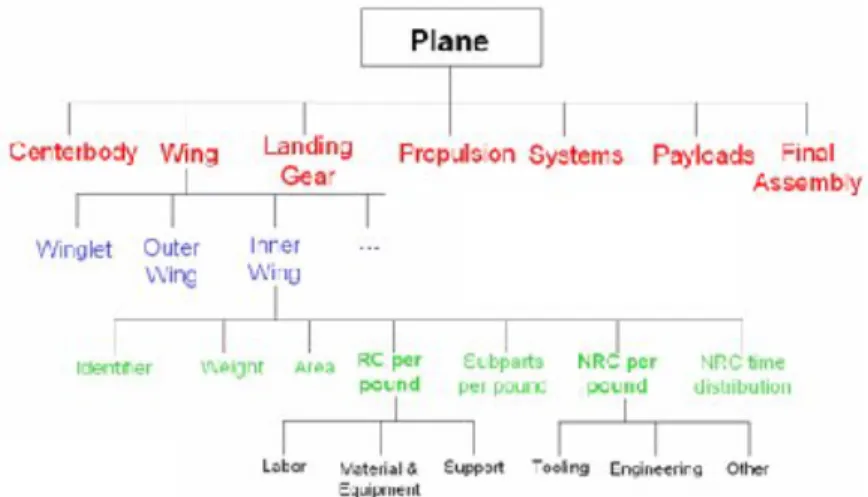
Bottom-up begins with the lowest level cost component and rolls it up to the highest level for its estimate. The main advantage is that the lower level estimates are typically provided by the people who will be responsible for doing the work. This work is typically represented in the form of subsystem components, which makes this estimate easily justifiable because of its close relationship to the activities required by each of the system components. This
approach also allows for different levels of detail for each component. For example, the costs of an airplane can be broken down into seven main components: centerbody, wing, landing gear, propulsion, systems, payloads, and assembly. Each of these components, such as the wing, can be decomposed into subcomponents such as winglet, outer wing, and inner wing. This decomposition is elaborated in Figure 2.10 This can translate to a fairly accurate estimate at the lower level components. The disadvantages are that this process is labor intensive and is typically not uniform across entities. In addition, every level folds in another layer of conservative management reserve which can result in an over estimate at the end.
C. Top Down & Design To Cost
Opposite the bottom-up approach, this technique aims for an aggregate estimate for the cost of the system based upon the overall features of the system. Once a total cost is estimated, each subcomponent is assigned a percentage of that cost. The main advantage of this approach is the ability to capture cost at the design (Figure 3a) or manufacturing (Figure 3b) levels which often mirror functional departments in an organization as well as accounting systems. It can also be useful when a certain cost target must be reached regardless of the technical features. The top down approach can often miss the low level nuances that can emerge in large systems. It also lacks detailed breakdown of the subcomponents that make up the system.
Figure 3a. Representative non-recurring cost
breakdown by parts for large commercial jet4 Figure 3b. Representative recurring cost
breakdown by parts for large commercial jet4
D. Case studies and analogy
Recognizing that companies do not constantly reinvent the wheel every time a new project comes along, there is an approach that capitalizes on the institutional memory of an organization to develop its estimates. Case studies represent an inductive process, whereby estimators and planners try to learn useful general lessons by extrapolation from specific examples. They examine in detail elaborate studies describing the environmental conditions and
Wing 27% Empennage 10% Fuselage 28% Landing Gear 3% Installed Engines 9% Systems 6% Payloads 11% Final Assembly 6% Wing 20% Empennage 9% Fuselage 37% Landing Gear 1% Installed Engines 8% Systems 17% Payloads 8%
constraints that were present during the development of previous projects, the technical and managerial decisions that were made, and the final successes or failures that resulted. They then determine the underlying links between cause and effect that can be applied in other contexts. Ideally, they look for cases describing projects similar to the project for which they will be attempting to develop estimates and apply the rule of analogy that assumes previous performance is an indicator of future performance. The sources of case studies may be either internal or external to the estimator’s own organization. Homegrown cases are likely to be more useful for the purposes of estimation because they reflect the specific engineering and business practices likely to be applied to an organization’s projects in the future. Well-documented case studies from other organizations doing similar kinds of work can also prove very useful so long as their differences are identified.
E. Heuristics & rules of thumb
Heuristic reasoning has been commonly used by engineers to arrive at quick answers to their questions. Practicing engineers, through education, experience, and examples, accumulate a considerable body of contextual intuition. These experiences evolve into instinct or common sense that are seldom recorded. These can be considered insights, lessons learned, and rules of thumb, among other names, that are brought to bear on certain situations. Ultimately, this knowledge is based on experience and often provides valuable results.
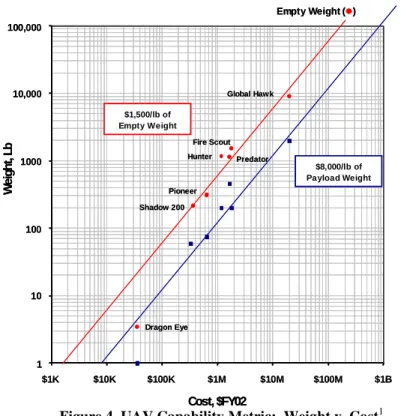
Empty weight cost is a commonly used metric in the aviation industry because it tends to remain constant across a variety of aircraft types. That number today is roughly $1500 per pound.1 Figure 4 provides the empty weight and cost data for DoD UAVs. It shows current DoD UA platforms cost approximately $1500 per pound of empty weight and $8,000 per pound of payload capacity as one “cost per capability” metric.
F. Parametric cost estimation models
This method is the most sophisticated and most difficult to develop. Parametric models generate cost estimates based on mathematical relationships between independent variables (i.e., requirements) and dependent variables (i.e., effort). The inputs characterize the nature of the work to be done, plus the environmental conditions under which the work will be performed and delivered. The definition of the mathematical relationships between the independent and dependent variables is the heart of parametric modeling. These relationships are commonly referred to Cost Estimating Relationships (CERs) and are usually based upon statistical analyses of large amounts of data. Regression models are used to validate the CERs and operationalize them in linear or nonlinear equations. The main advantage of using parametric models is that, once validated, they are fast and easy to use. They do not
1 10 100 1000 10000 100000 1,000 10,000 100,000 1,000,000 10,000,000 100,000,000 1,000,000,000 $1K $10K $100K $1M $10M $100M 1 10 100 1000 10,000 W ei gh t, Lb Cost, $FY02 Empty Weight( ) Payload Weight( ) $8,000/lb of Payload Weight $1,500/lb of Empty Weight Global Hawk Fire Scout Predator Hunter Pioneer Shadow 200 Dragon Eye 100,000 $1B 1 10 100 1000 10000 100000 1,000 10,000 100,000 1,000,000 10,000,000 100,000,000 1,000,000,000 $1K $10K $100K $1M $10M $100M 1 10 100 1000 10,000 W ei gh t, Lb Cost, $FY02 Empty Weight( ) Payload Weight( ) $8,000/lb of Payload Weight $1,500/lb of Empty Weight Global Hawk Fire Scout Predator Hunter Pioneer Shadow 200 Dragon Eye 100,000 $1B
require a lot of information and can provide fairly accurate estimates. Parametric models can also be tailored to a specific organization’s CERs. The major disadvantage of parametric models is that they are difficult and time consuming to develop and require a lot of clean, complete, and uncorrelated data to be properly validated.
Despite the wide range of estimation approaches available for commercial and military aircraft, no parametric models have been created for UAVs. This could be attributed to the fact that UAVs have not been around for very long and, as a result, there is insufficient data available to validate such models. Before proposing a framework for such a model, unique issues pertaining to the UAV life cycle are discussed.
III.
UAV Cost metrics
The foundation of any parametric model is reliable metrics that can help determine the functional complexity of the system being measured. Simply using the weight of the UAV does not capture the influence of complex
technologies that do not follow the linear relationship between cost and weight. Such technologies include a combination of:
1) sensors (electro-optical, radar, signals, meteorological, chem-bio) 2) relay (communications, navigation signals)
3) weapons
4) cargo (leaflets, supplies)
A common metric proposed in the UAV Roadmap is that of weight and endurance, or pound-hour, per thousand dollars (pound-hour/$k) which is illustrated in Figure 5.1
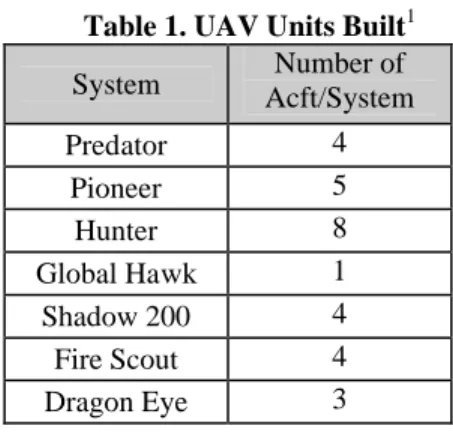
This metric has the same problem because it contains weight, a measure that is not sensitive to technologies that drive the cost of UAV development. One challenge is the scarcity of data as shown in Figure 5. Data from only seven UAVs has been collected which is not sufficient to validate any metrics. As more UAVs are developed, more data will become available. The pipeline for UAVs looks promising11,12,13 and twenty nine have already been deployed as shown in Table 1.1 But the real challenge lies ahead of us: to develop collect enough data from deployed UAVs in order to validate a parametric model that captures all of the factors affecting UAV costs.
1 10 100 1000 10000 100000 $1K $10K $100K $1M $10M $100M 1 10 100 1000 10,000 Pa yl oa d W ei gh t x E nd ur an ce , L b-H r Cost, $FY02 Global Hawk Fire Scout Predator Hunter Pioneer Shadow 200 Dragon Eye 100,000 $1B 1 10 100 1000 10000 100000 $1K $10K $100K $1M $10M $100M 1 10 100 1000 10,000 Pa yl oa d W ei gh t x E nd ur an ce , L b-H r Cost, $FY02 Global Hawk Fire Scout Predator Hunter Pioneer Shadow 200 Dragon Eye 100,000 $1B
Table 1. UAV Units Built1
System Acft/SystemNumber of
Predator 4 Pioneer 5 Hunter 8 Global Hawk 1 Shadow 200 4 Fire Scout 4 Dragon Eye 3
Acknowledgments
The author would like to thank Dyke Weatherington of the Office of the Secretary of Defense for his assistance.
References
1
UAV Roadmap, “Unmanned Aircraft Systems Roadmap: 2005-2030,” Office of the Secretary of Defense, August 4, 2005. http://www.uavforum.com/library/uav_roadmap_2005.pdf
2
UAV, 9th Annual Unmanned Aerial Vehicles Conference, San Diego, CA, June 10 & 11,2004.
3Cook, C. R., Grasner, J. C., Military Airframe Acquisition Costs: The Effects of Lean Manufacturing, Project Air Force
RAND, Santa Monica, CA, 2001. 4
Markish, J. “Valuation Techniques for Commercial Aircraft Program Design,” S.M. Thesis, Aeronautics and Astronautics Dept., MIT, Cambridge, MA, June 2002.
5
Martin, R., Evans, D., “Reducing Costs in Aircraft: The Metals Affordability Initiative Consortium,” JOM, Vol. 52, Issue 3, pp. 24-28. http://www.tms.org/pubs/journals/JOM/0003/Martin-0003.html, 2000.
6
Zych, T., Selig, M. S., “Preliminary design and cost analysis of a family of unmanned aerial vehicles,” AIAA Applied
Aerodynamics Conference, 13th, San Diego, CA, June 19-22, 1995.
7
Thomas, R. E., “Practical parametrics of aerospace pricing,” American Institute of Aeronautics and Astronautics and Society
of Automotive Engineers Propulsion Conference, 12th, Palo Alto, CA, July 26-29, 1976.
8
Dalkey, N., The Delphi Method: An Experimental Study of Group Opinion, RAND Corporation, 1969. 9
Boehm, B. W., Software Engineering Economics, Prentice-Hall, 1981. 10
Wilcox, K., “Aircraft Systems Engineering: Closing the Aircraft Business Case,” MIT Lecture Notes 16.885, Aerospace Computational Design Laboratory, 2005.
11
Wall, R., “Virtual Fly-Off,” Aviation Week & Space Technology, April 26, 2004.
12Thompson, “Boeing Gets UAV Company,” Satellite Finance, Issue 69, May 7, 2004.
13