Publisher’s version / Version de l'éditeur:
Vous avez des questions? Nous pouvons vous aider. Pour communiquer directement avec un auteur, consultez la première page de la revue dans laquelle son article a été publié afin de trouver ses coordonnées. Si vous n’arrivez pas à les repérer, communiquez avec nous à PublicationsArchive-ArchivesPublications@nrc-cnrc.gc.ca.
Questions? Contact the NRC Publications Archive team at
PublicationsArchive-ArchivesPublications@nrc-cnrc.gc.ca. If you wish to email the authors directly, please see the first page of the publication for their contact information.
https://publications-cnrc.canada.ca/fra/droits
L’accès à ce site Web et l’utilisation de son contenu sont assujettis aux conditions présentées dans le site LISEZ CES CONDITIONS ATTENTIVEMENT AVANT D’UTILISER CE SITE WEB.
Client Report (National Research Council of Canada. Construction), 2014-12
READ THESE TERMS AND CONDITIONS CAREFULLY BEFORE USING THIS WEBSITE. https://nrc-publications.canada.ca/eng/copyright
NRC Publications Archive Record / Notice des Archives des publications du CNRC :
https://nrc-publications.canada.ca/eng/view/object/?id=40c6e7cb-001d-430f-af7b-350b52071d60 https://publications-cnrc.canada.ca/fra/voir/objet/?id=40c6e7cb-001d-430f-af7b-350b52071d60
NRC Publications Archive
Archives des publications du CNRC
For the publisher’s version, please access the DOI link below./ Pour consulter la version de l’éditeur, utilisez le lien DOI ci-dessous.
https://doi.org/10.4224/21274567
Access and use of this website and the material on it are subject to the Terms and Conditions set forth at
Solutions for mid-rise wood construction: cone calorimeter results for
encapsulation materials: report to Research Consortium for Wood and
Wood-Hybrid Mid-Rise Buildings
NATIONAL RESEARCH COUNCIL CANADA
REPORT TO RESEARCH CONSORTIUM
FOR WOOD AND WOOD-HYBRID
MID-RISE BUILDINGS
Solutions for Mid-Rise Wood Construction:
Cone Calorimeter Results for Encapsulation
Materials
CLIENT REPORT: A1-100035-01.1
December 31, 2014
REPORT TO RESEARCH CONSORTIUM FOR WOOD AND
WOOD-HYBRID MID-RISE BUILDINGS
Solutions for Mid-Rise Wood Construction:
Cone Calorimeter Results for Encapsulation Materials
M. Bijloos, G.D. Lougheed, J.Z. Su and N. Bénichou
Report No.
A1-100035-01.1
Report date: December 31, 2014
Contract No. B-7000 (A1-100035)
Prepared for Canadian Wood Council
FPInnovations
Régie du bâtiment du Québec
HER MAJESTY THE QUEEN IN RIGHT OF ONTARIO as represented by
the Minister of Municipal Affairs and Housing
53 pages
This report may not be reproduced in whole or in part without the written consent of both the client and the National Research Council of Canada.
A1-100035-01.1 i
TABLE OF CONTENTS
Contents
1 Introduction ...1
2 Encapsulation ...2
3 Test Setup and Method...3
4 Pyrometer Measurements...5
5 Results of Cone calorimeter Tests with Encapsulation Materials...5
5.1 Results – 12.7 mm Thick Type X Gypsum Board...6
5.2 Results – 15.9 mm Thick Type X Gypsum Board...22
5.3 Results – 12.7 mm Thick Cement Board...32
5.4 Results – 25 and 39 mm Thick Gypsum-concrete ...42
6 Summary ...52
7 Acknowledgments...52
LIST OF FIGURES
Figure 1. Test sample cross-section for cone tests with encapsulation materials. ...4
Figure 2. Instrumentation for cone tests with encapsulation materials...4
Figure 3. Temperatures, 12.7 mm thick Type X gypsum board – Test CCE-1...12
Figure 4. Heat release rate and mass, 12.7 mm thick Type X gypsum board – Test CCE-1...12
Figure 5. Temperatures, 12.7 mm thick Type X gypsum board – Test CCE-2...13
Figure 6. Heat release rate and mass, 12.7 mm thick Type X gypsum board – Test CCE-2...13
Figure 7. Temperatures, 12.7 mm thick Type X gypsum board – Test CCE-3...14
Figure 8. Heat release rate and mass, 12.7 mm thick Type X gypsum board – Test CCE-3...14
Figure 9. Temperatures, 12.7 mm thick Type X gypsum board – Test CCE-4...15
Figure 10. Heat release rate and mass, 12.7 mm thick Type X gypsum board – Test CCE-4....15
Figure 11. Temperatures, 12.7 mm thick Type X gypsum board – Test CCE-5. ...16
Figure 12. Heat release rate and mass, 12.7 mm thick Type X gypsum board – Test CCE-5....16
Figure 13. Temperatures, 12.7 mm thick Type X gypsum board – Test CCE-6. ...17
Figure 14. Heat release rate and mass, 12.7 mm thick Type X gypsum board – Test CCE-6....17
Figure 15. Temperatures, 12.7 mm thick Type X gypsum board – Test CCE-7. ...18
Figure 16. Heat release rate and mass, 12.7 mm thick Type X gypsum board – Test CCE-7....18
Figure 17. Surface temperatures for tests with 12.7 mm thick Type X gypsum board and a 75 kW/m2 exposure...19
Figure 18. Surface temperatures for tests with 12.57 mm thick Type X gypsum board and a 50 kW/m2 exposure...19
Figure 19. Average temperatures at interface between gypsum board and plywood for tests with 1 and 2 layers of 12.7 mm thick Type X gypsum board...20
Figure 20. Heat release rate and mass for tests with 1 layer 12.7 mm thick Type X gypsum board. ...20
Figure 21. Heat release rate and mass for tests with 2 layers 12.7 mm thick Type X gypsum board. ...21
Figure 22. Temperatures, 15.9 mm thick Type X gypsum board – Test CCE-8. ...26
Figure 23. Heat release rate and mass, 15.9 mm thick Type X gypsum board – Test CCE-8....26
Figure 24. Temperatures, 15.9 mm thick Type X gypsum board – Test CCE-9. ...27
Figure 25. Heat release rate and mass, 15.9 mm thick Type X gypsum board – Test CCE-9....27
Figure 26. Temperatures, 15.9 mm thick Type X gypsum board – Test CCE-10. ...28
Figure 27. Heat release rate and mass, 15.9 mm thick Type X gypsum board – Test CCE-10..28
Figure 28. Temperatures, 15.9 mm thick Type X gypsum board – Test CCE-11. ...29
Figure 29. Heat release rate and mass, 15.9 mm thick Type X gypsum board – Test CCE-11..29
Figure 30. Surface temperatures for tests with 15.9 mm thick Type X gypsum board...30
Figure 31. Average temperatures at interface between gypsum board and plywood for tests with 1 and 2 layers of 15.9 mm thick Type X gypsum board...30
Figure 32. Heat release rate and mass for tests with 1 and 2 layers of 15.9 mm thick Type X gypsum board...31
Figure 33. Temperatures, 12.7 mm thick cement board – Test CCE-12. ...36
Figure 34. Heat release rate and mass, 12.7 mm thick cement board – Test CCE-12...36
Figure 35. Temperatures, 12.7 mm thick cement board – Test CCE-13. ...37
Figure 36. Heat release rate and mass, 12.7 mm thick cement board – Test CCE-13 2...37
Figure 37. Temperatures, 12.7 mm thick cement board – Test CCE-14. ...38
Figure 38. Heat release rate and mass, 12.7 mm thick cement board – Test CCE-13...38
Figure 39. Temperatures, 12.7 mm thick cement board – Test CCE-14. ...39
Figure 40. Heat release rate and mass, 12.7 mm thick cement board – Test CCE-14...39
A1-100035-01.1 iii
Figure 42. Average temperatures at interface between cement board and plywood for tests with
1 and 2 layers of 12.7 mm thick cement board...40
Figure 43. Heat release rate and mass for tests with 1 and 2 layers of 12.7 mm thick cement board. ...41
Figure 44. Temperatures, gypsum-concrete – Test CCE-16. ...46
Figure 45. Heat release rate, gypsum-concrete – Test CCE-16. ...46
Figure 46. Temperatures, gypsum-concrete – Test CCE-17. ...47
Figure 47. Heat release rate, gypsum-concrete – Test CCE-17. ...47
Figure 48. Temperatures, gypsum-concrete – Test CCE-18. ...48
Figure 49. Heat release rate and mass, gypsum-concrete – Test CCE-18. ...48
Figure 50. Temperatures, gypsum-concrete – Test CCE-19. ...49
Figure 51. Heat release rate and mass, gypsum-concrete – Test CCE-19. ...49
Figure 52. Surface temperatures for tests with gypsum-concrete. ...50
Figure 53. Average temperatures at interface between gypsum-concrete and plywood for tests with 25 and 39 mm thick gypsum concrete. ...50
LIST OF TABLES
Table 1. Test setup and conditions for tests with 12.7 mm thick Type X gypsum board. ...10 Table 2. Gypsum board and plywood ignition times. ...10 Table 3. Times at which the interface temperature exceed the three temperature criteria, and
interface temperature at plywood ignition, for tests with 12.7 mm thick Type X gypsum board. ...11 Table 4. Test setup and conditions for tests with 15.9 mm thick Type X gypsum board. ...24 Table 5. Gypsum board and plywood ignition times. ...24 Table 6. Times at which the interface temperature exceed the three temperature criteria, and
interface temperature at plywood ignition, for tests with 15.9 mm thick Type X gypsum board. ...25 Table 7. Test setup and conditions for tests with 12.7 mm thick cement board. ...34 Table 8. Cement board and plywood ignition times. ...34 Table 9. Times at which the interface temperature exceed the three temperature criteria, and
interface temperature at plywood ignition, for tests with 12.7 mm thick cement
board. ...35 Table 10. Test setup and conditions for tests with gypsum-concrete...44 Table 11. Gypsum-concrete and plywood ignition times...44 Table 12. Times at which the interface temperatures exceed the three temperature criteria, and
A1-100035-01.1 1
SOLUTIONS FOR MID-RISE WOOD CONSTRUCTION:
CONE CALORIMETER RESULTS FOR ENCAPSULATION MATERIALS M. Bijloos, G.D. Lougheed, J.Z. Su and N. Bénichou
1 INTRODUCTION
The acceptable solutions provided in the 2010 National Building Code (NBC) Division B [1] limits the use of combustible (wood) construction based on building height. For example, for Group C (Residential), Group D (Business and Personal Services) and Group E (Mercantile) occupancies, combustible construction can be used up to 4 storeys, and up to 2 storeys for Group A – Division 2 (Assembly) occupancies. In addition to the building height limitation, there are also building area limitations in the 2010 NBC for the use of combustible construction for these occupancies. For buildings that exceed the height and area requirements for combustible construction, the prescriptive requirements in the 2010 NBC require that noncombustible construction be used for the primary structural elements.
The prescriptive construction requirements for fire safety and protection of buildings, which are dependent upon the building size and occupancy type, are provided in Subsection 3.2.2 of the 2010 NBC. This includes the identification of the buildings for which noncombustible
construction is required. The intent of the prescriptive requirements for noncombustible
construction as they relate to the NBC fire safety/fire protection of building objectives is “to limit
the probability that combustible construction materials within a storey of a building will be involved in a fire, which could lead to the growth of fire, which could lead to the spread of fire within the storey during the time required to achieve occupant safety and for emergency responders to perform their duties, which could lead to harm to persons/damage to the building”.
The 2010 NBC defines noncombustible construction as “that type of construction in which a
degree of fire safety is attained by use of noncombustible construction materials for structural members and other building assemblies” [1]. Article 3.1.5.1 requires that a building or part of a
building required to be of noncombustible construction be constructed using noncombustible materials. The intent of this requirement, as it relates to the NBC fire safety/fire protection of building objectives, is “to limit the probability that construction materials will contribute to the
growth and spread of fire, which would lead to harm to persons/damage to the building”.
The NBC does permit, as exceptions, an extensive use of combustible materials in buildings otherwise required to have their primary structural elements to be of noncombustible
construction. The allowed materials and associated limitations are primarily provided in Articles 3.1.5.2 to 3.1.5.21. Generally, the combustible elements permitted relate to interior finishes, gypsum board, combustible roofing materials, combustible plumbing fixtures, cabling, protected insulation, flooring, combustible glazing, combustible cladding systems, non-loadbearing framing elements in partitions, stairs in dwellings, and trim and millwork, among others. Divisions B of the NBC (the “acceptable solutions” portion of the Code) generally does not permit combustible materials to be used for the primary structural elements in buildings required to be of noncombustible construction. In the Scoping Study [2] for mid-rise and hybrid buildings, it was suggested that an alternative solution using wood construction may be developed to meet the intent of the prescriptive “noncombustibility” requirement for mid-rise (and taller) buildings. As one approach, encapsulation materials could be used to protect the combustible (wood)
structural materials for a period of time in order to delay the effects of the fire on the combustible structural elements, including delay of ignition. In delaying ignition, any effects of the
combustion of the combustible structural elements on the fire severity can be delayed. In some cases, and depending upon the amount of encapsulating material used (e.g. number of layers), ignition of the elements might be avoided completely. This scenario would primarily depend upon the fire event and the actual fire performance of the encapsulating materials used. A research project, Wood and Wood-Hybrid Midrise Buildings, was undertaken to develop information to be used as the basis for alternative/acceptable solutions for mid-rise construction using wood structural elements. As part of this project, three materials were selected for
investigation as encapsulation materials for combustible structural elements: Type X gypsum board (12.7 mm thick and 15.9 mm thick), cement board (12.7 mm thick), and gypsum-concrete (25 mm thick and 39 mm thick). This report documents the results of cone calorimeter tests conducted to investigate the performance of the three encapsulation materials.
2 ENCAPSULATION
Several forms of encapsulation are frequently used to protect structural elements in buildings to increase their fire-resistance performance. For example, since steel loses strength as it heats, steel columns and beams that are encapsulated using materials with low thermal conductivity can increase their fire-resistance performance through insulation of the steel from high temperatures for a period of time. A form of encapsulation is also used with lightweight wood-frame and steel-wood-frame structural assemblies to delay the effects of fire on the structural elements (studs or joists) to provide the required fire-resistance rating.
In Europe, the protection of combustible materials by means of encapsulation of building elements to delay the contribution of combustible building elements to a fire has proved successful [3]]. The building elements and other combustible materials (e.g. insulation) are protected with a protective cover such as gypsum board or other lining material, which encapsulates the building elements and delays their ignition.
In Europe, it is assumed that a protective cover (‘encapsulation’) will be effective as long as the average temperature rise over the whole ‘exposed’ surface of the protected building element (i.e. the surface of the building element that would be exposed to the fire if it were not protected by an encapsulation material) is limited to 250ºC, and the maximum temperature rise at any (single) point on that surface does not exceed 270ºC. This is based on a charring temperature for structural timber of 300ºC [3].
In this report, the European criteria described above for evaluating the performance of the three encapsulation materials is one of three criteria investigated and is referred to in this report as “Criteria 3”. The other two criteria investigated are based on temperature criteria used in CAN/ULC-S101 [4] and CAN/ULC-S124 [5], respectively:
1. Criteria 1. The average temperature rise over the whole exposed surface of the protected building element is limited to 140ºC, and the maximum temperature rise at any (single) point on that surface does not exceed 180ºC.
2. Criteria 2. The average temperature rise over the whole exposed surface of the protected building element is limited to 195ºC, and the maximum temperature rise at any (single) point on that surface does not exceed 250ºC.
A1-100035-01.1 3 3 TEST SETUP AND METHOD
All encapsulation cone calorimeter test specimens consisted of tan encapsulation material attached to a 15.9 mm thick plywood substrate using screws. The screws were located in the four corners of the test specimen, 30 mm away from the two sides forming each corner. The specimen was mounted in the specimen holder on a ceramic fibre substrate (Figure 1). The specimens were 100 mm x 100 mm.
Five thermocouples were located at the interface between the encapsulation material and the plywood substrate (Figure 2). Thermocouples TC 1, TC 2, TC 3 and TC 4 were located at the specimen quarter-points (approximately 15 mm from two sides of the specimen). TC 5 was located at the centre of the specimen.
A pyrometer and TC 6 were used to measure the temperature at the centre of the exposed surface of the specimen. (The pyrometer and TC 6 were offset 10 mm from the centre of the sample respectively; this was done to avoid interference from TC 6 in the field of view of the pyrometer).
Two tests each were conducted using specimens with a single layer of 12.7 mm or 15.9 mm thick Type X gypsum board or a single layer of 12.7 mm thick cement board. These tests were conducted in general conformance with ISO 5660 [6], including the type of specimen holder and
the measurements specified in the test standard. The specimens were exposed to a 75 kW/m2
heat flux.
Additional tests were conducted on specimens with a single layer of 12.7 mm thick Type X gypsum board. These tests were used to evaluate the effect of the type of specimen holder and test specimen setup on the temperature at the interface between the gypsum board and the plywood substrate. The test parameters investigated were:
1. Specimen Holder. The initial tests were conducted using the standard specimen holder
specified in ISO 5660 [6] and a radiant exposure of 75 kW/m2. An additional test was
conducted using the large holder specified in CAN/ULC-S135 [7]. The radiant exposure
for this test was 75 kW/m2. For this and subsequent tests with the larger holder, ceramic
fibre insulation was inserted between the specimen and the walls of the holder to minimize heat transfer at the sides of the specimen.
2. Specimen Substrate. In most of the tests, the test specimen consisted of the
encapsulation material (gypsum board or cement board) attached to a 15.9 mm thick piece of plywood. This specimen was located on a ceramic fibre substrate. The thickness of the ceramic fiber substrate was varied depending on the thickness of the encapsulation material and the holder used for the test. For tests with the standard holder, the total height of the test specimen including the encapsulation material,
plywood and ceramic fibre insulation was 50 mm. For the tests with the large holder, the total height was 75 mm. An additional test of a single layer of 12.7 mm thick Type X gypsum board was conducted with a second piece of 15.9 mm thick plywood substituted for the ceramic fibre insulation. The radiant exposure for this additional test was
Figure 1. Test sample cross-section for cone tests with encapsulation materials.
Figure 2. Instrumentation for cone tests with encapsulation materials. 3.
As well, two tests each were conducted using test specimens consisting of two layers of 12.7 mm or 15.9 mm thick Type X gypsum board or 12.7 mm thick cement board. Two tests each were also conducted using 25 mm and 39 mm thick gypsum-concrete samples. These test specimens were mounted in the large holder, and therefore, the thickness of the ceramic fibre
insulation was varied to provide an overall test specimen height of 75 mm. A 50 kW/m2radiant
exposure was used for these tests.
The time at which the temperature rise at the interface between the encapsulation material and the plywood substrate exceeded each of the three criteria described in the Section 2,
Encapsulation, of this report was determined for each test. In addition to times at which the three temperature rise criteria were met, the time at which visible flames occurred was determined
Encapsulation Material
Plywood
Ceramic Fibre Insulation
Pyrometer/TC 6
TC 1 TC 3
TC 2 TC 4
TC 5
A1-100035-01.1 5
Tables 1, 4, 7 and 10 provide summaries of the sample setup and heat flux exposure used for each test.
4 PYROMETER MEASUREMENTS
A pyrometer with a bandwidth of 8-10m was mounted onto the hood of the cone calorimeter to
look down on a horizontally mounted sample at normal incidence. To avoid soot and particle deposits onto the pyrometer filter window, a 34 L/min pump was attached to the enclosure formed by the pyrometer’s holding bracket and the cone hood. Tests were performed to optimize the face velocity of the air flow at the cone hood/pyrometer bracket interface. The pyrometer peep hole through the cone hood was adjusted with an orifice ring a little bigger than the field of view of the pyrometer. Tests were carried out burning a very sooty sample to ensure that no particles made it into the pyrometer bracket enclosure. Finally, standard PMMA tests
were carried out with the pyrometer and pump running to ensure that the O2, CO2and CO
concentrations were not affected by the flow of air coming from the pyrometer bracket enclosure into the stream of cone gases to be analyzed.
In principle, radiation thermometry where the material and surface condition vary greatly from measurement to measurement requires a good understanding of the surface emissivity and how it changes with chemical and physical states. Unfortunately, the literature on the subject matter is scarce because of the difficulties associated with measuring the actual emissivity of a surface in dynamic processes; in the pyrolysis and combustion of materials for instance, there are significant chemical and physical changes occurring at the surface. However, studies by Urbas
et al [8, 9] suggest that most organic materials and some inorganic materials behave like an
almost-perfect blackbody in a temperature range from ~100°C to ~800°C. The surface
temperatures measured using the pyrometer provided in this report assume an emissivity of 1. 5 RESULTS OF CONE CALORIMETER TESTS WITH ENCAPSULATION MATERIALS The cone calorimeter results for tests with the three encapsulation materials are provided in this section.
For each encapsulation material, the following parameters for the test setup and initial conditions are provided for each test (see Tables 1, 4, 7, and 10):
1. Thickness of the encapsulation material. For the gypsum board and cement board, this is indicated by the number of layers of the material. For the gypsum concrete, the thickness of the test sample is provided.
2. Number of layers of plywood. For the majority of tests, the encapsulation material was attached to a single layer of 15.9 mm thick plywood. However, additional tests were conducted with the 12.7 mm Type X gypsum board using two layers of 15.9 mm thick plywood as the substrate.
3. Holder. Tests were conducted with the standard holder (small) specified in ISO 5660 [6] as well as the large holder specified in CAN/ULC S135 [7].
4. Ceramic fibre insulation. For most tests, ceramic fibre insulation was located at the bottom of the sample holder. However, the tests with two layers of plywood as the substrate were conducted without the ceramic fibre insulation at the bottom of the holder. For the tests with the large holder, ceramic fibre insulation was inserted between
the specimen and the walls of the holder to minimize heat transfer at the sides of the specimen.
5. Heat flux. Initial tests were conducted using a 75 kW/m2heat flux. (Note: the tests with a
75 kW/m2heat flux resulted in the temperature measured at the interface reaching the
temperature rise criteria earlier than in tests with an intermediate-scale furnace with the encapsulation material exposed to the standard time-temperature curve used for
fire-resistance tests. Later tests were conducted using a 50 kW/m2heat flux.)
6. Ambient temperature. The ambient temperature at the start of each test is provided for each test. The temperature indicated is the arithmetic average value of the five
thermocouples located at the interface between the encapsulation material and the plywood.
7. Moisture content. The moisture content of the plywood used as the substrate was measured prior to the test. The results shown are the arithmetic average of four
measurements each taken at the center of a side of the plywood substrate cross-section. The results shown for each test are as follows, where applicable:
1. Ignition time for the encapsulation material. This parameter is only applicable to the tests with Type X gypsum board. The cement board and the gypsum-concrete did not ignite.
2. Ignition time for the plywood substrate. The ignition time for the plywood substrate is based on the time at which visible flames were observed at the surface of the
encapsulation material. In the tests with Type X gypsum board, this time corresponded to the second occurrence of visible flames.
3. Interface temperature increases. The temperature increases, T, measured by TC 1 -– 5 are plotted for each test. The average temperature increase (arithmetic averaging of measurements by TC 1 – 5) is also shown.
4. Pyrometer. The temperature measured at the center of the exposed surface of the encapsulation material using the pyrometer is shown for each test with the measured temperature plotted versus the right (temperature) y-axis of the figure.
5. Surface Temperature. For the initial tests, the surface temperature was measured only using the pyrometer. In later tests, a surface-mounted thermocouple was added near the center of the exposed surface of the encapsulation material. As with the pyrometer results, these temperatures are plotted versus the right (temperature) y-axis of the figure.
6. Heat release rate. The heat release rate measured using the cone calorimeter is shown for each test.
7. Mass. The sample mass loss is shown for each test except those samples with
gypsum-concrete. These samples were too heavy for the load cell system and the mass could not be measured.
5.1 Results – 12.7 mm Thick Type X Gypsum Board
Seven tests were conducted using 12.7 mm thick Type X gypsum board as the encapsulation material; two tests with a single layer of the gypsum board, two tests with a double layer of the gypsum board and three additional tests with a single layer of gypsum board to investigate the effect of the holder and the ceramic insulation on the results. The test setup and initial
A1-100035-01.1 7
The ignition times for the gypsum board and the plywood are provided in Table 2. The temperature increases at the gypsum board/plywood interface for Tests CCE-1 – CCE-7 are shown in Figure 3, Figure 5, Figure 7, Figure 9, Figure 11, Figure 13 and Figure 15,
respectively. The surface temperature measured using the pyrometer and the surface-mounted thermocouple are also shown in these plots.
The heat release rate and sample mass for the 12.7 mm thick gypsum board samples
(Tests CCE-1 – CCE-7) are shown in Figure 4, Figure 6, Figure 8, Figure 10, Figure 12, Figure 14 and Figure 16, respectively.
The surface temperature was measured in all tests using a pyrometer, and in Tests CCE-3 – CCE-7 it was also measured using a surface-mounted thermocouple. Both temperature
measurements were taken near the center of the exposed surface of the encapsulation material. (The measurement locations were offset from the center of the sample and from each other so that thermocouple did not interfere with the pyrometer measurement.)
The surface temperatures measured in the four tests with a 75 kW/m2exposure and the three
tests with a 50 kW/m2exposure are plotted in Figure 17 and Figure 18, respectively. Some
general observations based on the surface temperature measurements are as follows:
1. There was an initial rapid heating of the sample surface corresponding to the burning of the gypsum board paper. This produced an initial peak temperature occurring in <60 s after the initial exposure. After the initial temperature peak, there was generally a gradual increase in temperature until the plywood was ignited. With the ignition of the plywood, there was a second peak temperature, which was typically more apparent in the temperature profiles measured by the thermocouple.
2. There was generally good test-to-test comparison for the temperatures measured using the pyrometer for the tests with the same radiant exposure.
3. The temperatures measured by the surface-mounted thermocouple were higher than the temperatures measured using the pyrometer. The differences in the measured surface temperatures are greater than would be expected based on the accuracy of the two methods, which are ±2% for the thermocouple measurements and approximately ±0.02% for the pyrometer measurements. With heating, the 12.7 mm thick gypsum board became brittle and the surface tended to crumble. This may have resulted in poor contact between the thermocouple and the surface. This would result in the
thermocouple measuring the air temperature rather than the surface temperature.
4. The surface temperature was dependent on the test setup and conditions. For example, the surface temperature measured in Test CCE-5 using the large holder with the sides of the test sample insulated was higher than measured in Tests CCE-1 and CCE-2 using the small holder. This indicates that, by using the large holder with insulation, which results in limiting the heat loss from the sides of the sample, there is an increase in the surface temperature.
The temperature increases measured at the gypsum board/plywood interface for the individual tests are shown in Figure 3, Figure 5, Figure 7, Figure 9, Figure 11, Figure 13 and Figure 15. The average temperature increase at this location is shown in Figure 19. Some general
observations based on the temperature increase results at the gypsum board/plywood interface are as follows:
1. The temperature increase profile was typical of that observed in other testing for gypsum board exposed to a heating source. Initially, there was a first phase of rapid temperature
increase of 70 – 80C within approximately 2 min. This was followed by a second phase with a more gradual temperature increase during calcination of the gypsum board and the vaporization of the water that is chemically bonded in the gypsum board. In the third phase, there was a rapid temperature increase.
2. The temperature increase measured at the five locations at the gypsum board and plywood interface were comparable particularly during the first two heating phases. There was more variation in the temperature increases at the five locations in the third phase.
3. For the tests with the large holder, the temperature increase measured at the center of the sample lagged those measured at the other four locations. The temperature increase at the center of the specimen was consistent from test-to-test with the two holders. The use of the large holder with the sides of the sample insulated limiting heat losses from the sides of the specimen resulted in a faster temperature increase at the edges of the sample, as evidenced by the data gathered by the 4 TCs not a the center of the sample. 4. The average temperature increase profiles were comparable for tests with the same
setup and exposure. There was a small difference in the temperature profile in Test 5 with the large holder versus Tests CCE-1 and CCE-2 with the small holder. Since the sides of the large holder were insulated, there was less heat loss from the sample, resulting in an earlier transition from phase 2 to phase 3. Test CCE-7 with the large holder and the two layers of plywood had the earliest transition between phases 2 and 3 indicating that the second layer of plywood also affected the heat transfer within the sample, resulting in a faster temperature increase.
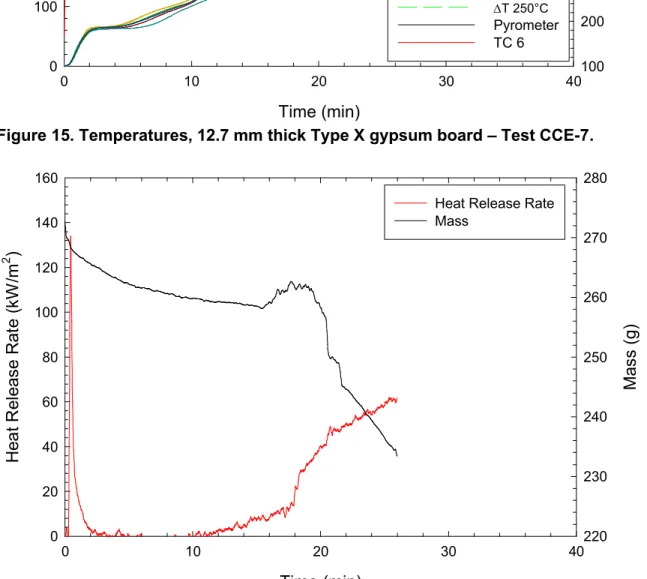
The heat release rates and changes in mass measured for the individual tests are shown in Figure 4, Figure 6, Figure 8, Figure 10, Figure 12, Figure 14 and Figure 16. Figure 20 and Figure 21 show the heat release rates and changes in mass of the samples with a single layer and a double layer of 12.7 mm thick Type X gypsum board, respectively. Some general observations based on the heat release rate and changes in mass results are as follows:
1. For all samples, there was an initial peak heat release rate in the initial phase of the test consistent with the burning of the paper on the gypsum board. This was followed by an extended period with minimal or no heat output until the plywood substrate ignited. 2. Sample 6 ignited at approximately 29 min. However, it did not produce significant heat
output prior to the test being stopped at approximately 31 min.
3. With a single layer of gypsum board and a 75 kW/m2radiant exposure, the plywood was
ignited between 17.9 and 21 min, with the shortest ignition time occurring in the test with the large holder and two layers of plywood. The ignition time for the plywood was 29.11
min in the test with the 50 kW/m2radiant exposure.
4. For the tests with the two layers of gypsum board, the plywood ignition time was between 51 and 53 min.
5. The decrease in the sample mass was steady throughout the tests until the plywood ignited; once the plywood ignited, a more rapid decrease in mass consistently resulted. The times at which the temperature increase at the interface between the gypsum board and the plywood substrate exceeded the three sets of temperature criteria are provided in Table 3. Also shown in the table are the ignition times for the plywood substrate, along with the average and maximum temperature at the interface between the gypsum board and plywood at the ignition time.
For Criteria 1 and 2, the average temperature rise criteria were typically exceeded before the single-point temperature rise criteria. For Criteria 3, the single-point temperature rise criterion
A1-100035-01.1 9
typically was exceeded prior to the average temperature rise criteria. The difference in time, as averaged over the six tests, between the average temperature rise criterion and the single-point temperature was 0.85, 1.33 and -0.25 min for Criteria 1, 2 and 3, respectively. Of the three temperature rise criteria, Criteria 3 is the best matched in terms of temperature difference between the average temperature rise and single-point temperature criteria.
The time at which plywood ignition occurred was later than the times for the three temperature increase criteria by more than 2 min. The average interface temperature at ignition was 338.4C and the maximum single-point temperature at ignition was 360.9C averaged over Tests 1 – 5 and 7. (Test 6 was not included in the average as there was not a clear indication of plywood ignition in this test based on heat output (Figure 14 and Figure 20), yet the temperatures at ‘ignition’ were much higher than for the other 6 tests). The measured ignition temperatures are consistent with the 300 – 350C temperatures reported in the literature for the piloted ignition of wood [10].
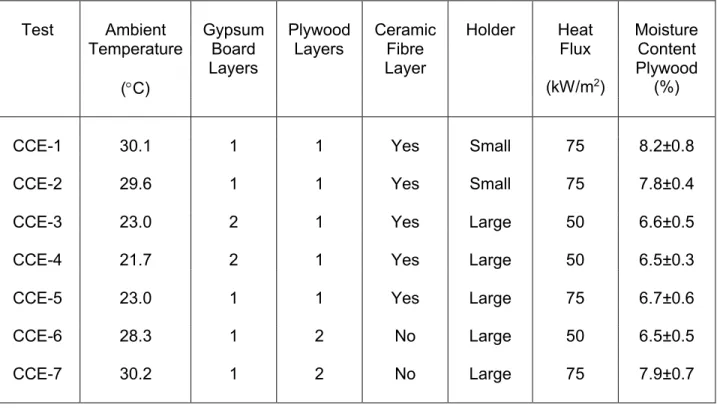
Table 1. Test setup and conditions for tests with 12.7 mm thick Type X gypsum board.
Test Ambient Gypsum Plywood Ceramic Holder Heat Moisture
Temperature Board Layers Fibre Flux Content
Layers Layer Plywood
(C) (kW/m2) (%)
CCE-1 30.1 1 1 Yes Small 75 8.2±0.8
CCE-2 29.6 1 1 Yes Small 75 7.8±0.4
CCE-3 23.0 2 1 Yes Large 50 6.6±0.5
CCE-4 21.7 2 1 Yes Large 50 6.5±0.3
CCE-5 23.0 1 1 Yes Large 75 6.7±0.6
CCE-6 28.3 1 2 No Large 50 6.5±0.5
CCE-7 30.2 1 2 No Large 75 7.9±0.7
Table 2. Gypsum board and plywood ignition times.
Test Gypsum Board Ignition Plywood Ignition
(min) (min) CCE-1 0.32 20.70 CCE-2 0.32 19.18 CCE-3 0.78 51.33 CCE-4 0.75 52.72 CCE-5 0.27 18.23 CCE-6 0.62 29.11 CCE-7 0.25 17.87
A1-100035-01.1 11
Table 3. Times at which the interface temperature exceed the three temperature criteria, and interface temperature at plywood ignition, for tests with 12.7 mm thick Type X gypsum board.
Test Number of Heat Flux Time Exceed T Criteria Plywood Ignition
Encapsulation Average T (ºC) Single PointT (ºC) Time Avg Temp Temp Max
(Gypsum Board) 140 195 250 180 250 270 Single Point
Layers (kW/m2) (min) (min) (min) (min) (min) (min) (min) (ºC) (ºC)
CCE-1 1 75 13.30 14.73 16.53 13.90 16.23 16.73 20.70 363.87 393.82 CCE-2 1 75 13.33 15.03 16.97 13.87 16.13 16.83 19.18 342.32 362.38 CCE-3 2 50 39.03 43.00 46.80 40.56 44.53 46.23 51.33 329.88 348.18 CCE-4 2 50 40.19 44.09 47.67 41.77 45.97 47.44 52.72 333.76 348.76 CCE-5 1 75 13.27 14.77 16.44 13.64 15.47 16.05 18.23 326.80 335.96 CCE-6 1 50 15.80 18.03 20.57 16.27 19.27 20.20 29.11 429.49 500.08 CCE-7 1 75 12.03 13.30 14.83 12.33 13.73 14.23 17.87 333.67 376.46
Avg Temp – Arithmetic average temperature at interface between the gypsum board and the plywood at plywood ignition. Temp Max Single Point – Maximum single-point temperature at interface at plywood ignition.
Figure 3. Temperatures, 12.7 mm thick Type X gypsum board – Test CCE-1.
Figure 4. Heat release rate and mass, 12.7 mm thick Type X gypsum board – Test CCE-1. Time (min) 0 10 20 30 40 T ( °C ) 0 100 200 300 400 500 600 700 800 T em p er at u re ( °C ) 0 100 200 300 400 500 600 700 800 TC 1 TC 2 TC 3 TC 4 TC 5 Average T 140°C T 195°C T 250°C Pyrometer Time (min) 0 10 20 30 40 H e at R e le a se R at e ( kW /m 2 ) 0 20 40 60 80 100 120 140 160 M as s (g ) 130 140 150 160 170 180 190 200 Heat Release Rate
A1-100035-01.1 13
Figure 5. Temperatures, 12.7 mm thick Type X gypsum board – Test CCE-2.
Figure 6. Heat release rate and mass, 12.7 mm thick Type X gypsum board – Test CCE-2. Time (min) 0 10 20 30 40 T ( °C ) 0 100 200 300 400 500 600 700 800 T e m p er at ur e (° C ) 0 100 200 300 400 500 600 700 800 TC 1 TC 2 TC 3 TC 4 TC 5 Average T 140°C T 195°C T 250°C Pyrometer Time (min) 0 10 20 30 40 H e at R e le a se R at e ( kW /m 2 ) 0 20 40 60 80 100 120 140 160 M as s (g ) 100 110 120 130 140 150 160 170 180 190 200 Heat Release Rate Mass
Figure 7. Temperatures, 12.7 mm thick Type X gypsum board – Test CCE-3.
Figure 8. Heat release rate and mass, 12.7 mm thick Type X gypsum board – Test CCE-3. Time (min) 0 10 20 30 40 50 60 70 80 90 100 T ( °C ) 0 100 200 300 400 500 600 700 800 T e m p er at ur e (° C ) 0 200 400 600 800 1000 TC 1 TC 2 TC 3 TC 4 TC 5 Average T 140°C T 195°C T 250°C Pyrometer TC 6 Time (min) 0 10 20 30 40 50 60 70 80 90 100 H e at R e le a se R at e ( kW /m 2 ) 0 20 40 60 80 100 120 140 160 M as s (g ) 200 210 220 230 240 250 260 270 280 290 300 Heat Release Rate Mass
A1-100035-01.1 15
Figure 9. Temperatures, 12.7 mm thick Type X gypsum board – Test CCE-4.
Figure 10. Heat release rate and mass, 12.7 mm thick Type X gypsum board – Test CCE-4. Time (min) 0 10 20 30 40 50 60 70 80 90 100 T ( °C ) 0 100 200 300 400 500 600 700 800 T e m p er at ur e (° C ) 0 100 200 300 400 500 600 700 800 900 TC 1 TC 2 TC 3 TC 4 TC 5 Average T 140°C T 195°C T 250°C Pyrometer TC 6 Time (min) 0 10 20 30 40 50 60 70 80 90 100 H e at R e le a se R at e ( kW /m 2 ) 0 20 40 60 80 100 120 140 160 M as s (g ) 200 210 220 230 240 250 260 270 280 290 300 Heat Release Rate
Figure 11. Temperatures, 12.7 mm thick Type X gypsum board – Test CCE-5.
Figure 12. Heat release rate and mass, 12.7 mm thick Type X gypsum board – Test CCE-5. Time (min) 0 10 20 30 40 T ( °C ) 0 100 200 300 400 500 600 700 800 T e m p er at ur e (° C ) 100 200 300 400 500 600 700 800 900 1000 TC 1 TC 2 TC 3 TC 4 TC 5 Average T 140°C T 195°C T 250°C Pyrometer TC 6 Time (min) 0 10 20 30 40 H e at R e le a se R at e ( kW /m 2 ) 0 20 40 60 80 100 120 140 160 M as s (g ) 120 130 140 150 160 170 180 190 200 Heat Release Rate
A1-100035-01.1 17
Figure 13. Temperatures, 12.7 mm thick Type X gypsum board – Test CCE-6.
Figure 14. Heat release rate and mass, 12.7 mm thick Type X gypsum board – Test CCE-6. Time (min) 0 10 20 30 40 T ( °C ) 0 100 200 300 400 500 600 T e m p er at ur e (° C ) 0 100 200 300 400 500 600 700 800 TC 1 TC 2 TC 3 TC 4 TC 5 Average T 140°C T 195°C T 250°C Pyrometer TC 6 Time (min) 0 10 20 30 40 H e at R e le a se R at e ( kW /m 2 ) 0 20 40 60 80 100 120 140 160 M as s (g ) 240 250 260 270 280 Heat Release Rate
Figure 15. Temperatures, 12.7 mm thick Type X gypsum board – Test CCE-7.
Figure 16. Heat release rate and mass, 12.7 mm thick Type X gypsum board – Test CCE-7. Time (min) 0 10 20 30 40 T ( °C ) 0 100 200 300 400 500 600 T e m p er at ur e (° C ) 100 200 300 400 500 600 700 800 900 TC 1 TC 2 TC 3 TC 4 TC 5 Average T 140°C T 195°C T 250°C Pyrometer TC 6 Time (min) 0 10 20 30 40 H ea t R el ea se R at e (k W /m 2 ) 0 20 40 60 80 100 120 140 160 M as s (g ) 220 230 240 250 260 270 280 Heat Release Rate
A1-100035-01.1 19 Time (min) 0 10 20 30 40 T em pe ra tu re ( °C ) 0 100 200 300 400 500 600 700 800 900 1000
Pyrometer Test CCE-1 Pyrometer Test CCE-22 Pyrometer Test CCE-5 Pyrometer Test CCE-7 TC 6 Test CCE-5 TC 6 Test CCE-7
Figure 17. Surface temperatures for tests with 12.7 mm thick Type X gypsum board and a 75 kW/m2 exposure. Time (min) 0 10 20 30 40 50 60 70 80 T em pe ra tu re ( °C ) 0 100 200 300 400 500 600 700 800 900 1000
Pyrometer Test CCE-3 Pyrometer Test CCE-4 Pyrometer Test CCE-6 TC 6 Test CCE-6
Figure 18. Surface temperatures for tests with 12.57 mm thick Type X gypsum board and a 50 kW/m2 exposure.
Figure 19. Average temperatures at interface between gypsum board and plywood for tests with 1 and 2 layers of 12.7 mm thick Type X gypsum board.
Figure 20. Heat release rate and mass for tests with 1 layer 12.7 mm thick Type X gypsum board. Time (min) 0 10 20 30 40 50 60 70 80 90 100 T ( °C ) 0 100 200 300 400 500 600 Test CCE-1 Test CCE-2 Test CCE-3 Test CCE-4 Test CCE-5 Test CCE-6 Test CCE-7 T 140°C T 195°C T 250°C Time (min) 0 10 20 30 40 50 60 H e at R el ea se R at e (k W /m 2 ) 0 20 40 60 80 100 120 140 160 M a ss ( g) 100 120 140 160 180 200 220 240 260 280 300 HRR Test CCE-1 HRR Test CCE-2 HRR Test CCE-5 HRR Test CCE-6 HRR Test CCE-7 Mass Test CCE-1 Mass Test CCE-2 Mass Test CCE-5 Mass Test CCE-6 Mass Test CCE-7
A1-100035-01.1 21
Figure 21. Heat release rate and mass for tests with 2 layers 12.7 mm thick Type X gypsum board. Time (min) 0 10 20 30 40 50 60 70 80 H e at R el ea se R at e (k W /m 2 ) 0 20 40 60 80 100 120 140 160 M a ss ( g) 200 220 240 260 280 300 HRR Test CCE-3 HRR Test CCE-4 Mass Test CCE-3 Mass Test CCE-4
5.2 Results – 15.9 mm Thick Type X Gypsum Board
Four tests were conducted using 15.9 mm thick Type X gypsum board as the encapsulation material; two tests with a single layer of the gypsum board and two tests with a double layer of the gypsum board. The test setup and initial conditions are summarized in Table 4.
The ignition times for the gypsum board and the plywood are provided in Table 5. The
temperature increase at the gypsum board/plywood interface for Samples CCE-8 – CCE-11 are shown in Figure 22, Figure 24, Figure 26 and Figure 28, respectively. The surface temperature measured using the pyrometer and the surface-mounted thermocouple are also shown in these plots.
The heat release rate and sample mass for the 15.9 mm thick gypsum board samples (Samples CCE-8 – 11) are shown in Figure 23, Figure 25, Figure 27 and Figure 29, respectively.
The surface temperature was measured in all tests using a pyrometer, and in Tests CCE-10 – 11 it was also measured using a surface-mounted thermocouple. Both temperature
measurements were taken near the center of the exposed surface of the encapsulation material. (The measurement locations were offset from the center of the sample and from each other so that thermocouple did not interfere with the pyrometer measurement.)
The surface temperatures measured in the four tests are plotted in Figure 30. Some general observations based on the surface temperature measurements are as follows:
1. There was an initial rapid heating of the sample surface corresponding to the burning of the gypsum board paper. This produced an initial peak temperature occurring in <60 s after the initial exposure. After the initial temperature peak, there was generally a gradual increase in temperature until the plywood was ignited. With the ignition of the plywood, there was a second peak temperature, which was typically more apparent in the temperature profiles measured by the thermocouple.
2. There was good test-to-test comparison for the temperatures measured using the pyrometer for the tests with similar setup and conditions (Test 8 versus Test CCE-9, and Test CCE-10 versus Test CCE-11).
3. The temperatures measured by the surface-mounted thermocouple were comparable to the temperatures measured using the pyrometer. The differences in the results are within the accuracy of the two measurement methods, which is approximately ±2% for the thermocouple measurements and approximately ±0.02% for the pyrometer
measurements.
The temperature increases measured at the gypsum board/plywood interface for the individual tests are shown in Figure 22, Figure 24, Figure 26 and Figure 28. The average temperature increase at this location is shown in Figure 31. Some general observations based on the temperature increase results at the gypsum board/plywood interface are as follows:
1. The temperature increase profile was typical of that observed in other testing for gypsum board exposed to a heating source. Initially, there was a first phase of rapid temperature increase of 70 – 80C within approximately 2 min. This was followed by a second phase with a more gradual temperature increase during calcination of the gypsum board and
A1-100035-01.1 23
the vaporization of the water that is chemically bonded in the gypsum board. In the third phase, there was a rapid temperature increase.
2. The temperature increase measured at the five locations at the gypsum board and plywood interface were comparable particularly during the first two heating phases. There was more variation in the temperature increases at the five locations in the third phase. The variation in the temperature increase in the last phase was more than in the tests with the 12.7 mm thick gypsum board.
3. For the tests with the large holder (Tests CCE-10 and CCE-11), the temperature
increase measured at the center of the sample lagged those measured at the other four locations. The use of the large holder with the sides of sample insulated limiting heat losses from the sides of the specimen resulted in a faster temperature increase at the edges of the sample, as evidenced by the data gathered by the 4 TCs not a the center of the sample.
The heat release rates and changes in mass measured for the individual tests are shown in Figure 23, Figure 25, Figure 27 and Figure 29. Figure 32 shows the heat release rates and masses for the four tests together. Some general observations based on the heat release rate and mass results are as follows:
1. For all samples, there was an initial peak heat release rate in the initial phase of the test consistent with the burning of the paper on the gypsum board. This was followed by an extended period with minimal or no heat output until the plywood substrate ignited.
2. With the single layer of gypsum board and the 75 kW/m2radiant exposure, the plywood
was ignited at approximately 22 min.
3. For the tests with the two layers of gypsum board, the plywood ignition time was approximately 62 min.
4. The decrease in the sample mass was steady throughout the tests until the plywood ignited; once the plywood ignited, a more rapid decrease in mass consistently resulted. The times at which the temperature increase at the interface between the gypsum board and the plywood substrate exceeded the three sets of temperature criteria are provided in Table 6. Also shown in the table are the ignition times for the plywood substrate along with the average and maximum temperature at the interface between the gypsum board and plywood at the ignition time.
For Criteria 1 and 2, the average temperature rise criteria were typically exceeded before the single-point temperature rise criteria. For Criteria 3, the single-point temperature rise criteria typically exceeded prior to the average temperature rise criteria. The difference in time
averaged over the four tests between the average temperature rise criteria and the single-point temperature was 0.54, 0.74 and -2.34 min for Criteria 1, 2 and 3, respectively. Of the three criteria temperature rise criteria, Criteria 1 is the best matched in terms of temperature difference between the average temperature rise and single-point temperature criteria.
The time at which plywood ignition occurred was later than the times for the three temperature increase criteria by 1.33 and 2.31 min for the tests with a single layer of gypsum board and by approximately 8 min for the test with 2 layers of gypsum board. The average interface
temperature at ignition was 324.0C and the maximum single-point temperature at ignition was 360.8C. The measured ignition temperatures are consistent with the 300 – 350C temperatures reported in the literature for the piloted ignition of wood [10].
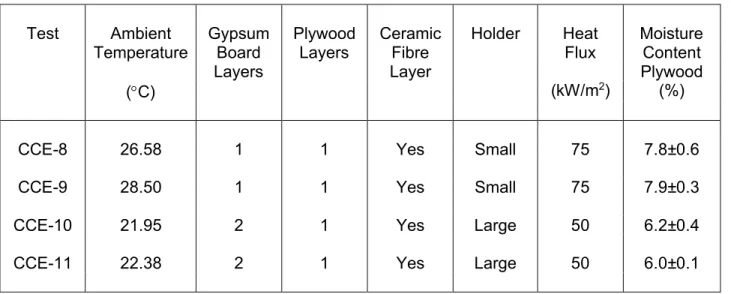
Table 4. Test setup and conditions for tests with 15.9 mm thick Type X gypsum board.
Test Ambient Gypsum Plywood Ceramic Holder Heat Moisture
Temperature Board Layers Fibre Flux Content
Layers Layer Plywood
(C) (kW/m2) (%)
CCE-8 26.58 1 1 Yes Small 75 7.8±0.6
CCE-9 28.50 1 1 Yes Small 75 7.9±0.3
CCE-10 21.95 2 1 Yes Large 50 6.2±0.4
CCE-11 22.38 2 1 Yes Large 50 6.0±0.1
Table 5. Gypsum board and plywood ignition times.
Test Gypsum Board Ignition Plywood Ignition
(min) (min)
CCE-8 0.33 21.73
CCE-9 0.30 22.08
CCE-10 0.72 61.70
A1-100035-01.1 25
Table 6. Times at which the interface temperature exceed the three temperature criteria, and interface temperature at plywood ignition, for tests with 15.9 mm thick Type X gypsum board.
Test Number of Heat Flux Time Exceed T Criteria Plywood Ignition
Encapsulation Average T (ºC) Single PointT (ºC) Time Avg Temp Temp Max
(Gypsum Board) 140 195 250 180 250 270 Single Point
Layers (kW/m2) (min) (min) (min) (min) (min) (min) (min) (ºC) (ºC)
CCE-8 1 75 16.17 17.86 21.73 17.10 19.60 20.40 21.73 321.59 358.58
CCE-9 1 75 16.33 18.13 22.08 16.70 19.03 19.77 22.08 328.38 355.69
CCE-10 2 50 46.47 51.90 57.13 46.60 51.63 53.67 61.70 322.11 365.44
CCE-11 2 50 46.43 51.63 56.57 47.17 52.23 54.33 62.25 332.91 363.32
Avg Temp – Arithmetic average temperature at interface between the gypsum board and the plywood at plywood ignition. Temp Max Single Point – Maximum single-point temperature at the interface at plywood ignition.
Figure 22. Temperatures, 15.9 mm thick Type X gypsum board – Test CCE-8.
Figure 23. Heat release rate and mass, 15.9 mm thick Type X gypsum board – Test CCE-8. Time (min) 0 10 20 30 40 T ( °C ) 0 100 200 300 400 500 600 700 800 T e m p er at ur e (° C ) 0 100 200 300 400 500 600 700 800 900 TC 1 TC 2 TC 3 TC 4 TC 5 Average T 140°C T 195°C T 250°C Pyrometer Time (min) 0 10 20 30 40 H e at R e le a se R at e ( kW /m 2 ) 0 20 40 60 80 100 120 140 160 M as s (g ) 150 160 170 180 190 200 210 220 Heat Release Rate Mass
A1-100035-01.1 27
Figure 24. Temperatures, 15.9 mm thick Type X gypsum board – Test CCE-9.
Figure 25. Heat release rate and mass, 15.9 mm thick Type X gypsum board – Test CCE-9. Time (min) 0 10 20 30 40 T ( °C ) 0 100 200 300 400 500 600 700 800 T e m p er at ur e (° C ) 0 100 200 300 400 500 600 700 TC 1 TC 2 TC 3 TC 4 TC 5 Average T 140°C T 195°C T 250°C Pyrometer Time (min) 0 10 20 30 40 H e at R e le a se R at e ( kW /m 2 ) 0 20 40 60 80 100 120 140 160 M as s (g ) 100 110 120 130 140 150 160 170 180 190 200 210 Heat Release Rate
Figure 26. Temperatures, 15.9 mm thick Type X gypsum board – Test CCE-10.
Figure 27. Heat release rate and mass, 15.9 mm thick Type X gypsum board – Test CCE-10. Time (min) 0 10 20 30 40 50 60 70 80 90 100 110 T ( °C ) 0 100 200 300 400 500 600 700 T e m p er at ur e (° C ) 0 100 200 300 400 500 600 700 TC 1 TC 2 TC 3 TC 4 TC 5 Average T 140°C T 195°C T 250°C Pyrometer TC 6 Time (min) 0 10 20 30 40 50 60 70 80 90 100 110 H e at R e le a se R at e ( kW /m 2 ) 0 20 40 60 80 100 120 140 160 M as s (g ) 240 250 260 270 280 290 300 310 Heat Release Rate Mass
A1-100035-01.1 29
Figure 28. Temperatures, 15.9 mm thick Type X gypsum board – Test CCE-11.
Figure 29. Heat release rate and mass, 15.9 mm thick Type X gypsum board – Test CCE-11. Time (min) 0 10 20 30 40 50 60 70 80 90 100 110 T ( °C ) 0 100 200 300 400 500 600 700 800 T e m p er at ur e (° C ) 0 100 200 300 400 500 600 700 800 TC 1 TC 2 TC 3 TC 4 TC 5 Average T 140°C T 195°C T 195°C Pyrometer TC 6 Time (min) 0 10 20 30 40 50 60 70 80 90 100 110 H e at R e le a se R at e ( kW /m 2 ) 0 20 40 60 80 100 120 140 160 M as s (g ) 230 240 250 260 270 280 290 300 310 Heat Release Rate Mass
Figure 30. Surface temperatures for tests with 15.9 mm thick Type X gypsum board.
Figure 31. Average temperatures at interface between gypsum board and plywood for tests with 1 and 2 layers of 15.9 mm thick Type X gypsum board.
Time (min) 0 10 20 30 40 50 60 70 80 T e m pe ra tu re ( °C ) 500 600 700 800 900 1000
Pyrometer Test CCE-8 Pyrometer Test CCE-9 Pyrometer Test CCE-10 Pyrometer Test 11 TC 6 Test CCE-10 TC 6 Test CCE-11 Time (min) 0 10 20 30 40 50 60 70 80 90 100 T ( °C ) 0 100 200 300 400 500 600 Test CCE-8 Test CCE-9 Test CCE-10 Test CCE-11 T 140°C T 195°C T 250°C
A1-100035-01.1 31
Figure 32. Heat release rate and mass for tests with 1 and 2 layers of 15.9 mm thick Type X gypsum board.
Time (min) 0 10 20 30 40 50 60 70 80 90 100 110 120 H ea t R e le as e R at e ( kW /m 2 ) 0 20 40 60 80 100 120 140 160 M as s (g ) 50 100 150 200 250 300 350 HRR Test CCE-8 HRR Test CCE-9 HRR Test CCE-10 HRR Test CCE-11 Mass Test CCE-8 Mass Test CCE-9 Mass Test CCE-10 Mass Test CCE11
5.3 Results – 12.7 mm Thick Cement Board
Four tests were conducted using 12.7 mm thick cement board as the encapsulation material; two tests with a single layer of the cement board and two tests with a double layer of the cement board. The test setup and initial conditions are summarized in Table 7.
The ignition times for the cement board and the plywood are provided in Table 8. The
temperature increase at the cement board/plywood interface for Tests CCE-12 – CCE-15 are shown in Figure 33, Figure 35, Figure 37 and Figure 39, respectively. The surface temperature measured using the pyrometer and the surface-mounted thermocouple are also shown in these plots.
The heat release rate and sample mass for the 12.7 mm thick cement board samples (Tests CCE-12 – CCE-15) are shown in Figure 34, Figure 36, Figure 38 and Figure 40, respectively.
The surface temperature was measured in all tests using a pyrometer, and in Tests CCE-14 – CCE-15 it was also measured using a surface-mounted thermocouple. Both temperature
measurements were taken near the center of the exposed surface of the encapsulation material. (The measurement locations were offset from the center of the sample and from each other so that thermocouple did not interfere with the pyrometer measurement.)
The surface temperatures measured in the four tests are plotted in Figure 41. Some general observations based on the surface temperature measurements are as follows:
1. There was an initial rapid increase in the surface temperature immediately after
exposure to the radiant. The initial temperature increase was not as fast as that with the gypsum board samples since, unlike with the gypsum board samples, there was no heat contribution from the cement board because the cement board had no paper facing. After the initial rapid temperature rise, there was a gradual increase in temperature until the plywood was ignited. With the ignition of the plywood, the peak temperature was measured, which was typically more apparent in the temperature profiles measured by the thermocouple.
2. There was good test-to-test comparison for the temperatures measured using the pyrometer for the tests with similar setup and conditions (Test CCE-12 versus Test CCE-13, and Test CCE-14 versus CCE-15).
3. The temperatures measured by the surface-mounted thermocouple were comparable to the temperatures measured using the pyrometer. The differences in the results are within the accuracy of the two measurement methods, which is approximately ±2% for the thermocouple measurements and approximately ±0.02% for the pyrometer
measurements.
The temperature increases measured at the cement board/plywood interface for the individual tests are shown in Figure 33, Figure 35, Figure 37 and Figure 39. The average temperature increase at this location is shown in Figure 42. Some general observations based on the temperature increase results at the cement board/plywood interface are as follows:
1. The temperature increase profile was similar to that for the tests with gypsum board. Initially, there was a first phase of rapid temperature increase of 70 – 80C. The initial temperature increase was slower than with the gypsum board samples since there was
A1-100035-01.1 33
no additional heating of the exposed surface of the encapsulation material. This was followed by a second phase with a more gradual temperature increase with the vaporization of the water in the cement board. The second phase was considerably shorter than the second phase for the gypsum board samples. In the third phase, there was a rapid temperature increase.
2. The temperature increase measured at the five locations at the cement board and plywood interface were comparable particularly during the first two heating phases. There was more variation in the temperature increases at the five locations in the third phase.
3. For the tests with the large holder (Tests CCE-14 and CCE-15), the temperature increase measured at center of the sample lagged those measured at the other four locations. The use of the large holder with the sides of sample insulated limiting heat losses from the sides of the specimen resulted in a faster temperature increase at the edges of the sample, as evidenced by the data gathered by the 4 TCs not a the center of the sample.
The heat release rates and changes in mass measured for the individual tests are shown in Figure 34, Figure 36, Figure 38 and Figure 40. Figure 43 shows the heat release rates and masses for the four tests together. Some general observations based on the heat release rate and mass results are as follows:
1. For all samples, there was limited or no heat output until the plywood was ignited.
2. With the single layer of cement board and the 75 kW/m2radiant exposure, the plywood
was ignited at approximately 14 min.
3. For the tests with the two layers of cement board and the 50 kW/m2radiant exposure,
the plywood ignition time was approximately 40 min.
4. The decrease in the sample mass was steady throughout the tests until the plywood ignited; once the plywood ignited, a more rapid decrease in mass consistently resulted. The times at which the temperature increase at the interface between the cement board and the plywood substrate exceeded the three sets of temperature criteria are provided in Table 9. Also shown in the table are the ignition times for the plywood substrate along with the average and maximum temperature at the interface between the cement board and plywood at the ignition time.
For Criteria 1and 2, the average temperature rise criteria was typically exceeded before the single-point temperature rise criteria. For Criteria 3, the single-point temperature rise criteria typically exceeded prior to the average temperature rise criteria. The difference in time
averaged over the four tests between the average temperature rise criteria and the single-point temperature was 1.51, 2.23 and -1.41 min for Criteria 1, 2 and 3, respectively. Of the three criteria temperature rise criteria, Criteria 1 and 3 are the best matched in terms of temperature difference between the average temperature rise and single-point temperature criteria.
The time at which plywood ignition occurred was later than the times for the three temperature increase criteria by more than 2.83 and 2.95 min for the tests with a single layer of cement board and by approximately 6.5 min for the test with 2 layers of cement board. The average interface temperature at ignition was 344.7C and the maximum single-point temperature at ignition was 364.1C averaged over Tests CCE-12 – CCE-15. The measured ignition
temperatures are consistent with the 300 – 350C temperatures reported in the literature for the piloted ignition of wood [10].
Table 7. Test setup and conditions for tests with 12.7 mm thick cement board.
Test Ambient Cement Plywood Ceramic Holder Heat Moisture
Temperature Board Layers Fibre Flux Content
Layers Layer Plywood
(C) (kW/m2) (%)
CCE-12 29.49 1 1 Yes Small 75 9.0±1.0
CCE-13 28.97 1 1 Yes Small 75 8.4±0.9
CCE-14 23.74 2 1 Yes Large 50 NA
CCE-15 23.09 2 1 Yes Large 50 7.1±0.6
NA – Not available
Table 8. Cement board and plywood ignition times.
Test Cement Board Ignition Plywood Ignition
(min) (min) CCE-12 NI 13.83 CCE-13 NI 14.32 CCE-14 NI 40.80 CCE-15 NI 42.25 NI – No Ignition
A1-100035-01.1 35
Table 9. Times at which the interface temperature exceed the three temperature criteria, and interface temperature at plywood ignition, for tests with 12.7 mm thick cement board.
Test Number of Heat Flux Time Exceed T Criteria Plywood Ignition
Encapsulation Average T (ºC) Single PointT (ºC) Time Avg Temp Temp Max
(Cement Board) 140 195 250 180 250 270 Single Point
Layers (kW/m2) (min) (min) (min) (min) (min) (min) (min) (ºC) (ºC)
CCE-12 1 75 7.60 9.20 13.83 8.33 10.30 11.00 13.83 362.70 374.65
CCE-13 1 75 8.10 9.93 14.32 8.83 10.80 11.37 14.32 353.15 383.16
CCE-14 2 50 22.87 28.60 34.17 24.73 32.03 34.30 40.80 331.40 347.37
CCE-15 2 50 23.03 29.00 35.10 25.73 32.50 35.10 41.68 331.72 351.00
Avg Temp – Arithmetic average temperature at interface between the cement board and the plywood at plywood ignition. Temp Max Single Point – Maximum single-point temperature at the interface at plywood ignition.
Figure 33. Temperatures, 12.7 mm thick cement board – Test CCE-12.
Figure 34. Heat release rate and mass, 12.7 mm thick cement board – Test CCE-12. Time (min) 0 5 10 15 20 25 30 T ( °C ) 0 100 200 300 400 500 600 700 800 T e m p er at ur e (° C ) 0 200 400 600 800 TC 1 TC 2 TC 3 TC 4 TC 5 Average T 140°C T 195°C T 250°C Pyrometer Time (min) 0 5 10 15 20 25 30 H ea t R el ea se R at e (k W /m 2 ) 0 20 40 60 80 100 120 140 160 M as s (g ) 120 130 140 150 160 170 180 190 200 Heat Release Rate Mass
A1-100035-01.1 37
Figure 35. Temperatures, 12.7 mm thick cement board – Test CCE-13.
Figure 36. Heat release rate and mass, 12.7 mm thick cement board – Test CCE-13 2. Time (min) 0 5 10 15 20 25 30 T ( °C ) 0 100 200 300 400 500 600 700 800 T e m p er at ur e (° C ) 0 200 400 600 800 TC 1 TC 2 TC 3 TC 4 TC 5 Average T 140°C T 195°C T 250°C Pyrometer Time (min) 0 5 10 15 20 25 30 H ea t R el ea se R at e (k W /m 2 ) 0 20 40 60 80 100 120 140 160 M as s (g ) 130 140 150 160 170 180 190 200 210 Heat Release Rate
Figure 37. Temperatures, 12.7 mm thick cement board – Test CCE-14.
Figure 38. Heat release rate and mass, 12.7 mm thick cement board – Test CCE-13. Time (min) 0 10 20 30 40 50 60 70 80 90 100 T ( °C ) 0 100 200 300 400 500 600 700 T e m p er at ur e (° C ) 0 100 200 300 400 500 600 700 TC 1 TC 2 TC 3 TC 4 TC 5 Average T 140°C T 195°C T 250°C Pyrometer TC 6 Time (min) 0 10 20 30 40 50 60 70 80 90 100 H ea t R el ea se R at e (k W /m 2 ) 0 20 40 60 80 100 120 140 160 M as s (g ) 220 230 240 250 260 270 280 290 300 Heat Release Rate
A1-100035-01.1 39
Figure 39. Temperatures, 12.7 mm thick cement board – Test CCE-14.
Figure 40. Heat release rate and mass, 12.7 mm thick cement board – Test CCE-14. Time (min) 0 10 20 30 40 50 60 70 80 90 100 T ( °C ) 0 100 200 300 400 500 600 700 T em p er at ur e (° C ) 0 100 200 300 400 500 600 700 TC 1 TC 2 TC 3 TC 4 TC 5 Average T 140°C T 195°C T 250°C Pyrometer TC 6 Time (min) 0 10 20 30 40 50 60 70 80 90 100 H e at R e le a se R at e ( kW /m 2 ) 0 20 40 60 80 100 120 140 160 M as s (g ) 240 250 260 270 280 290 300 310 320 Heat Release Rate
Figure 41. Surface temperatures for tests with 12.7 mm thick cement board.
Figure 42. Average temperatures at interface between cement board and plywood for tests with 1 and 2 layers of 12.7 mm thick cement board.
Time (min) 0 10 20 30 40 50 60 70 80 90 100 e m pe ra tu re ( °C ) 0 100 200 300 400 500 600 700 800 900 1000
Pyrometer Test CCE-12 Pyrometer Test CCE-13 Pyrometer Test CCE-14 Pyrometer Test CCE-15 TC 6 Test 1 TC 6 Test 2 Time (min) 0 10 20 30 40 50 60 70 80 90 100 T ( °C ) 0 100 200 300 400 500 600 Test CCE-12 Test CCE-13 Test CCE-14 Test CCE-15 T 140°C T 195°C T 250°C
A1-100035-01.1 41
Figure 43. Heat release rate and mass for tests with 1 and 2 layers of 12.7 mm thick cement board. Time (min) 0 10 20 30 40 50 60 70 80 90 100 H e at R el ea se R at e (k W /m 2 ) 0 20 40 60 80 100 120 140 160 M a ss ( g) 120 140 160 180 200 220 240 260 280 300 320 340 HRR Test CCE-12 HRR Test CCE-13 HRR Test CCE-14 HRR Test CCE-15 Mass Test CCE-12 Mass Test CCE-13 Mass Test CCE-14 Mass Test CCE-15
5.4 Results – 25 and 39 mm Thick Gypsum-concrete
Four tests were conducted using gypsum-concrete as the encapsulation material; two tests with 25 mm thick samples and two tests with 39 mm thick samples. The test setup and initial
conditions are summarized in Table 10.
The ignition times for the gypsum-concrete and the plywood are provided in Table 11. The temperature increase at the gypsum-concrete/plywood interface for Samples 1 – 4 are shown in Figure 44, Figure 46, Figure 48 and Figure 50, respectively. The surface temperature measured using the pyrometer and the surface-mounted thermocouple are also shown in these plots. The heat release rates for the gypsum-concrete samples (Samples 1 – 4) are shown in Figure 45, Figure 47, Figure 49 and Figure 51, respectively. The gypsum-concrete samples were too heavy for the cone load cell system, and during the test the mass did not reduce to the point where it could be measured.
The surface temperature was measured in all tests using a pyrometer and a surface-mounted thermocouple. Both temperature measurements were taken near the center of the exposed surface of the encapsulation material. (The measurement locations were offset from the center of the sample and from each other so that thermocouple did not interfere with the pyrometer measurement.)
The surface temperatures measured in the four tests are plotted in Figure 52. Some general observations based on the surface temperature measurements are as follows:
1. There was an initial rapid increase in the surface temperature immediately after
exposure to the radiant. The initial temperature increase was not as fast as that with the gypsum board samples since, unlike with the gypsum board samples, there was no heat contribution from the gypsum-concrete because the gypsum-concrete had no paper facing. After the initial rapid temperature rise, there was a gradual increase in
temperature until the plywood was ignited. With the ignition of the plywood, there was a peak temperature, which was typically more apparent in the temperature profiles measured by the thermocouple.
2. There was good test-to-test comparison for the temperatures measured using the pyrometer and the surface-mounted thermocouple. The temperatures measured by the surface-mounted thermocouple were also generally comparable to the temperatures measured using the pyrometer in each test. The surface temperatures measured by the thermocouple were higher than those measured by the pyrometer during the initial 20 – 30 min of the test except for Sample 2. Subsequently, the temperatures measured using the two methods were similar until the plywood ignited. The differences in the results are within the accuracy of the two measurement methods, which is approximately ±2% for the thermocouple measurements and approximately ±0.02% for the pyrometer
measurements.
The temperature increases measured at the gypsum-concrete/plywood interface for the individual tests are shown in Figure 44, Figure 46, Figure 48 and Figure 50. The average temperature increase at this location is shown in Figure 53. Some general observations based on the temperature increase results at the gypsum-concrete/plywood interface are as follows: