Current-induced transition from particle-by-particle to
concurrent intercalation in phase-separating battery electrodes
The MIT Faculty has made this article openly available. Please sharehow this access benefits you. Your story matters.
Citation Li, Yiyang; El Gabaly, Farid; Ferguson, Todd R. et al. “Current-Induced Transition from Particle-by-Particle to Concurrent Intercalation in Phase-Separating Battery Electrodes.” Nature Materials 13, 12 (September 2014): 1149–1156 © 2014 Macmillan Publishers Limited, part of Springer Nature
As Published http://dx.doi.org/10.1038/nmat4084
Publisher Nature Publishing Group
Version Author's final manuscript
Citable link http://hdl.handle.net/1721.1/110915
Terms of Use Article is made available in accordance with the publisher's policy and may be subject to US copyright law. Please refer to the publisher's site for terms of use.
1
Current-Induced Transition from Particle-by-Particle to Concurrent Intercalation in Phase-Separating Battery Electrodes
Yiyang Li1, Farid El Gabaly2, Todd R. Ferguson3, Raymond B. Smith3, Norman C. Bartelt2, Joshua D. Sugar2, Kyle R. Fenton4, Daniel A. Cogswell5, A. L. David Kilcoyne6,
Tolek Tyliszczak6, Martin Z. Bazant3,7, William C. Chueh1,8, *
1Department of Materials Science & Engineering, Stanford University, Stanford, CA 94305
2Sandia National Laboratories, Livermore, CA 94551
3Department of Chemical Engineering, Massachusetts Institute of Technology, Cambridge, MA 02139
4Sandia National Laboratories, Albuquerque, NM 87185
5Samsung Advanced Institute of Technology America, Cambridge, MA 02142
6Advanced Light Source, Lawrence Berkeley National Laboratory, Berkeley, CA 94720
7Department of Mathematics, Massachusetts Institute of Technology, Cambridge, MA 02139
8Stanford Institute of Materials and Energy Science, Menlo Park, CA 94025
2
Abstract: Many battery electrodes contain ensembles of nanoparticles that phase-separate upon
(de)intercalation. In such electrodes, the fraction of actively-intercalating particles directly impacts cycle life: a vanishing population concentrates the current in a small number of particles, leading to current hotspots. Reports on the active particle population in the phase-separating electrode lithium iron phosphate (LFP) vary widely, ranging from around 0% (particle-by-particle) to 100% (concurrent intercalation). Using synchrotron-based X-ray microscopy, we probed the individual state-of-charge for over 3,000 LFP particles. We observed that the active population depends strongly on the cycling current, exhibiting particle-by-particle-like behaviour at low rates and increasingly concurrent behaviour at high rates, consistent with our phase-field porous electrode simulations. Contrary to intuition, the current density, or current per active internal surface area, is nearly invariant with the global electrode cycling rate. Rather, the electrode accommodates higher current by increasing the active particle population. This behaviour results from thermodynamic transformation barriers in LFP, and such a phenomenon likely extends to other phase-separating battery materials. We propose that modifying the transformation barrier and exchange current density can increase the active population and thus the current homogeneity. This could introduce new paradigms to enhance the cycle life of phase-separating battery electrodes.
3
Electrochemical systems can provide clean and efficient routes for energy conversion and storage. Many electrochemical devices such as batteries, fuel cells, and supercapacitors consist of porous electrodes containing ensembles of nanoparticles1. For typical microstructures, the particle density can reach as high as 1015 cm-3. To further increase complexity, many intercalation battery electrodes, such as graphite2, lithium iron phosphate3,4, lithium titanate5, and spinel lithium nickel manganese oxide6, phase-separate upon (de)intercalation. Such electrodes are physically and chemically heterogeneous on the nanoscale, and likely exhibit inhomogeneous current distributions.
In phase-separating electrodes, the active particle population is a crucial factor in determining the overall electrode current and the degree of current homogeneity. The electrode current is given by:
∑ ̅ (1)
where is the reaction area of the th actively-intercalating particle, and is the current density of that particle. Under the approximation of similar particle size, we obtain the final expression in equation 1, where ̅ is the average current density of all actively-intercalating particles, is the total internal surface area of all particles (rather than the projected electrode area), and is the so-called active population. When approaches 0%, the electrode intercalates particle-by-particle with a heterogeneous current distribution; when approaches 100%, the electrode intercalates concurrently with a more homogeneous current distribution.
The active population impacts the electrode’s cycle life because it is directly related to the local current density. For example, with a small active population, the electrochemical current is concentrated in a small number of particles, leading to high local current densities and
4
current hotspots that could induce fracture and accelerate capacity fading7,8. Thus, from an electrode engineering perspective, increasing the active population could improve cycle life. On a fundamental level, the active population also affects the fidelity of electrochemical parameters, such as those extracted from electrochemical impedance spectroscopy and potentiostatic intermittent titration.
Lithium iron phosphate (LiFePO4, LFP) is a well-established model system for investigating lithium intercalation in phase-separating nanoparticles. At room temperature, moderately-sized (> 50 nm) LFP particles phase-separate with a negligible solubility of the end-member phases3,9–11. Despite being one of the most intensely studied positive battery electrodes, there exist disagreements about the non-equilibrium intercalation pathway of Li in LFP12. A seemingly contradictory observation is the fraction of actively-intercalating particles, with reports ranging from around 0% (particle-by-particle)13–17 to 100% (concurrent intercalation)18,19. Such discrepancies remain to be reconciled. On the one hand, the so-called “mosaic” particle-by-particle intercalation mechanism has been reported in studies using X-ray diffraction13, electron microscopy14,15, and X-ray microscopy16. Dreyer et al. proposed that the thermodynamic origin of this behaviour arises from the non-monotonic chemical potential of Li as a function of the particle’s composition17. On the other hand, a concurrent intercalation pathway, whereby most particles intercalate at once, has also been observed in LFP18,19.
Despite its crucial importance, the active population has been largely neglected in models describing electrode cycling20–23. Differing approximations in the active population may have contributed to the vast range of experimentally-measured specific exchange current densities, which range from 10-6 A m-2 to 10-1 A m-2 in LFP20–23. The active population has sometimes been considered in terms of an electrode-level lithiation front from the separator to the current
5
collector24. Bai and Tian recently proposed an active particle population model based on nucleation and growth25, which has been used to interpret current transients of an electrode under potentiostatic conditions26,27.
In this work, we employed synchrotron-based scanning transmission X-ray microscopy (STXM) to capture snapshots of the state-of-charge (SoC) of individual LFP particles in electrodes cycled at rates between C/50 and 5.0 C (C indicates the rate it takes to charge or discharge the electrode in 1 h). Using techniques established in our previous work16, we analysed the SoC of individual particles for over 3,000 particles at a spatial resolution of ~ 28 nm. During charge, we observed that only 5 to 8 % of particles are actively-intercalating. Conversely, during discharge, the active population is highly rate-dependent and ranges from 8 to 32 %. Our results show unambiguously that the active population depends strongly on the cycling condition and displays an increasingly concurrent behaviour at higher rates of discharge. As such, the intercalation pathway is not a static property of the electrode, but rather a dynamic one. The active particle behaviour cannot be inferred from macroscopic current-voltage measurements. We used a modified porous electrode model24, which combines porous electrode theory28 with phase-field electrochemical thermodynamics29, to simulate the lithium intercalation behaviour for a 100-particle electrode. We show that the actively-intercalating population is determined by the competition between a transformation barrier and the reaction overpotential needed to (de)lithiate the particles at a given rate. Such insights suggest new pathways toward increasing the current homogeneity in battery electrodes.
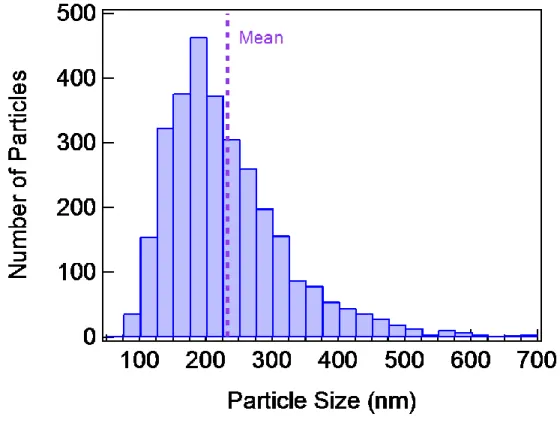
To prepare experimental samples, we electrochemically cycled coin-cell batteries containing a ~ 60-μm-thick LFP positive electrode, fabricated from commercial carbon-coated powder with an average particle size of 230 nm (see Methods and Supplementary section 1).
6
After five formation cycles, we (dis)charged the batteries to the desired SoC, rapidly disassembled them in a dry room or in an Ar-filled glovebox, and rinsed the electrodes with excess dimethyl carbonate. The disassembly process was completed in 4 minutes after terminating the current, except for the electrode discharged at a rate of C/50, which was completed in 10 minutes. By removing the electrolyte faster than the (dis)charging time, we minimized inter-particle lithium transport. As we will show later, a strong dependence of the active particle population on the cycling condition confirms that we preserved the electrode’s non-equilibrium behaviour. Finally, we used an ultramicrotome to cross-section the electrodes into ~ 300 nm-thick strips, each containing one to two particles along the thickness of the cross-section.
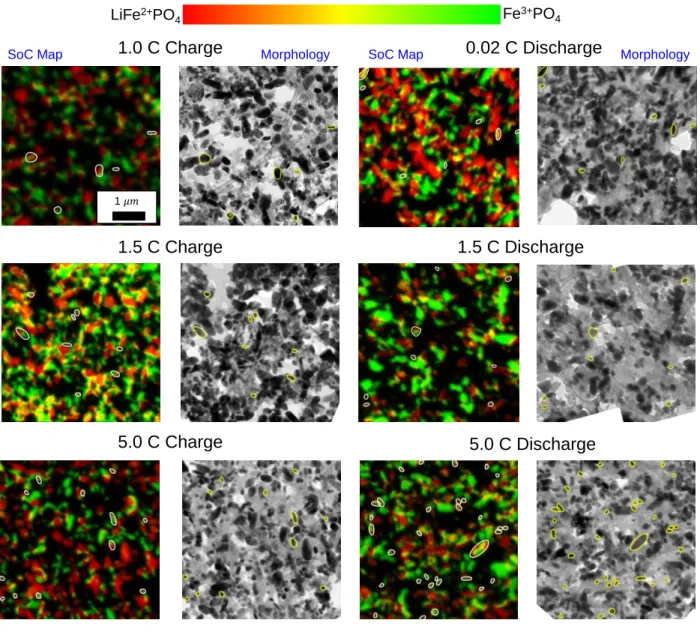
We imaged three to four 5 5 μm regions at different positions along the thickness of each electrode using the STXM at beam line 11.0.230 in the Advanced Light Source (with preliminary measurements done at beam line 5.3.231,32). We raster-scanned the nanosized X-ray beam while varying the photon energy across the Fe L3 absorption edge. The single-pixel SoC is calculated by fitting a linear combination of the LiFePO4 and FePO4 reference spectra (Fig. 1a) to the single-pixel X-ray absorption spectra. As shown recently, the spectroscopically-determined SoC is comparable to the electrochemically-spectroscopically-determined ones16,33. We also confirmed that fully-charged and fully-discharged electrodes indeed contain only the respective end-member phase (Fig. S5), indicating that the entire battery electrode is being cycled. Figure 1b shows a typical SoC map for a region in an electrode. The hue at each pixel represents the SoC, with red as fully lithiated (discharged) and green as fully delithiated (charged). The brightness, on the other hand, represents the particle thickness at each pixel.
7
Before analysing the SoC for individual LFP particles, we averaged the pixels to obtain the mean SoC as a function of the distance from the current collector (Fig. S6). A sharp lithiation front was not detected along the thickness of the electrode, although we observed a small preference for LFP particles near the separator/electrode interface to be delithiated in electrodes charged at higher rates, and vice versa for discharge. This suggests a small Li ion concentration gradient in the electrolyte. To identify particle boundaries as well as overlapped particles, we employed TEM to image the same region in each LFP electrode (Fig. 1c). Figures 1d-f show typical LFP particles and the corresponding Fe L3 absorption spectra averaged over the particles. The linear combination analysis, which was employed to determine the SoC of the particles, yielded excellent fits.
We analysed the total lithium content within individual particles in six different electrodes, each cycled at a different rate. An LFP particle with a SoC between 20-80% is considered actively-intercalating. By defining active particles as being within the coherent solubility limit34, we minimize the misidentification of active particles due to the insufficient signal-to-noise of smaller particles and around particle boundaries. Unlike previous work, our definition does not rely on observing phase boundaries14,18, as they would not be observed during solid-solution filling35–37, nor if they lie perpendicular to the X-ray beam. Sensitivity analysis confirmed that our conclusions are qualitatively independent of the single-particle SoC thresholds (Fig. S8-9). The active particles are outlined in select SoC maps and TEM images (Figs 1b-c and S4). The single-particle SoC analysis confirms that a porous LFP electrode is chemically heterogeneous during cycling: lithium-rich, lithium-poor, and actively-intercalating particles coexist in the same electrode.
8
Figure 2 shows the fraction of actively-intercalating particles in each electrode as a function of charge and discharge rates at a nominally 50% electrode SoC (see Fig. S4 for corresponding SoC maps). For all charging rates between 1.0 C and 5.0 C, the actively-intercalating population ranged from 5 to 8 %, indicating that the LFP ensemble proceeds closely to the particle-by-particle pathway. In other words, the time required to charge individual active particles is a factor of 12-20 less than the electrode charging time. Our results confirm that current is heterogeneously distributed in the electrode: a small number of active particles carry most of the current, regardless of the total electrode charging current. In contrast, on discharge, the actively-intercalating population showed a significant dependence on the rate. Specifically, at a rate of 5.0 C, the actively-intercalating fraction upon discharge (32%) is more than 6 times that during charge (5%). While the active particle fraction varies somewhat across the thickness of the electrode (Fig. S7), the active population of any region in a 5.0 C discharge electrode is clearly larger than that of any other cycling condition.
Summarizing the experimental findings, we observed the onset of a transition between particle-by-particle and concurrent intercalation on discharge. In contrast, all charge rates yielded particle-by-particle-like intercalation behaviour. Based on Eq. 1, the local current density of actively-intercalating particles is higher upon charge than discharge. Such asymmetry is not easily observed in current-voltage measurements because the same reaction overpotential can yield different anodic and cathodic current densities. Our data suggest that the current homogeneity is not only dependent on the cycling rate but also on the direction (i.e., charge vs. discharge). By showing that the active population of an LFP electrode depends strongly on the cycling condition, our experiments reconcile the seemingly contradictory reports of particle-by-particle13–17 and concurrent intercalation pathways18,19: the differing experimental observations
9
result from different sample preparation routes. Fast, chemically delithiated particles, where the complete delithiation occurs within 2 minutes38, resulted in concurrent intercalation, while electrochemically-prepared samples at lower rates resulted in particle-by-particle intercalation.
Next, to understand the origins of the observed heterogeneous current distribution and the transition in the active population dynamics, we simulated the lithium distribution inside 100 particles under constant current cycling using a combined phase-field and porous electrode model24,29, illustrated schematically in Fig. 3. We assume that the local rate of (de)lithiation for a particle is limited by the surface reaction rather than by solid-state diffusion, consistent with previous work24,27,29,36. To describe the diffusional chemical potential, or the derivative of free energy with respect to composition39,40, we employed a one-dimensional Cahn-Hilliard regular solution model with an approximate description of coherency strain34,41:
( ̃ ) ( ̃
̃ ) ̃ ( ̃ ̅ ) (2) where is the regular solution parameter, is the gradient penalty from the Cahn-Hilliard equation, is the coherent stress penalty, is the lithium site concentration, ̃ is the spatially-resolved lithium concentration in the solid normalized to the number of Li sites, ̅ is the average filling fraction of the particle, and and have the usual meanings. The composition-dependent has roughly the same shape upon charge and discharge in this model34. Next, we generalize Butler-Volmer kinetics29 to describe the Li insertion rate consistently with the Cahn-Hilliard model: [ ( ) (( ) )] (3)
10
where is the rate constant, and are the respective activities of lithium in the solid particles and in the electrolyte, is the elementary charge, is the reaction overpotential at the LFP/carbon/electrolyte triple-phase boundary, and is the activity coefficient of the transition state representing excluded sites. We use as a phenomenological parameter to capture the experimentally-observed asymmetry between charge and discharge. Such an asymmetry may also result from an asymmetry in 37 or in kinetic parameters42–44. We neglect deviations form Butler-Volmer kinetics at high reaction overpotentials that has recently been observed in LFP27. Finally, we consider ionic diffusion and migration losses at the porous electrode level (Eqs. S1-5). The model neglects microscopic variations in the electrode in the plane of the current collector. Because transport in the electrolyte is fast (Fig. S6), such variations should not yield significant deviations in the intercalation behaviour of the porous electrode investigated in this work. See Supplementary section 5 for details of the model.
We fit the active particle population predicted by the model to the experimental results, with and as fitting parameters (Fig. 2). We obtain good fits, with an of 0.2 and a of 0.6 A m-2, yielding an average exchange current density of ~ 0.3 A m-2. The exchange current density is higher than most reported values in literature; however, past work did not consider the active particle fraction and likely overestimated the active reaction area20–23. The fittings may also be affected by departures from Butler-Volmer kinetics at high rates that that lead to curved Tafel plots and small effective values of 27. Figure 4a plots the active particle population and active particle current density as a function of discharging rate. Due to high current densities (Fig. 4a), the model predicts solid-solution-like filling within a particle, consistent with previous simulations24,36. The corresponding SoC maps are shown in Fig. 4b-e.
11
Several important insights arise from our experiments and simulations. For discharge rates up to 5.0 C, we observed experimentally that the active particle population increases with rate, which is also captured in our simulations (Fig. 4a-c). In other words, the LFP electrode accommodates the increased current by increasing the active population. The current density of active particles is nearly invariant with the discharge rate in the simulations (Fig. 4a). Above a simulated discharge rate of 10 C, the active population saturates, but does not reach 100% because our active particle definition (between 20-80% SoC) is smaller than the miscibility gap of LFP. We define crit as the critical current at which 65% of particles are active; above crit, the current density increases significantly with the discharge rate (Fig. 4a).
We explain the above results using the presence of transformation barriers in LFP, and broadly in phase-separating electrodes. Figure 5a shows the diffusional chemical potential of Li ( ) in a typical particle upon lithiation; contains a local maxima (transformation barrier, Δ ) at the composition LibFePO4. In these simulations, we take the transformation barrier to be equal upon charge and discharge, where asymmetry is accounted for phenomenologically through When the electrode ensemble potential lies below the transformation barrier, the particle cannot lithiate past LibFePO4 and does not activate. When the electrode ensemble potential nears the top of the transformation barrier (at the blue dashed line), some particles activate and lithiate further. The particles that do not activate sustain the electrode ensemble potential near the top of the transformation barrier. The driving force (i.e., reaction overpotential) for lithium insertion past composition LibFePO4 is the difference between the top of the transformation barrier (blue dashed line) and (black line).
12
Figure 5b plots the simulated reaction overpotential and the corresponding current density of a typical active particle. In regime 1, both quantities are approximately constant with rate: while the global discharge rate increases by a factor of 20, the reaction overpotential and current density increases by less than 50%. The slow increase in reaction overpotential with discharge rate in regime 1 arises from electrolyte transport losses and variations in particle size. The active population is determined by the average time needed to fill or empty a particle at a reaction overpotential ( ) approximately equal to the transformation barrier height (Δ ). This results in a high current density for each active particle, even at vanishing rates of discharge, in accordance with Eq. 1. The system responds to an increased current by increasing the number of actively-intercalating particles (Fig. 4a).
In regime 2, where the electrode current exceeds crit , the electrode attains concurrent intercalation, and the active particle population saturates. In other words, the surface area available for intercalation in the electrode is maximized. Raising the reaction overpotential above Δ (to , purple dotted lines in Fig 5a) does not further increase the particles’ activation rate. Instead, the additional reaction overpotential beyond Δ increases the particles’ current density (Figs 4a and 5b). At extremely high rates, Δ becomes insignificant compared to the reaction overpotential.
Within regime 1, our simulations also predict the experimentally observed asymmetry in the active particle population between charge and discharge. During charging, the current density of an active particle is high due to the phenomenological parameter , resulting in a large Li intercalation rate at a reaction overpotential equal to Δ . In contrast, the same overpotential yields a much smaller current density under discharge. The asymmetry in the active
13
particle population is not necessarily reflected in the galvanostatic voltage profiles—the same reaction overpotential magnitude can result in different anodic and cathodic current densities, and thus an asymmetry in the active particle population in accordance with Eq. 1.
As evident in the above discussions, the active population dynamics in LFP result from the transformation barriers, which arise from the diffusional chemical potential. While our phase-field simulations predict solid-solution-like particles, we observe the same active particle dynamics for phase-separating particles in the absence of coherency strain (Fig. 4a). Modifying the transformation barrier height yields similar transitions between particle-by-particle and concurrent intercalation (Fig. S11), suggesting that such active particle dynamics likely extend to other phase-separating materials. For all simulated conditions, we observe large current densities even at vanishing rates of discharge.
Our simulations also suggest that the reaction overpotential should be weakly dependent on the discharge rate in regime 1 (Fig. 5b). The experimentally measured voltage, however, shows a strong Ohmic-like dependence (Figs S3 and S10). Low percolation of the carbon network (with a technologically-relevant carbon loading of 6 wt%) likely leads to weakly-connected patches in the electrode that rely on interparticle contact resistance for electronic transport22, resulting in the observed Ohmic resistance. The sequence in which particles (de)lithiate is determined by their distance from the closest carbon network (Fig. S13a) rather than by the distance from the current collector or separator, consistent with Fig. S6. Indeed, increasing the carbon loading to 20 wt% strongly suppressed the voltage’s dependence on cycling rate (Fig. S10). Using our phase-field model, we examined the effect of electronic wiring45 on the active population dynamics. The simulation (Fig. S13) confirms that the qualitative features of the observed active particle dynamics are not significantly affected by
14
wiring. Therefore, while wiring contributes significantly to the measured voltage, it alone cannot lead to the active particle dynamics observed in the experiments. Similarly, we also show that electrochemical heterogeneities do not significant alter the qualitative behaviour of the active population (Fig. S14).
From an electrode engineering perspective, the cycling rate is an important factor in determining the cycle life of Li-ion batteries, as high current densities result in current hotspots and electromechanical shocks and fractures7,8. However, it is not the global cycling rate, but the local current per active surface area that determines the extent of shocks and fractures. Because the local current density is not easily determined by macroscopic current and voltage measurements, the global cycling rate is commonly used in its place in conjunction with a homogeneous electrode or an electrode-transport-limited assumption (Fig. 6). Our results demonstrate that the local current density can be high for active particles even when the global electrode cycling rate is low (Figs 4a and 5b), a result of the transformation barrier in phase-separating electrodes. Thus, using the global cycling rate to predict the local cycling rate can lead to erroneous predictions (Fig. 6).
Enhancing cycle life by reducing the local current density may come from increasing the active population and more evenly distributing the current. Our work suggests that a potentially viable method is to decrease the transformation barrier height ( ). As we have shown earlier, the reaction overpotential is approximately equal to in regime 1. Thus, at a given cycling rate, a lower barrier reduces the local current density, increases the active particles fraction, and improves the current homogeneity (Fig. S11). There is growing evidence that the transformation barrier height can be controlled by nanostructuring and chemical modifications. For instance, the nucleation barrier in a phase-separating material was shown to be inversely proportional to the
15
surface area to volume ratio of the nanoparticles34. Additionally, Nb doping46 and V substitution47 in LFP reduce the lattice mismatch and increase the solubility limits, both strong indicators of decreased transformation barrier. Mn substitution in LiFePO4, on the other hand, has been shown to eliminate the nucleation barrier and result in extensive solid solubility upon lithiation48. Yet another somewhat counter-intuitive route is to lower the reaction rate and exchange current density, which would increase the active particle population. Our results suggest that modifying the reaction rate, such as through surface coating49, surface modification50, and electrolyte additives could be used to control the active particle population and current homogeneity. We note, however, that the lower reaction rate may increase the electrode energy dissipation.
In summary, by analysing the individual state-of-charge of over 3,000 LFP particles cycled at different rates, we observed that the fraction of active particles is highly dependent on cycle rate and direction. The contradictory reports of particle-by-particle and concurrent intercalation pathways can be reconciled by considering the different electrochemical conditions. By combining experimental observation with phase-field simulations, we show that the active particle population is governed by the competition between a thermodynamic transformation barrier and the reaction overpotential needed to insert or extract lithium. Contrary to intuition, the current density, or current per active internal surface area, is nearly invariant with the global electrode cycling rate under typical cycling conditions, and even low rates of charge and discharge can produce high local current densities. Such behaviour likely occurs in other phase-separating battery materials that contain a transformation barrier. We propose that increasing the active population, through strategies like manipulating the transformation barrier and exchange
16
current density, can improve current uniformity and cycle life in phase-separating battery electrodes.
17
Methods & Materials
For state-of-charge imaging experiments, the electrodes consist of 88 wt% carbon-coated LFP (Mitsui Engineering Shipbuilding Co. Ltd, particle size distribution shown in Fig. S1), 6 wt% polyvinylidene fluoride (PVDF), and 6 wt% Shawinigan acetylene black carbon. PVDF was first dissolved in N-methyl-2-pyrrolidone. LFP and carbon black were added to the slurry to obtain a viscosity of ~ 200 cP. The slurry was then cast onto a carbon-coated aluminium current collector using a reverse comma coater Solvent was dried at 100˚C in ambient and subsequently dried under vacuum at 100o C for ~12 h. The electrode mass loading and thickness were ~ 9 mg cm-2 and 60 μm, respectively Finally, the LFP electrode was assembled in a 2032 coin cell, which consisted of a Li anode, a 50 μm Tonen separator, and 1 2 M LiPF6 in 3:7 (wt/wt) ethylene carbonate: ethyl methyl carbonate electrolyte.
We performed five charge (C/12) and discharge (C/6) formation cycles. The termination voltages were 3.8 V for charge and 2.5 V for discharge. A stable capacity of ~ 150 mAh g-1 was attained. For subsequent charging and discharging, the rates were calculated by the actual capacity. Figure S2 shows the typical charging and discharging curves at low rates, and Fig. S3 shows the curves for partially-charged and partially-discharged electrodes used in the SoC imaging experiments.
For more information on X-ray image analysis and phase-field modelling, see the Supplementary Information.
18
References
1. Aricò, A. S., Bruce, P., Scrosati, B., Tarascon, J.-M. & Van Schalkwijk, W.
Nanostructured materials for advanced energy conversion and storage devices. Nature Mater. 4, 366–377 (2005).
2. Ohzuku, T., Iwakoshi, Y. & Sawai, K. Formation of Lithium-Graphite Intercalation Compounds in Nonaqueous Electrolytes and Their Application as a Negative Electrode for a Lithium Ion (Shuttlecock) Cell. J. Electrochem. Soc. 140, 2490–2498 (1993). 3. Padhi, A. K., Nanjundaswamy, K. S. & Goodenough, J. B. Phospho-olivines as
Positive-Electrode Materials for Rechargeable Lithium Batteries. J. Electrochem. Soc. 144, 1188– 1194 (1997).
4. Tang, M., Carter, W. C. & Chiang, Y.-M. Electrochemically Driven Phase Transitions in Insertion Electrodes for Lithium-Ion Batteries: Examples in Lithium Metal Phosphate Olivines. Annu. Rev. Mater. Res. 40, 501–529 (2010).
5. Ohzuku, T., Ueda, A. & Yamamoto, N. Zero-Strain Insertion Material of Li[Li1/3Ti5/3]O4 for Rechargeable Lithium Cells. J. Electrochem. Soc. 142, 1431–1435 (1995).
6. Ariyoshi, K., Iwakoshi, Y., Nakayama, N. & Ohzuku, T. Topotactic Two-Phase Reactions of Li[Ni1/2Mn3/2]O4 (P4332) in Nonaqueous Lithium Cells. J. Electrochem. Soc. 151, A296–A303 (2004).
7. Woodford, W. H., Chiang, Y.-M. & Carter, W C “Electrochemical Shock” of Intercalation Electrodes: A Fracture Mechanics Analysis. J. Electrochem. Soc. 157, A1052–A1059 (2010).
8. Christensen, J. & Newman, J. Stress generation and fracture in lithium insertion materials. J. Solid State Electrochem. 10, 293–319 (2006).
9. Yamada, A. et al. Room-temperature miscibility gap in LixFePO4. Nature Mater. 5, 357–360 (2006).
10. Meethong, N., Huang, H.-Y. S., Carter, W. C. & Chiang, Y.-M. Size-Dependent Lithium Miscibility Gap in Nanoscale Li1-xFePO4. Electrochem. Solid-State Lett. 10, A134–A138 (2007).
11. Wagemaker, M. et al. Dynamic Solubility Limits in Nanosized Olivine LiFePO4. J. Am. Chem. Soc. 133, 10222–10228 (2011).
12. Malik, R., Abdellahi, A. & Ceder, G. A Critical Review of the Li Insertion Mechanisms in LiFePO4 Electrodes. J. Electrochem. Soc. 160, A3179–A3197 (2013).
19
13. Delmas, C., Maccario, M., Croguennec, L., Le Cras, F. & Weill, F. Lithium
deintercalation in LiFePO4 nanoparticles via a domino-cascade model. Nature Mater. 7, 665–671 (2008).
14. Brunetti, G. et al. Confirmation of the Domino-Cascade Model by LiFePO4/FePO4 Precession Electron Diffraction. Chem. Mater. 23, 4515–4524 (2011).
15. Sugar, J. D. et al. High-resolution chemical analysis on cycled LiFePO4 battery electrodes using energy-filtered transmission electron microscopy. J. Power Sources 246, 512–521 (2014).
16. Chueh, W. C. et al. Intercalation Pathway in Many-Particle LiFePO4 Electrode Revealed by Nanoscale State-of-Charge Mapping. Nano Lett. 13, 866–872 (2013).
17. Dreyer, W. et al. The thermodynamic origin of hysteresis in insertion batteries. Nature Mater. 9, 448–453 (2010).
18. Laffont, L. et al. Study of the LiFePO4/FePO4 Two-Phase System by High-Resolution Electron Energy Loss Spectroscopy. 152, 5520–5529 (2006).
19. Badi, S.-P. et al. Direct synthesis of nanocrystalline Li0.90FePO4: observation of phase segregation of anti-site defects on delithiation. J. Mater. Chem. 21, 10085–10093 (2011). 20. Srinivasan, V. & Newman, J. Discharge Model for the Lithium Iron-Phosphate Electrode.
J. Electrochem. Soc. 151, A1517–A1529 (2004).
21. Yu, D. Y. W., Donoue, K., Inoue, T., Fujimoto, M. & Fujitani, S. Effect of Electrode Parameters on LiFePO4 Cathodes. J. Electrochem. Soc. 153, A835–A839 (2006). 22. Dargaville, S. & Farrell, T. W. Predicting Active Material Utilization in LiFePO4
Electrodes Using a Multiscale Mathematical Model. J. Electrochem. Soc. 157, A830– A840 (2010).
23. Prada, E. et al. Simplified Electrochemical and Thermal Model of LiFePO4-Graphite Li-Ion Batteries for Fast Charge Applications. J. Electrochem. Soc. 159, A1508–A1519 (2012).
24. Ferguson, T. R. & Bazant, M. Z. Nonequilibrium Thermodynamics of Porous Electrodes. J. Electrochem. Soc. 159, A1967–A1985 (2012).
25. Bai, P. & Tian, G. Statistical kinetics of phase-transforming nanoparticles in LiFePO4 porous electrodes. Electrochim. Acta 89, 644–651 (2013).
26. Levi, M. D. et al. Collective Phase Transition Dynamics in Microarray Composite LixFePO4 Electrodes Tracked by in Situ Electrochemical Quartz Crystal Admittance. J. Phys. Chem. C 117, 15505–15514 (2013).
20
27. Bai, P. & Bazant, M. Z. Charge transfer kinetics at the solid-solid interface in porous electrodes. Nature Commun. 5, 3585 (2014).
28. Newman, J. & Thomas-Alyea, K. E. Electrochemical Systems. (Prentice Hall, 2004). 29. Bazant, M. Z. Theory of Chemical Kinetics and Charge Transfer based on Nonequilibrium
Thermodynamics. Acc. Chem. Res. 46, 1144–1160 (2013).
30. Bluhm, H. et al. Soft X-ray microscopy and spectroscopy at the molecular environmental science beamline at the Advanced Light Source. J. Electron Spectros. Relat. Phenomena
150, 86–104 (2006).
31. Kilcoyne, A. L. D. et al. Interferometer-controlled scanning transmission X-ray
microscopes at the Advanced Light Source. J. Synchrotron Radiat. 10, 125–136 (2003). 32. Kilcoyne, D. et al. A new Scanning Transmission X-ray Microscope at the ALS for
operation up to 2500eV. in 10th Int. Conf. Synchrotron Radiat. Instrum. 465–468 (2010). 33. Liu, X. et al. Phase Transformation and Lithiation Effect on Electronic Structure of
LixFePO4: An In-Depth Study by Soft X-ray and Simulations. J. Am. Chem. Soc. 134, 13708–13715 (2012).
34. Cogswell, D. A. & Bazant, M. Z. Theory of Coherent Nucleation in Phase-Separating Nanoparticles. Nano Lett. 13, 3036–3041 (2013).
35. Gibot, P. et al. Room-temperature single-phase Li insertion/extraction in nanoscale LixFePO4. Nature Mater. 7, 741–747 (2008).
36. Bai, P., Cogswell, D. A. & Bazant, M. Z. Suppression of Phase Separation in LiFePO4 Nanoparticles During Battery Discharge. Nano Lett. 11, 4890–4896 (2011).
37. Malik, R., Zhou, F. & Ceder, G. Kinetics of non-equilibrium lithium incorporation in LiFePO4. Nature Mater. 10, 587–590 (2011).
38. Yu, X. et al. High rate delithiation behaviour of LiFePO4 studied by quick X-ray absorption spectroscopy. Chem. Commun. 48, 11537–9 (2012).
39. Cahn, J. W. On Spinodal Decomposition. Acta Metall. 9, 795–801 (1961).
40. Allen, S. M. & Cahn, J. W. A Microscopic Theory for Antiphase Boundary Motion and its Application to Antiphase Domain Coarsening. Acta Metall. 27, 1085–1095 (1979).
41. Cogswell, D. A. & Bazant, M. Z. Coherency strain and the kinetics of phase separation in LiFePO4 nanoparticles. ACS Nano 6, 2215–2225 (2012).
21
42. Morgan, D., Van der Ven, A. & Ceder, G. Li Conductivity in LixMPO4 (M = Mn, Fe, Co, Ni) Olivine Materials. Electrochem. Solid-State Lett. 7, A30–A32 (2004).
43. Srinivasan, V. & Newman, J. Existence of Path-Dependence in the LiFePO4 Electrode. Electrochem. Solid-State Lett. 9, A110–A114 (2006).
44. Orvananos, B., Ferguson, T. R., Yu, H.-C., Bazant, M. Z. & Thornton, K. Particle-Level Modeling of the Charge-Discharge Behavior of Nanoparticulate Phase-Separating Li-Ion Battery Electrodes. J. Electrochem. Soc. 161, A535–A546 (2014).
45. Gaberscek, M., Küzma, M. & Jamnik, J. Electrochemical kinetics of porous, carbon-decorated LiFePO4 cathodes: separation of wiring effects from solid state diffusion. Phys. Chem. Chem. Phys. 9, 1815–1820 (2007).
46. Meethong, N., Huang, H.-Y. S., Speakman, S. A., Carter, W. C. & Chiang, Y.-M. Strain Accommodation during Phase Transformations in Olivine-Based Cathodes as a Materials Selection Criterion for High-Power Rechargeable Batteries. Adv. Funct. Mater. 17, 1115– 1123 (2007).
47. Omenya, F. et al. Why Substitution Enhances the Reactivity of LiFePO4. Chem. Mater. 25, 85–89 (2013).
48. Ravnsbæk, D. B. et al. Extended Solid Solutions and Coherent Transformations in Nanoscale Olivine Cathodes. Nano Lett. 14, 1484–91 (2014).
49. Kang, B. & Ceder, G. Battery materials for ultrafast charging and discharging. Nature 458, 190–3 (2009).
50. Park, K. et al. Enhanced Charge-Transfer Kinetics by Anion Surface Modification of LiFePO4. Chem. Mater. 24, 3212–3218 (2012).
22
Acknowledgements
The research at Stanford was supported by Samsung Advanced Institute of Technology Global Research Outreach program, and by startup funding from Stanford School of Engineering and Precourt Institute for Energy. Support for the research at MIT was provided by the Samsung-MIT Program for Materials Design in Energy Applications. The research at Sandia was supported by U.S. Department of Energy through the Sandia Laboratory Directed research and Development program under Contract DE-AC04-94AL85000. The Advanced Light Source is supported by the Director, Office of Science, Office of Basic Energy Sciences, of the U.S. Department of Energy under Contract No. DE-AC02-05CH11231. Beam line 5.3.2.1 at the Advanced Light Source was funded through a donation by the King Abdullah University of Science and Technology. Y. L. was supported by the National Science Foundation Graduate Research Fellowship under Grant No. DGE-114747. We acknowledge Mark Homer of Sandia and John Perrino of Stanford for ultramicrotoming. We thank Johanna Nelson Weker of the Stanford Synchrotron Radiation Lightsource for insightful discussions.
Author Contributions
Y. L., F. E. G., and W. C. C. conceived the experiments. K. F. and F. E. G. prepared the LFP samples for imaging. Y. L., T. T., and A. L. D. K. performed the SoC imaging. J. D. S. and Y. L. performed the TEM imaging. Y. L. analysed the active particle population from the images. T. F., R. B. S., and D. A. C. conceived and created the phase-field model. W. C. C. and M. Z. B. supervised the project. All authors participated in writing the manuscript.
23
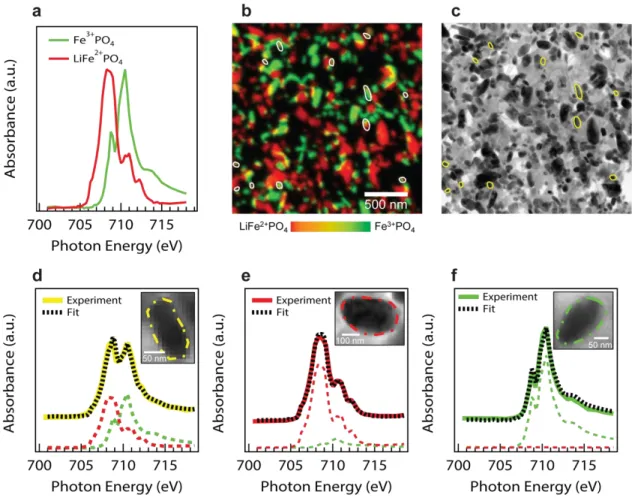
Fig. 1: Lithium fraction within each particle of an electrode charged at 5.0 C to 50% SoC
(a) Reference X-ray absorption spectra for fully lithiated and delithiated particles The state-of-charge map in (b) was produced by fitting a linear combination of the references to every single-pixel spectra The hue represents lithium fraction, and the brightness designates the particle thickness We used the TEM image of the same electrode regions (c), which also includes faint features of carbon black and the binder, to identify the boundary of each particle We outline actively-intercalating particles in (b) and (c) (d)-(f) show typical particles and their absorption spectra
24
Fig. 2: Active particle fraction as a function of cycling condition. The fraction of
actively-intercalating particles varies as a function of rate in both the experiments and the phase-field simulations. The experimental error bars are calculated assuming a binomial distribution (active or not active) taken at three standard deviations. We reanalysed data from our previous work for the 1.0 C charge experiment16.
25
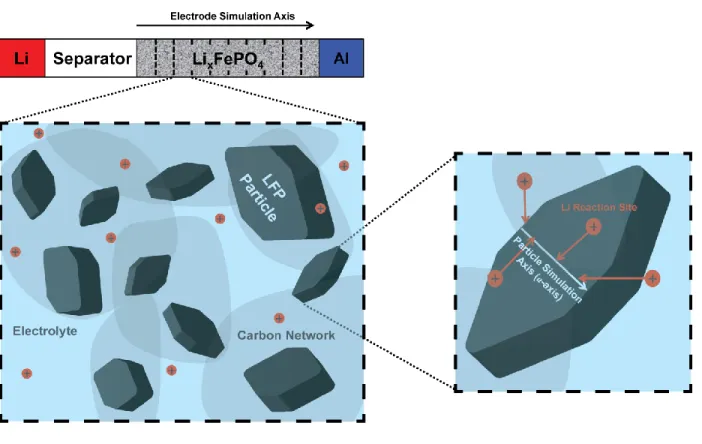
Fig. 3: Schematic of the combined porous electrode and phase-field model. We divide the
LFP electrode into 10 representative volumes, each containing 10 LFP particles immersed in a liquid electrolyte and connected electronically through the carbon network A one-dimensional Cahn-Hilliard equation (Eq 2) governs the Li diffusional chemical potential along the a-axis of each particle A Butler-Volmer equation (Eq 3) governs the insertion and removal of Li
26
Fig. 4: Results from combined phase-field and porous electrode simulations of LFP (a)
plots the active particle fraction and current density as a function of discharge rate at a 50% SoC Simulation results using a phase-separating approximation are also shown For all rates less than crit, higher current increases the number of active particles, but the average current density for
27
the active particles remains approximately constant with discharge rate Once the active particle fraction saturates, the current density increases in regime 2 (b)-(e) show simulation snapshots of 50% discharged electrodes at different rates; the hue represents the lithiation fraction in the snapshots A preferential lithiation of the small particles result in a larger number of lithiated (red) particles in the simulation; due to wiring, such preferential lithiation of small particles is not observed experimentally (Fig S13) To show smaller particles in this figure, the length of the particles in the schematic is proportional to the square root of the experimentally-measured particle length (Fig S1)
28
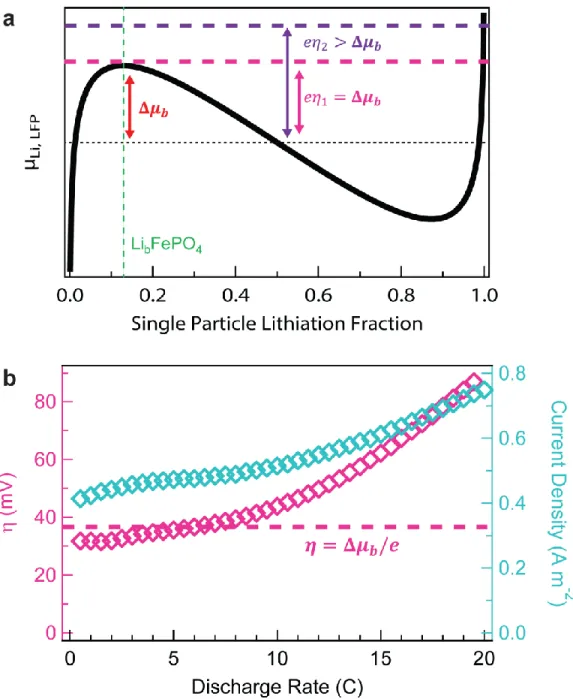
Fig. 5: Simulated behaviour of a typical LFP particle. (a) shows the diffusional chemical
potential of Li as a function of the particle’s lithiation fraction contains a transformation barrier (Δ ), defined as the difference between the local maxima and the diffusional chemical potential at the centre of the miscibility gap (b) plots the particle’s reaction overpotential and current density as a function of discharge rate when the particle’s SoC is 50% Because we
29
assume solid-state diffusion to be fast, the reaction overpotential is entirely consumed by the surface reaction through Eq. 3. In regime 1, the electrode ensemble potential is approximately equal to the top of the transformation barrier because not all particles are active, so the reaction overpotential for active particles is approximately equal to Δ . In regime 2, the reaction overpotential is above Δ , so all particles lithiate concurrently. The reaction overpotential and current density of the particle increase with discharge rate to accommodate the extra current. We note that the current density here is somewhat higher than in Fig. 4a because one typical particle is considered, whereas in Fig. 4a the current density is averaged over all active particles.
30
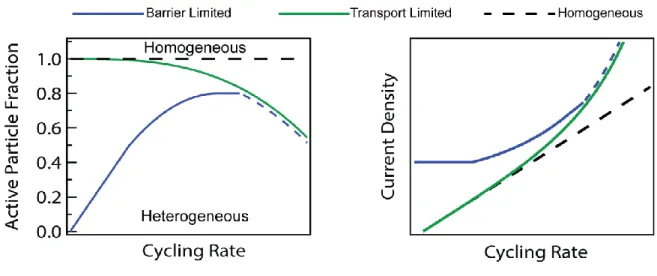
Fig. 6: Schematic representation of the proposed transformation-barrier-limited model against prevailing models. A homogeneous electrode assumes that the current is distributed
evenly to all particles, so the current density increases uniformly with cycling rate. An electrode-transport-limited model results in an electrode-level moving front24 and reduced active particle population at high rates, but the current distribution is homogeneous at lower rates. In our transformation-barrier-limited model, the active particle population is small at low rates, indicating a low degree of current homogeneity. At higher rates, the current homogeneity increases, but electrode transport likely limits the active particle population at very high rates (dashed blue lines).
31
Current-Induced Transition from Particle-by-Particle to Concurrent Intercalation in Phase-Separating Battery Electrodes
Supplementary Information
Yiyang Li, Farid El Gabaly, Todd R. Ferguson, Raymond B. Smith, Norman C. Bartelt, Joshua D. Sugar, Kyle R. Fenton, Daniel A. Cogswell, A. L. David Kilcoyne,
Tolek Tyliszczak, Martin Z. Bazant, William C. Chueh *
32
1. Battery Powder Particle Size Distribution and Electrochemical Cycling
Fig. S1: Lithium iron phosphate (LFP) particle size distribution. The particle size,
determined from the transmission electron micrographs, is defined as the length of the longest distance between any two points in the particle that passes through the particle’s centre of gravity. This histogram includes all LFP particles analysed in this work.
33
Fig. S2: Typical charge and discharge curves.
3.6
3.2
2.8
V
ol
tag
e (V
)
160
120
80
40
0
Capacity (mAh g
-1)
C/12 Charge C/6 Discharge34
Fig. S3 Electrochemical preparation of the LFP electrodes imaged by X-ray microscopy (a)
The 5 0 C charge, 1 0 C charge, 0 02 C discharge, 1 5 C discharge, and 5 0 C discharge electrodes were prepared under constant current conditions (b) The 1 5 C charge electrode was prepared under potentiostatic conditions at 3 8 V Because the current is approximately constant past 5 mAh g-1, the result is comparable to the galvanostatically-cycled samples
4.0
3.6
3.2
2.8
V
ol
tag
e (V
)
80
60
40
20
0
Capacity (mAh g
-1)
5.0 C Charge 1.0 C Charge 0.02 C Discharge 1.5 C Discharge 5.0 C Dischargea
b
400
300
200
100
0
Curr
ent (mA g
-1)
80
60
40
20
0
Capacity (mAh g
-1)
3.80 V Potentiostatic Charge35
2. X-ray Microscopy and Analysis
LiFePO4 and FePO4 references
After five formation cycles, we cycled lithium iron phosphate (LFP) electrodes at C/50 to 3.8 V or 2.5 V to generate charged (Fe3+PO4) and discharged (LiFe2+PO4) reference samples. After cycling, we disassembled the references and loaded some of the powder onto Si3N4 windows. We raster-scanned ~ 2 2 µm regions while varying the X-ray photon energy across the Fe L3 absorption edge, and averaged the single-pixel spectrum to yield the fully charged and discharged reference spectra (Fig. 1a).
State-of-Charge Maps
To obtain state-of-charge (SoC) maps, we raster-scanned several 5 5 µm regions in each electrode. At each region, we obtained about 28 images, each at a different photon energy, across the Fe L3 absorption edge. Post-processing was carried using Axis20001. After aligning the images acquired at different photon energies, we converted transmission images to optical density images.
We fitted a linear combination of the LiFe2+PO4 and Fe3+PO4 reference spectra to the optical density at each pixel. The results were used to generate the SoC maps. The pixel brightness is given by the total optical density (i.e., thickness of the sample), whereas the hue represents the fraction of LiFePO4 and FePO4. A red hue is assigned to the pure LiFePO4 state (0% SoC), and a green hue is assigned to the pure FePO4 state (100% SoC). To confirm the robustness of the reference samples, we generated state-of-charge (SoC) maps for electrochemically-cycled FePO4 and LiFePO4 (Fig. S5), which show that they are fully charged and discharged, respectively.
36
Average State-of-Charge
We calculated the average SoC of each region by averaging the single-pixel SoC weighed by the thickness (Fig. S6). On charging, regions closer to the separator have a slightly higher SoC; on discharging, regions closer to the separator have a slightly lower SoC. In both cases the dependence is weak. This implies that ionic transport across the thickness of the electrode is slightly slower than electronic transport. At low rates, the average SoC matches the electrochemically-determined values well. At higher rates, however, some deviations are observed. We attribute this to heterogeneity electronic and ionic wiring in the porous electrode, which would result in certain regions being more charged or discharged than others.
Single-particle State-of-Charge
To carry out single-particle SoC analysis, we first traced well-isolated particles in the transmission electron micrographs. Typically, we identified between 120 and 200 particles in each 5 5 µm region. Next, we correlated each particle in the transmission electron micrograph to the corresponding particle in the SoC map. Particles with a SoC between 20% and 80% are identified as actively intercalating (see main text for detailed discussions). Figures 1b-c and S4 highlights the active particles for an imaged region in each electrode.
37
Fig. S4: SoC map and corresponding TEM 1 0.02 C Discharge 1.5 C Discharge 5.0 C Discharge 1.5 C Charge 1.0 C Charge 5.0 C Charge LiFe2+PO 4 Fe3+PO4
38
Fig. S5: SoC maps for LiFePO4 and FePO4 Discharged Reference SoC: 1% Charged Reference SoC: 98% 400 nm LiFe2+PO 4 Fe3+PO4 400 nm
39
Fig. S6: State-of-Charge as a function of position in the LFP electrode for (a) charging and (b) discharging electrodes. The absence of a strong (de)lithiation front shows that electrolyte
transport in the porous electrode is fast.
1.0
0.8
0.6
0.4
0.2
0.0
S
ta
te
-of-C
ha
rge
60
50
40
30
20
10
0
Distance from Current Collector (µm)
1.0 C Charge 1.5 C Charge 5.0 C Charge
1.0
0.8
0.6
0.4
0.2
0.0
S
ta
te
-of-C
ha
rge
60
50
40
30
20
10
0
Distance from Current Collector (µm)
0.02 C Discharge 1.5 C Discharge 5.0 C Discharge
a
b
40
Fig. S7: Position dependence of the active particle fraction in the electrode. The active
particle fraction does not significantly vary with position. All LFP electrodes are 60 μm thick from the current collector to the separator, except for the 1.0 C electrode, which is 35 μm thick. The error bars are calculated assuming a binomial distribution (active or not active) taken at three standard deviations.
0.6
0.5
0.4
0.3
0.2
0.1
0.0
Ac
ti
v
e Pa
rtic
le Fr
ac
ti
on
60
50
40
30
20
10
0
Distance from Current Collector (µm)
1.0 C Charge 1.5 C Charge 5.0 C Charge 0.02 C Discharge 1.5 C Discharge 5.0 C Discharge
41
3. Sensitivity Analysis
We performed two sensitivity analyses on our quantification protocol. We first evaluated the sensitivity of the actively-intercalating population to the particle selection method. In the first method (which we adopted in this work), we considered only well-isolated particles thicker than ~ 40 nm. In the second method, we considered thin particles as well as moderately overlapped particles. Figure S8 shows the actively-intercalating particle population determined using these two quantification methods. The active particle fraction is nearly independent of the particle selection protocol.
Next, we evaluated the sensitivity of the active population to the threshold of actively-intercalating particles. Specifically, we compared using a (1) 20-80% SoC and (2) 10-90% SoC definition for active particles (Fig. S9). The active particle fraction is higher for the 10-90% threshold than the 20-80% threshold. This is expected as some Li-rich and Li-poor particles may have been misidentified as active due to insufficient signal-to-noise when using 10-90% threshold. However, the qualitative trends (rate dependence and asymmetry between charge and discharge) remain independent of the quantification protocol.
42
Fig. S8: Sensitivity of the active population to the particle selection method. The two
methods here differ in the definition of a particle, but yield similar results (see main text for details). The error bars equal three standard deviations assuming the particles follow a binomial state (active or not active).
43
Fig. S9: Sensitivity of the active population to the active particle definition. The first
technique defines a particle between 20-80% SoC as an active particle. The second technique defines it as between 10-90% SoC. While the active particle fraction is higher with the 10-90% threshold, the qualitative trends (rate dependence and asymmetry between charge and discharge) remain independent of the quantification method. The error bars equal three standard deviations assuming the particles obey a binomial state (active or not active). One region in each electrode was analysed, thus giving different active particle fractions and larger error bars than those plotted in Figs 2 and S8, which included all imaged regions.
44
4. Carbon Loading Variation
To confirm that most of the voltage results from Ohmic losses in the porous electrode, we compared the voltage of coin cells with 5 wt% and 20 wt% carbon loading. The electrodes consist of 74 wt% or 89 wt% carbon-coated lithium iron phosphate (LFP), 5 wt% or 20 wt% acetylene black (Alfa Aesar 45527), and 6 wt% polyvinylidene fluoride (PVDF). PVDF was dissolved in N-methyl-2-pyrrolidone (NMP); LFP and acetylene black were added to the slurry and stirred for ~ 18 h at 1,000 rpm. The NMP: solid ratio was 3.5:1.0 (wt/wt) for the 20% wt carbon slurry and 2.75:1.0 (wt/wt) for the 5% wt carbon slurry. The slurry was then cast onto a 15- m aluminum current collector using a doctor blade. Solvent was removed at ~ 50o C and dried under vacuum at 90o C for 24 h. The electrode mass loading and thickness were ~ 3 mg cm-2 and ~ 15 μm, respectively The electrodes were assembled into 2016 coin cells using two 25 µm Celgard separators and a Li anode immersed in a 1M LiPF6 electrolyte in 4:3:3 (vol/vol/vol) ethylene carbonate: dimethyl carbonate: diethyl carbonate electrolyte.
The electrodes underwent two or five formation cycles at between C/8 and C/10 charge and between C/4 and C/5 discharge, with cutoff voltages at 3.8 and 2.5 V, respectively. The average discharge capacity of the batteries was 152 mAh g-1 with a standard deviation of 4 mAh g-1. The capacity obtained from the formation cycle was independent of carbon loading. Figure S10 shows the voltage as a function of charging and discharged rates when the electrodes were cycled partially between fully (dis)charged and 50 mAh g-1.
45
Fig. S10: Rate-dependent voltage of LFP electrodes at different carbon loadings at 33% state-of-(dis)charge. The dashed lines are linear fits of the voltage as a function of rate. The
electrodes were cycled partially between fully (dis)charged and 50 mAh g-1. Some voltages are unavailable at higher rates because the battery reached the cutoff voltage of 3.8 V or 2.5 V before (dis)charging 50 mAh g-1. Each symbol represents a different battery made from the same electrode sheet.
46
5. Numerical Porous Electrode Simulations
The simulations were conducted using a modified porous electrode model similar to the one developed by Ferguson and Bazant3. The LFP solid particles were modelled with a phase-field approach. A reaction model couples the solid phase with ion transport in the electrolyte. Supplemental ref. 3 provides a detailed derivation of the model. Given the relatively small average particle size in our experiment, we assume lithium intercalation in LFP particles to be reaction limited (i.e., no solid-state diffusional gradient along the fast b-axis along the solid). We simulated the lithium diffusional chemical potential and current in two dimensions using finite volume discretization: along the a-axis of individual particles, and along the thickness of the electrode spanning the porous electrode sandwiched between the current collector and the separator (Fig. 3). The reaction at the lithium anode is assumed to be fast.
We simultaneously solved for the lithium distribution within 100 representative particles inside the porous electrode. We divided the positive electrode into ten evenly spaced representative volumes; each volume contains ten particles of different sizes.
Particle Shape
We simulated plate-like particles inspired by those from Supplementary ref. 4 and 5, with a schematic shown in Fig. 3. We randomly selected 100 particles (10 particles in each solid volume, with 10 different solid volumes at different positions in the electrode) from our experimental particle size distribution (Fig. S1). In the absence of orientation information from our transmission electron micrographs, we made the following assumptions about the particle sizes. We designate the c-axis to equal the values plotted in Fig. S1. The ratio between the a-axis and c-axis is taken to equal 1:1.92. We assume the b-axis thickness equals √ , where
47
equals the area of the ac surface. While we chose this specific model particle, our results are not sensitive to the actual particle size and morphology.
Transport in Electrolyte
The electrolyte occupies the space in the pores of each representative electrode volume with volume fraction . Combined, the particles represent a total active volume in the electrode, ( ) , where is the active material loading percent by volume. Cation and anion fluxes in the binary electrolyte are governed by the Nernst-Planck equation:
(1)
where the subscript “ ” and “ ” denote the cation and anion, respectively, is the concentration of lithium in the electrolyte, is the formal charge of the ion, is the elementary charge, is the electrostatic potential, is Boltzmann’s constant, and is the temperature (room temperature in the simulations). are the chemical diffusivities of the cations and anions in the electrolyte, and are the dilute limit diffusivities. Applying mass conservation and electroneutrality yields:
( ) ( ) (2) where
is an ambipolar diffusivity of the electrolyte,
is the cation transference number, and is the electrical current density in the electrolyte. Based on electroneutrality, . is the total reaction rate summed over the particles in a solid volume of the electrode ( ) at a
48
given position along the thickness of the electrode, which we relate to the electrolyte current density via charge conservation:
( ) ∑ ̅
( ) (3)
where indexes particles in a volume, is the volume of particle , is the total volume of all particles in the solid volume, and ̅ is the average concentration of lithium in particle . This volumetric reaction rate is the first significant modification to the work in Supplementary ref. 3. Whereas Ferguson and Bazant3 simulated a single representative particle per volume, here we picked a distribution of particles in each volume, and the volumetric reaction rate is thus modified accordingly.
The total current is constrained in our constant current simulations by integrating the reaction rates over the entire positive electrode:
∫ (4)
We hold the total current constant by adjusting the applied voltage between the positive and negative current collectors. At the positive electrode current collector, we imposed a zero-flux boundary condition. We assume no overpotential at the Li anode as a result of fast reaction. We set the electrolyte concentration gradient at the anode to equal the value required by the overall current constraint and the cross-sectional area of the cell, :
|
49
Particle Reaction Rate
Using a one-dimensional phase-field model, we solved the reaction-limited Allen-Cahn-type equation to obtain the reaction rate in each particle. This solution to a one-dimensional particle has been shown to be comparable to a complete two-dimensional solution6. To reduce computational time, we discretized particles into 2 nm slices along the a-axis. While a 2 nm discretization along the a-axis is larger than the phase boundary7, our simulations showed no differences between a 1 nm and a 2 nm discretization. The reaction rate couples the transport of lithium in the electrolyte with the solid electrode particles. The reaction rate per area for the each particle in a single-electron process is given by a modified Butler-Volmer equation3,7
[ ( ) (( ) )] (6)
where is the rate constant, describes the phenomenological asymmetry, and and are the activities of lithium in the solid particles (reduced state) and in the electrolyte (oxidized state), respectively. ( ̃ ) is the activity coefficient of the transition state representing excluded sites in the transition state, and ̃ is the reduced lithium concentration along the a-axis of the solid normalized to the number of Li sites. Here, we neglect departures from Butler-Volmer kinetics that has recently been observed in LFP8. The reaction overpotential is expressed as
Δ Δ
(7) where Δ is the electrostatic potential difference between the metallic electron-conducting phase (i.e., carbon, which we assume for now to be a perfect conductor) and the electrolyte at the
50
particle. The second term, Δ , represents the potential difference at equilibrium and relates to activities via the Nernst Equation:
Δ ( ) (8)
where is the standard potential, is the initial electrolyte concentration, is the diffusional chemical potential of Li in an LFP particle (which varies along the a-axis of the LFP particles). The reaction rate is related to the solid phase concentrations by
where is the concentration of lithium in the particle slice, is the surface area of the particle.
From Supplementary ref. 3, we modelled the Li diffusional chemical potential in LFP as:
( ̃ ) ( ̃
̃ ) ̃ ( ̃ ̅ ) (9) where is the regular solution parameter, is the gradient penalty from the Cahn-Hilliard equation, is the coherent stress penalty, ̅ is the average filling fraction of the particle, and is the lithium site concentration. We accounted for lithium surface wetting discussed by Supplementary ref. 4 by imposing ̃ = 0.98 at the boundaries of each particle. This surface wetting, along with a size distribution within each simulated volume, is the other significant change to the model used in Supplementary ref. 3.
Barrier Height Variation
Using the modified porous electrode model, we varied the barrier height by tuning the regular solution parameter to simulate materials with different transformation barriers. Figure
51
S11 plots the current density and active particle population for different barrier heights. The barrier for LFP has been shown to be around 40 meV4. This confirms that our qualitative observations extend to phase-separating materials with different transformation barrier heights, and that reducing the barrier height would increase the active particle population at lower rates. All other material parameters were kept constant.
Phase Separation Approximation
Although the Li diffusional chemical potential for LiFePO4 slopes downward in the two-phase region4, it is also interesting to explore the limiting case of a flat Li potential past the transformation barrier (Fig. S12). We examined this limit by specifying the Li diffusional chemical potential as a function of the average filling of each particle. We used a piecewise function to define the Li diffusional chemical potential in LFP upon discharge:
{
( ̅ ) ( ̅
̅ ) ̅ ̅ ̅
(10)
where is the spinodal point for the Li-poor compound and is the solubility limit for the lithium-rich compound. This function resembles the chemical potential function used in recent work9-11. This approach reduced the computational time by lowering the dimension of the problem by one. Rather than solve the position-dependent lithium concentration in each particle, we solved for the average lithium fraction. We simulated 625 representative particles, with 25 electrode volumes and 25 particles in each volume.
Figure 4a plots the results of this simulation. Both the complete phase-field model and the phase separation approximation yield similar results in terms of active particle population