HAL Id: hal-01318038
https://hal.sorbonne-universite.fr/hal-01318038
Submitted on 19 May 2016HAL is a multi-disciplinary open access archive for the deposit and dissemination of sci-entific research documents, whether they are pub-lished or not. The documents may come from teaching and research institutions in France or abroad, or from public or private research centers.
L’archive ouverte pluridisciplinaire HAL, est destinée au dépôt et à la diffusion de documents scientifiques de niveau recherche, publiés ou non, émanant des établissements d’enseignement et de recherche français ou étrangers, des laboratoires publics ou privés.
Norman Sabbah, Colas N. Authié, Nicolae Sanda, Saddek Mohand-Saïd,
José-Alain Sahel, Avinoam B. Safran, Christophe Habas, Amir Amedi
To cite this version:
Norman Sabbah, Colas N. Authié, Nicolae Sanda, Saddek Mohand-Saïd, José-Alain Sahel, et al.. Increased functional connectivity between language and visually deprived areas in late and partial blindness. NeuroImage, Elsevier, 2016, �10.1016/j.neuroimage.2016.04.056�. �hal-01318038�
ACCEPTED MANUSCRIPT
1
Title
Increased functional connectivity between language and visually deprived areas in late and partial blindness
Authors
Norman Sabbah,1-4 Colas N. Authié,1-4 Nicolae Sanda,1-4 Saddek Mohand-Saïd,1-4 José-Alain Sahel,1-4,6-7 Avinoam B. Safran,1-4,8 Christophe Habas,1-3,5 Amir Amedi1-3,9-11
Affiliations
1Sorbonne Universités, UPMC Université Paris 06, UMR S968, Institut de la Vision, Paris,
F-75012, France
2INSERM, U968, Institut de la Vision, Paris, F-75012, France
3CNRS, UMR 7210, Institut de la Vision, Paris, F-75012, France
4Centre d’investigation clinique, Centre Hospitalier National d’Ophtalmologie des
Quinze-Vingts, INSERM-DHOS CIC 1423, Paris, F-75012, France
5Centre de neuroimagerie, Centre Hospitalier National d’Ophtalmologie des Quinze-Vingts,
Paris, F-75012, France
6Institute of Ophthalmology, University College of London, United Kingdom
ACCEPTED MANUSCRIPT
2
8Department of Clinical Neurosciences, Geneva University School of Medicine, Geneva,
Switzerland
9Department of Medical Neurobiology, The Institute for Medical Research Israel-Canada,
Faculty of Medicine, The Hebrew University of Jerusalem, Jerusalem 91220, Israel.
10The Edmond and Lily Safra Center for Brain Sciences (ELSC), The Hebrew University of
Jerusalem, Jerusalem 91220, Israel.
11The Cognitive Science Program, The Hebrew University of Jerusalem, Jerusalem 91220,
Israel.
Corresponding author
Norman SABBAH
Institut de la vision, UMR S968
17 rue Moreau 75012,
Paris, France
E-mail: [email protected]
and
Pr. Amir Amedi
Department of Medical Neurobiology,
ACCEPTED MANUSCRIPT
3 The Hebrew University of Jerusalem,
Jerusalem 91220, Israel
E-mail: [email protected]
Running title
Late visual loss affects language-visual FC
Abstract
In the congenitally blind, language processing involves visual areas. In the case of normal visual development however, it remains unclear whether later visual loss induces interactions between the language and visual areas. This study compared the resting-state functional connectivity (FC) of retinotopic and language areas in two unique groups of late visually deprived subjects: (1) blind individuals suffering from retinitis pigmentosa (RP), (2) RP subjects without a visual periphery but with preserved central “tunnel vision”, both of whom were contrasted with sighted controls. The results showed increased FC between Broca's area and the visually deprived areas in the peripheral V1 for individuals with tunnel vision, and both the peripheral and central V1 for blind individuals. These findings suggest that FC can develop in the adult brain between the visual and language systems in the completely and partially blind. These changes start in the deprived areas and increase in size (involving both foveal and peripheral V1)
ACCEPTED MANUSCRIPT
4
and strength (from negative to positive FC) as the disease and sensory deprivation progress. These observations support the claim that functional connectivity between remote systems that perform completely different tasks can change in the adult brain in cases of total and even partial visual deprivation.
Keywords
Adult brain plasticity, critical periods, Cerebral reorganization, resting-state fMRI, retinitis
pigmentosa, brain connectivity, Language & Vision
Abbreviations
FC: functional connectivity
RP: retinitis pigmentosa
fMRI: functional magnetic resonance imaging
ACCEPTED MANUSCRIPT
5
1.
Introduction
Functional magnetic resonance imaging studies have shown that the relationship between the
language and visual areas varies depending on the presence or absence of visual function. For
instance, during an abstract word recall task, sighted individuals exhibited strong visual areas
deactivation alongside activation of language specific regions (Azulay et al., 2009). In congenitally blind subjects, however, most groups have reported strong activation of the early visual cortex in addition to the classical language areas (e.g. Broca’s area) during both verbal memory (Amedi et al., 2003; Azulay et al., 2009) and language-related verb generation tasks
(Amedi et al., 2003; Burton et al., 2003, 2002a). Activations of visual areas also play a
functional role in both semantic memory and generation tasks, in that blind individuals
showing strong recruitment of V1 also demonstrated superior performance in such processes
(Amedi et al., 2003; Raz et al., 2005). Furthermore, language-related early visual cortex
activity was shown to make a key contribution to this task in congenitally blind but not in
sighted individuals. This is one of the very few examples of a causal relationship indicative of
cross-modal plasticity in the blind (Amedi et al., 2004). Bedny et al.'s recent study using a
variety of well-controlled language tasks showed that activity in the visual (essentially left)
areas actually reflected complex language processing in the congenitally blind. They
suggested that there was a critical period for this recruitment, as no such activation was found
in the late blind (Bedny et al., 2012, 2011). Anatomically, the semantic processing of the
occipital cortex is likely supported by the inferior frontal-occipital fasciculus (IFOF), namely
its superficial layer and the posterior component of the deep layer (Sarrubo et al., 2013).
Congenitally but not late blind individuals exhibit altered IFOF, decreased structural global
ACCEPTED MANUSCRIPT
6
frontal lobes (Liu et al., 2013; Shu et al., 2009; Reislev et al., 2016). These structural changes,
together with the above mentioned functional and behavioral data point to early absence of
visual input altering brain structure to serve specific tuned-up non-visual functions of
occipital cortex. Do only congenitally blind individuals develop this type of early visual
cortex recruitment for language and memory? Or can it also occur in the late blind? This issue
goes beyond the field of blindness to the wider question of whether this processing can only
occur during critical or sensitive periods in childhood or whether some traces and mechanisms
for this ability are present even in the adult brain (Bavelier and Neville, 2002; Bedny et al.,
2012; Sadato et al., 2002). This has implications for rehabilitation, especially in the context of
stroke since the loss of a specialized area requires another area to take over the missing
function (Pascual-Leone et al., 2005). It also remains unclear whether visual deprivation
needs to be complete for such plasticity to emerge or whether some changes can start even in
the presence of residual vision (Cunningham et al., 2015). Finally, little is known about the
large-scale anatomical and functional changes that might support such radical brain plasticity.
The current literature provides somewhat conflicting observations on these questions. Burton
et al. (2002) found that when listening to words, both congenitally and late blind subjects
exhibited bilateral activation of the visual cortex regions in addition to language and auditory
areas (Burton et al., 2002a). By contrast, Bedny et al. 2012 found that only the congenitally
blind - and not the late blind - showed an increased response in V1 to heard sentences as
compared to backwards speech. They concluded that recruitment of the visual cortex for
language processing depends critically on the age of blindness onset (Bedny et al., 2012).
Thus, even in very recent research it remains unclear whether visual cortex activation by
language is affected by previous visual experience in the blind. The picture in the effect of
ACCEPTED MANUSCRIPT
7
The analysis of resting-state functional connectivity constitutes a rich, efficient approach to
studying brain function, brain large-scale connectivity and brain plasticity (Fox and Greicius,
2010; Guerra-Carrillo et al., 2014; Smith et al., 2009) as illustrated in the human connectome
project (Hodge et al., 2015). These temporal correlations were shown to echo the
co-activation between brain regions found in task-based fMRI studies (Buckner et al., 2013;
Dosenbach et al., 2007). Of course like any method, rs-fMRI also has some limitations, which
are discussed in depth in the discussion (see 4.6. Limitations and methodological
considerations). Nevertheless, rs-fMRI is sensitive enough to detect interactions between specific language regions such as Broca’s area and the visual cortex. Several teams found specific increased functional connectivity between the inferior frontal triangular gyrus (part of BA 44, 45, 47) including Broca’s area and several occipital visual areas in the congenitally blind as compared to sighted subjects (Liu et al., 2007; Heine et al., 2015). Striem-Amit et al. (2015) recently studied the same type of population and found that central V1 was more
tightly connected to language areas whereas peripheral V1 was linked to spatial attention and
control networks in the congenitally blind as compared to a sightedgroup (Striem-Amit et al.,
2015).Butt et al. (2013) also analyzed the brain resting-state in a heterogeneous population of
blind subjects, and suggested that long-range FC between Broca’s area and V1 could be
explained by age at blindness onset; however, variability in visual conditions (e.g. age onset
of vision loss, cause of the disease, visual field location of the scotoma before blindness)
combined with the limited number of subjects in each condition constrained data
interpretation (Butt et al., 2013). The type of condition has also been considered by other
authors (Bedny et al., 2012; Watkins et al., 2012), who have argued that retina versus optic
nerve disorders or gradual versus sudden loss of vision may differentially affect the
ACCEPTED MANUSCRIPT
8
Hence, analyzing the functional resting-state connectivity in visually affected individuals
categorized into clinically well-defined homogeneous groups in terms of the etiology of
blindness might provide valuable indications whether partial or total late deprivation of vision
affects the functional links between Broca's area and the visual cortex. The current work was
conducted with clinically homogeneous groups of subjects suffering from retinitis
pigmentosa, a retinal degenerative condition that causes particularly structured defects
initially involving the visual field periphery (and sparing the central “tunnel vision” area), and
eventually leading to complete blindness.
Beyond its theoretical contribution, this study has important clinical implications. Late blind
patients suffering from RP are the group most expected to benefit from visual restoration such
as retinal prosthesis (Ayton et al., 2014; Stingl et al., 2013; Weiland and Humayun, 2014).
The existence of cross-modality plasticity mechanisms in RP subjects has only been
investigated in a few studies (Cunningham et al., 2015; Masuda et al., 2010) using other
methodologies that the ones employed here. Given that there is some evidence of maladaptive
cross-modal plasticity in deaf patients following cochlear implantation (Lee et al., 2001;
Striem-Amit et al., 2011a), there is a crucial need to better understand the reorganization
following progressive RP visual loss to overcome this potential issue in the context of sight
restoration.
The present study thus used brain resting-state to characterize the functional connectivity
between Broca's area and sub-regions of the visual cortex in: (1) individuals suffering from RP who still retain central “tunnel vision” – the RP tunnel vision group; and (2) individuals with more severe RP so that now there is not even tunnel vision, and visual loss covers the
ACCEPTED MANUSCRIPT
9
have faint light perception but zero form vision, as in advanced disease most individuals
report some visual fluctuation, described as "good days and bad days" (see Heckenlively,
1988) – the RP blind group (3) sighted individuals - the sighted control group. The following
specific questions were explored:
(1) What is the pattern of functional connectivity between Broca's area and visual areas in
the sighted? Does this pattern show negative FC as might be predicted based on the
deactivation (negative BOLD) in V1 to language and memory tasks (Azulay et al.,
2009)?
(2) Do Broca's and visual areas exhibit a different pattern of functional connectivity in
the RP blind (e.g. reversal to positive FC)?
(3) What is the functional connectivity of these same regions for RP tunnel vision
subjects? Is a complete lack of visual input necessary for the development of such
changes?
(4) Does this pattern vary according to the topography of the visual retinotopic areas; e.g.
does the peripheral visual cortex show a different pattern of connectivity than the
foveal across groups, as might be predicted by the fact that at the tunnel vision stage,
ACCEPTED MANUSCRIPT
10
2.
Materials and methods
2.1. Subjects and ethics: The sample was made up of 35 subjects divided into 3 groups.
Subjects were matched for age, and no subject had any reported neurological or psychiatric
antecedents (Table 1).
11 retinitis pigmentosa (RP) tunnel vision subjects (four women; eight right-handed), presenting a residual central visual field limited to a 10-20 degree
diameter (as evaluated by Goldmann III/4 kinetic perimetry), with a
best-corrected visual acuity equal or superior to 20/40 (measured by EDTRS
charts). Ages ranged from 28 to 63 years (mean: 47.9, median: 55.0). None
read Braille.
11 RP blind subjects (six women; all right-handed), as defined by a complete loss of the entire visual field that might be accompanied by some form of bare
light perception. Ages ranged from 29 to 62 years (mean: 50.1, median: 56).
Six were Braille readers.
13 Sighted controls (eight women; 12 right-handed), with unremarkable routine ophthalmological examinations (normal visual acuity and visual field,
as evaluated by Goldmann III/4 kinetic perimetry). Ages ranged from 28 to 63
years (mean: 49.2, median: 54.0). None read Braille.
The Ethics Committee (Comité de protection des personnes, Ile de France V, and Agence
ACCEPTED MANUSCRIPT
11
protocol (number 12873), and all subjects gave their written informed consent (according to
the Declaration of Helsinki) before participating.
2.2. Functional imaging: fMRI was conducted on a whole-body 3T clinical imager (Sigma
Horizon) by using an 8-channel head coil. In each scanning sequence, 32 contiguous axial
T2*-weighted gradient-echo echo-planar images (TE/TR, 93/3000 ms; FOV, 240 ϫ 240 mm; matrix, 64 ϫ 64; voxel size, 3.75 x 3.75 x 4 mm; thickness, 4 mm; interslice spacing, 0 mm; NEX, 1) were recorded to encompass the entire brain. 180 volumes were acquired including 4 “dummy” volumes obtained at the start of the session. The scan duration was 9.25 minutes for the echo planar imaging sequence. Off-line, T2*-weighted images were co-registered and
overlaid on the corresponding anatomic T1-weighted gradient-echo images (TE/TR/flip angle, 3.9/9.5 ms/20°; FOV, 25.6 ϫ 25.6 mm; matrix, 512 ϫ 512; source voxel size, 1.2 x 0.5 x 0.5 mm converted to 1 x 1 x 1 mm; thickness, 1.2 mm; interslice spacing, 1.2 mm). During the
scan, subjects were supine in the magnetic resonance imaging scanner and wore earplugs to
compensate for the noisy environment. Subjects were instructed to keep their eyes closed. No
explicit task was required.
2.3. FMRI preprocessing: fMRI data were preprocessed using the BrainVoyager QX 2.8
software package (Brain Innovation, Maastricht, Netherlands) and complementary software
written in MATLAB R2009a (MathWorks, USA). Preprocessing of functional scans included:
slice-time correction, 3D motion correction (no head motion exceeded 2 mm in any direction;
which means movements are maximum in the order of magnitude of one functional voxel
only as voxels size was: 3.75 x 3.75 x 4 mm) in order to control and remove artifacts,
ACCEPTED MANUSCRIPT
12
pulse), voxel-to-voxel linear regression (Cole et al., 2010) of spurious signal from the white
matter and ventricles regions anatomically defined for each subject, normalization in the
Talairach coordinate system in the volume (Talairach and Tournoux, 1988), and spatial
smoothing with a Gaussian filter kernel of 6mm full-width-at-half-maximum. We did not
include global signal removing because of the potential introduction of false negative
correlations (see Murphy et al., 2009). For the between groups comparison we tested and
found no significant difference (or even a trend) in the extent (mm) of head movement
between the three groups (ANOVAs: p>0.05 for each direction: X, Y, Z, translations, X, Y, Z,
rotations; see Supplementary Table. S1). These data were confirmed by repeating the GLM
analysis (see section 2.4) including the head movement predictors (control analysis; see
Supplementary Fig. S1). Including these movement predictors in the GLM did not change
the main results.
2.4. Seed ROI definition and analysis: For each subject, a seed region-of-interest (ROI)
consisting of a 5mm-radius sphere was located in Broca’s area (BA45, pars triangularis;
Talairach coordinates: -39, 17, 11; see (Burton et al., 2002a; Sarubbo et al., 2013)) which
served to extract the blood-oxygen level-dependent time-course of this region (Burton et al.,
2003). The average time-course for each subject was calculated, z-transformed and used as
individual predictors in a group random-effect analysis based on the general linear model
(GLM) (see Fig. 1; Friston et al., 1999). To establish a contrast among groups, a
between-subject random effect ANOVA was performed with a significance level of p<0.05, corrected
for multiple comparisons using cluster-size thresholding (Forman et al., 1995; Goebel et al.,
2006; Striem-Amit et al., 2015) implemented in BrainVoyager using the Monte Carlo
ACCEPTED MANUSCRIPT
13
voxels directly into account and corrects for the false-positive rate of continuous clusters (a
set-level statistical inference correction; corrected to p<0.05).
2.5. External functional localizers: External functional localizers were used to define the seed
ROI from visual localizers (left hemisphere foveal V1, peripheral V1). Each of these
localizers was extracted from a group of sighted controls and analyzed in normalized
Talairach space using a random effect GLM, which enabled generalization of the findings to
the population (see details below; Friston et al., 1999).
To define the primary visual cortex seeds, 13 control subjects were scanned in a standard
phase-encoded retinotopic mapping procedure, with ring (eccentricity mapping) and wedge
(polar mapping) stimuli to establish the visual retinotopic mapping (Engel et al., 1994; Sereno
et al., 1995; Striem-Amit et al., 2015; Wandell et al., 2007; Wandell and Winawer, 2011)
delivered during the two separate experiments. The stimuli were projected via an LCD screen
positioned over the subject's forehead and watched through a tilted mirror. In Experiment 1 an
annulus was projected, expanding from 0° to 34° of the subject's visual field in 30 seconds,
repeated 10 times. Experiment 2 included a wedge with a polar angle of 22.5° that rotated
around the fixation point, and completed a cycle in 30 seconds repeated 20 times. Both the
annulus in Experiment 1 and the wedge in Experiment 2 contained a flickering (6 Hz) radial
checkerboard pattern with respect to standard retinotopic procedures (Engel et al., 1994) for
the mapping of field maps. In both cases, there was a 30 second mute period before and after
the visual stream for baseline. Group phase analysis was conducted on the two experiments as
done in other studies from our group (Hertz and Amedi, 2010; Striem-Amit et al., 2011b)
ACCEPTED MANUSCRIPT
14
define the borders of V1, and the two maps were used to segregate it according to eccentricity
(center or periphery of the visual field), laterality (left or right parts of the visual field).
The external functional definition of the early visual cortex was further used to
calculate the within-subject correlation between Broca’s area and left posterior or anterior
calcarine sulcus and cuneus (localizers for the left fovea and the periphery of V1
respectively). Individual average time-courses from ROIs were sampled from each
participant. The Pearson correlation coefficient between the time-courses of the two ROIs
(within each subject) was calculated (see Fig. 4). ANOVA and Sheffe post-hoc analyses were
also performed to test for differences between the groups (p<0.05). Then, non-parametric
Wilcoxon rank sum tests were run on the same data to control for the effect of Braille reading
skills in segregated populations of RP blind subjects (see Supplementary Table S2).
To evaluate the effect of age, blindness duration and Braille reading skills (see
Supplementary Table S2) on the FC between Broca's area and the extrastriate areas of RP
blind subjects, 5mm-radius spheres were defined according to the most significant foci
exhibiting positive FC at the within-group level (i.e. left inferior occipital gyrus, -24 -89 -18;
left middle occipital gyrus -26 -89 4; left fusiform gyrus -24 -62 -7; left parahippocampal
gyrus -24 -39 -8; see Fig. 3). Then, non-parametric Wilcoxon rank sum and Pearson tests were performed on the correlation coefficients of Broca’s area and each of these extrastriate regions in segregated populations of the RP blind subjects (Braille reader vs. non-Braille
readers; see Supplementary Table S2).
To summarize
,
the resting-state data were analyzed by several complementary methods andlevels. First, ROI-based seed functional connectivity analysis was performed on the rs-fMRI
data to investigate the functional connectivity between the seeded Broca’s area and the rest of
ACCEPTED MANUSCRIPT
15
to compare functional maps between groups (see Figs. 2-4; Table 2). FC coefficients between
specific ROIs such as Broca’s area and the anterior and posterior regions of the calcarine
sulcus were also calculated for each group (see Fig. 4). ANOVAs and post-hoc tests were
then performed on the mean z-score correlation coefficients to compare the groups. Finally,
non-parametric Wilcoxon rank sum tests and Pearson tests were performed on the level of correlation of Broca’s area and both the striate and extrastriate visual areas to control for the effects of age, duration of blindness and Braille reading skills in RP blind subjects (see
Supplementary Table S2).
Table 1. Subjects' clinical data. B: RP blind subjects, TV: RP tunnel vision subjects. S: sighted control
subjects. N: Normal visual field, i.e. 130° - 140° in horizontal diameter. Blindness duration: number of years
since the subjects lost any form vision in all parts of their visual field but might still keep some bare light
ACCEPTED MANUSCRIPT
16
3. Results
Please insert figure 1 here
Fig. 1. Within-group analysis of functional connectivity seeded from Broca’s area. The maps are shown in
fmri full-slice view (neurological convention) for (A) Sighted controls, (B) RP tunnel vision, (C) RP blind
subjects. Colors depict the magnitude of the FC of Broca’s area localizer and the rest of the brain:
yellow-orange for positive FC and green-blue for negative FC. X, y, z are in Talairach coordinates. In all groups, the
inferior frontal Broca’s area is functionally connected to the anterior cingulate, left supramarginal gyrus (e.g. Wernicke’s area), subcortical regions (e.g. bilateral insula, thalamus), superior temporal auditory regions and bilateral fronto-parietal regions. (A) The sighted control subjects show a strong negative FC of Broca's area
with major ventral and dorsal visual areas (i.e. along the calcarine sulcus/lingual, cuneus, inferior occipital,
middle occipital, parahippocampal, restrosplenial, fusiform, and inferior temporal gyri) and medial part of the
superior frontal gyrus. (B) RP tunnel vision subjects show almost no negative FC of Broca's area with calcarine
sulcus/cuneus but still preserve a negative FC with the inferior occipital, middle occipital, lingual,
parahippocampal, restrosplenial, fusiform, and inferior temporal gyri. (C) RP blind subjects show positive FC of
Broca's area with the calcarine sulcus/cuneus and lose almost all negative functional connectivity with the other
extrastriate visual areas.
In all groups, the data showed that Broca’s area was functionally connected to the anterior cingulate, left supramarginal gyrus (Wernicke’s area), the precentral gyrus (e.g. primary motor area), and the subcortical (e.g. bilateral insula, thalamus), auditory (e.g. A1) and
fronto-parietal regions (see Fig. 1).
In the sighted control within-group analysis, there was strong negative FC between
Broca's area and early and high order visual areas as well as the medial part of the superior
ACCEPTED MANUSCRIPT
17
sulcus (corresponding to Brodmann Area 17 / Visual area V1 - Primary visual cortex),
cuneus, inferior occipital, lingual, parahippocampal, retrosplenial, fusiform, and inferior
temporal gyri (see Fig. 1A).
The RP tunnel vision within-group analysis revealed almost no negative FC between
Broca's area and the calcarine sulcus and cuneus but still preserved negative FC with the
inferior occipital, lingual, parahippocampal, restrosplenial, fusiform, and inferior temporal
gyri (see Fig. 1B).
The RP blind group showed a complete reversal of the level of FC between Broca's
area and the early visual cortex. The data showed positive FC between Broca's area and the
calcarine sulcus/cuneus, but almost all the negative FC with other visual areas was lost (see
Fig. 1C).
Please insert figure 2 here
Fig. 2. Between-groups analysis of functional connectivity seeded from Broca’s area (focus on calcarine
sulcus/cuneus differences). The maps are shown in fmri full-slice view (neurological convention) for (A) RP
blind subjects or (B) RP tunnel vision subjects compared to the sighted control subjects. Colors depict the
magnitude of the difference between groups of the FC of Broca’s area localizer and the rest of the brain: yellow-orange for increased FC (away from zero) and green-blue for decreased FC (toward zero). X, Y, Z are Talairach
coordinates. (A) Increased functional connectivity was found in RP blind subjects compared to sighted control
subjects between Broca's area and the calcarine sulcus (Brodmann area 17) delineated in white as well as the
cuneus, lingual, fusiform, inferior occipital, parahippocampal and medial part of the superior frontal gyri. (B)
Increased functional connectivity was found in RP tunnel vision subjects compared to the sighted control
subjects between Broca's area and the anterior calcarine sulcus/Cuneus (Brodmann areas 17-18) and the medial
part of the superior frontal gyrus. As between-groups differences could result from positive or (and) negative
ACCEPTED MANUSCRIPT
18
the bottom of each figure. Yellow-orange and green-blue represent positive and negative functional connectivity
respectively with Broca's area for each group. S: sighted controls. TV: RP tunnel vision. FB: RP blind.
Please insert figure 3 here
Fig. 3. Between-groups analysis of functional connectivity seeded from Broca’s area (focus on extrastriate
area differences). The maps are shown in fmri full-slice view (neurological convention) for RP blind subjects
compared to (A) sighted control subjects or (B) RP tunnel vision subjects. Colors depict the magnitude of the
difference between groups of the FC of Broca’s area localizer and the rest of the brain: yellow-orange for increased FC (away from zero) and green-blue for decreased FC (toward zero). X, Y, Z are Talairach
coordinates. (A) Increased functional connectivity was found in RP blind compared to the sighted control
subjects between Broca's area and the left fusiform (FFG), parahippocampal (ParaH), inferior (IOG) and
middle (MOG) occipital gyri (delineated in black). (B) Increased functional connectivity was found in RP blind
subjects compared to RP tunnel vision subjects between Broca's area and the parahippocampal, inferior and
middle occipital gyri (delineated in black). As between-groups differences could result from positive or (and)
negative functional connectivity at the group level, we show the within-group maps for selected regions with a
blow-up at the bottom of each figure. Yellow-orange and green-blue represent positive and negative functional
connectivity respectively with Broca's area for each group. S: sighted controls. TV: RP tunnel vision. FB: RP
ACCEPTED MANUSCRIPT
19
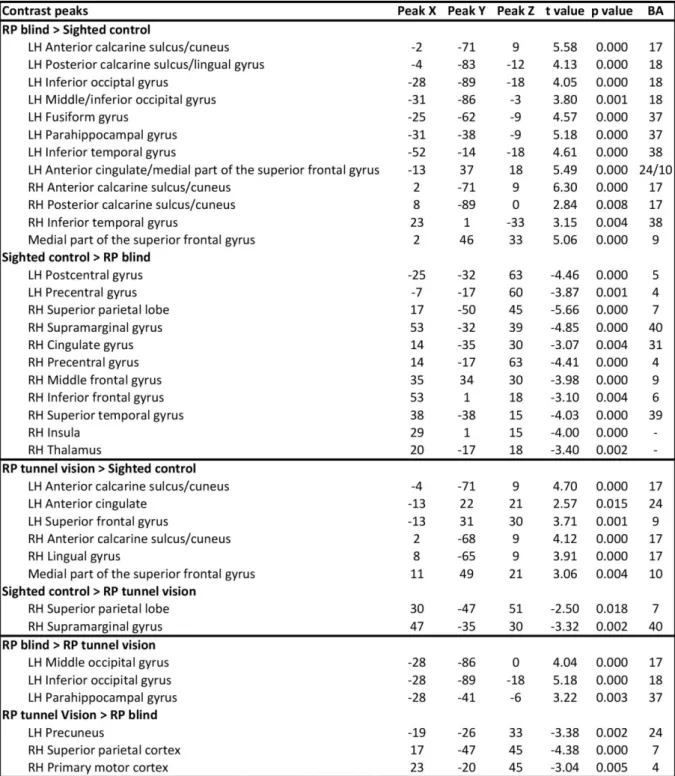
Table 2. Peaks of functional connectivity differences between groups (seed region-of-interest: Broca’s
area). Peaks x,y,z: Talairach coordinates. P values corrected for multiple comparisons. LH: Left hemisphere.
ACCEPTED MANUSCRIPT
20
In the RP blind subjects compared to the sighted controls, between-group analyses revealed a
significantly increased level of FC between Broca’s area and parts of the calcarine sulcus,
cuneus, lingual, left fusiform, left inferior occipital, left parahippocampal, left inferior
temporal and medial part of the superior frontal gyri (see Figs. 2A and 3A; for Talairach
coordinates of all the peaks for these contrasts see Table 2).
Increased FC between Broca's area and the anterior calcarine sulcus/cuneus as well as
the medial part of the superior frontal gyrus was found for the RP tunnel vision subjects
compared to the sighted controls (see Fig. 2B; for Talairach coordinates of all the peaks for
these contrasts see Table 2).
Compared to the RP tunnel vision subjects, the RP blind subjects showed increased FC
between Broca's area and specific extrastriate areas such as the left middle occipital, inferior
occipital and parahippocampal gyri (see Fig. 3B, Table 2).
Please insert the figure 4 here
Fig. 4. Correlations between Broca’s area and specific parts of the calcarine sulcus across populations (RP blind, RP tunnel vision, sighted control subjects). Correlations (R2 Pearson test; mean z-score) of Broca’s
area with (A) left anterior or (B) left posterior calcarine sulcus was calculated for each group. Bars indicate
between-subject standard error. (A) There was a group main effect for the correlation between the left anterior
calcarine sulcus and Broca’s area (ANOVA: F(2,32)=13.59 p<0.0001). Post-hoc tests (Scheffe) revealed significant differences between the RP blind and sighted control subjects' correlation coefficients (** p<0.01),
and between RP tunnel vision and sighted control subjects (* p<0.05). (B) There was a main effect for the
correlation between the groups for the left posterior calcarine sulcus and Broca’s area (ANOVA: F(2,32)=5.78 p<0.01). Post-hoc tests (Scheffe) only revealed significant differences between the RP blind and the sighted
control correlation coefficients (** p<0.01). For each group, mean R2 coefficients before Z transformation are
ACCEPTED MANUSCRIPT
21
In terms of correlation coefficients between ROIs, there was a group main effect for both the
left anterior (ANOVA: F(2,32)=13.6 p<0.0001) and posterior (ANOVA: F(2,32)=5.78 p<0.01) calcarine sulcus and Broca’s area (see Fig. 4). Post-hoc tests showed (1) a statistically significant difference for both the anterior and posterior regions of the calcarine sulcus and Broca’s area between the RP blind and the sighted control subjects (p<0.01; see Fig. 4A-B), and (2) a statistically significant difference solely for the anterior regions of the calcarine sulcus and Broca’s area in the RP tunnel vision subjects and the sighted controls (p<0.05; see
Fig. 4A).
In the RP blind subjects, Pearson tests revealed no effect for age or blindness duration on the FC between Broca’s area and the anterior calcarine sulcus/cuneus (age: R(9)=0.32 p>0.05; blindness duration: R(9)=0.24 p>0.05), posterior calcarine sulcus/cuneus (age: R(9)=0.49
p>0.05; blindness duration: R(9)=-0.14 p>0.05), left inferior occipital gyrus
(age: R(9)=-0.024 p>0.05; blindness duration: R(9)=0.18 p>0.05), left fusiform gyrus
(age: R(9)=0.51 p>0.05; blindness duration: R(9)=0.094 p>0.05), and left parahippocampal
ACCEPTED MANUSCRIPT
22
4. Discussion
In this rs-fMRI study, we explored the FC between Broca’s area (BA45, pars triangularis of
the inferior frontal gyrus) and visual areas in sighted subjects as well as in two groups of
subjects suffering from late onset retinitis pigmentosa (RP), one with tunnel vision (partial
blind) and the other RP blind (covering the entire visual field). These groups exhibited
negative, null and positive FC patterns respectively (see Fig. 1). Furthermore, in comparison
to the sighted controls, both groups of RP subjects presented increased FC between Broca’s
area and regions of the calcarine sulcus and cuneus that are specifically deprived according to
the evolution of their condition (i.e. the anterior part (peripheral V1) for the RP tunnel vision
subjects, and both anterior and posterior part of V1 for the RP blind subjects; see Figs. 2 and
4, Table 2). Finally, compared to both the sighted control and the RP tunnel vision subjects,
the RP blind showed increased FC between Broca's area and specific extrastriate areas
including the left parahippocampal, fusiform, inferior and middle occipital gyri (see Fig. 3,
Table 2).
4.1. Negative functional connectivity between Broca’s area and visual areas in the sighted control group
Several studies support the claim that negative correlations reflect a true reduction in neuronal
processing (Behzadi et al., 2007; Chai et al., 2014; Fox et al., 2005; Guerra-Carrillo et al.,
2014; Logothetis et al., 2009; Shmuel et al., 2006, 2002; Shulman et al., 1997; Zeharia et al.,
ACCEPTED MANUSCRIPT
23
In the current study, Broca’s area in the sighted control group exhibited strong negative FC
with the entire calcarine sulcus/cuneus (i.e. V1) and both the ventral and dorsal extrastriate
visual areas. This is in agreement with a fMRI study which reported that in a verbal memory
retrieval task, sighted subjects showed activation of classical language areas (including Broca’s area) coupled with strong deactivation of visual areas including V1 calcarine sulcus and cuneus (Azulay et al., 2009). These study argued that a balance between activation and
deactivation is required to filter out irrelevant information and enable an attentional focus on
internal representations. This may imply that the negative FC we observed between
language/control at rest (i.e. the intrinsic system) and visual (i.e. the extrinsic system)
networks could reflect a functional competition that prevents visual inputs from disturbing
language processing (for reviews of extrinsic and intrinsic systems see (Fox et al., 2005;
Golland et al., 2008, 2007)). Broca’s area in the sighted control group also showed negative
FC with the medial part of the superior frontal gyrus. We assume based on its anatomical
location (talairach coordinates: -1, 47, -4; see Fox etl al., 2005), that it is part of the
default-mode network. In healthy subjects, default-default-mode network regions are well known to be
deactivated in a set of functional tasks (e.g. language), and activated in rest conditions, and
would contribute to the emergence of spontaneous inner-oriented thoughts (Greicius et al.,
2003; Raichle et al., 2001).
4.2. Differences in Broca’s area functional connectivity to the calcarine sulcus/cuneus in the three groups
The results help clarify whether the pattern of connectivity can help to support language
recruitment in visual areas in subjects with late visual deficits or partial visual deficits like
ACCEPTED MANUSCRIPT
24
subjects, and that it may be related to the learning of Braille reading (Burton et al., 2002a).
More recently, Bedny et al. (2012) only found language-related activation of V1 in early but
not in late blind participants (Bedny et al., 2012). They argued that the V1 activation observed
in the late blind in previous studies reflects attention or preparation mechanisms and
concluded that the recruitment of the visual cortex for language processing depends on the
age of blindness onset (Bedny et al., 2012).
In the current study, the RP blind group exhibited positive Broca’s area FC with parts of the calcarine sulcus/cuneus and increased FC of the same regions compared to the sighted
controls (see Figs. 1C-2A), which completely reversed the picture of resting state functional
connectivity found in the sighted. In the RP blind subjects, the entire visual field is lost, which
is probably why the FC to Broca’s area stretched from the anterior to the posterior deprived
regions of the calcarine sulcus/cuneus (corresponding to early visual areas). However, no evidence for a FC difference was found between Broca’s area and regions implicated in attentional mechanisms between groups. In contrast to the hypothesis put forward by Bedny et
al. (2012), we suggest that our results might support the recruitment of the early visual areas
by the language system, even in blind subjects with previous visual experience, or at least,
that the basis for such recruitment emerges from the resting-state functional connectivity
pattern. On the other hand, our data do not support the notion that this recruitment is tightly
linked to the acquisition of Braille reading skills (Burton et al., 2002a, 2002b; Cunningham et
al., 2015) since we did not find significant differences between Braille and non-Braille readers
within the RP blind group (see Supplementary Table S2). Thus, the functional relevance of
this connectivity still remains unclear. We also evaluated the effect of age and blindness
duration, and found no correlation with the FC between Broca and V1. Overall, these data
ACCEPTED MANUSCRIPT
25
area and early visual areas or for the complete reversal of their sign from negative FC in the
sighted to positive in RP complete late blindness.
The data for the RP tunnel vision subjects were generally consistent with what was found for
the RP blind in the sense that they support the hypothesis that recruitment for language
processing is specific to visually deprived regions. They also demonstrate that these processes
cannot only occur in the blind but also in subjects with residual visual function.
The RP tunnel vision subjects showed a slight negative FC of Broca's area with the calcarine
sulcus/cuneus (Brodmann area 17; see Fig. 1). However, when compared to the sighted
subjects, the RP tunnel vision subjects presented increased FC between Broca's area and
specific visually deprived regions (i.e., the anterior but not the posterior part of the calcarine
sulcus/cuneus; see Figs. 2 and 4).
In sighted individuals, the anterior and posterior parts of the calcarine sulcus/cuneus code for
peripheral and foveal representations of the visual field respectively (Sereno et al., 1995). In
the RP tunnel vision subjects, however, the peripheral representation of the visual field is lost
whereas the foveal field is preserved (Kalloniatis and Fletcher, 2004). Based on the
inter-modality competition hypothesis (Azulay et al., 2009), and given the intra-group null FC for
the tunnel vision group, in conjunction with their increased FC compared to the sighted, we
suggest that the language network develops functional connectivity with the sensory deprived
early visual cortex and that this connectivity is limited by the remaining foveal vision input.
Furthermore, the selective changes observed in the anterior V1 may be related to function
reallocation facilitated by the putative cross-modal abilities of this area (Eckert et al., 2008;
Falchier et al., 2002; Wandell and Smirnakis, 2009). It would be worthwhile comparing RP
ACCEPTED MANUSCRIPT
26
vision loss (e.g. age-related macular degeneration, Stargardt disease) to test whether the
posterior/foveal regions of V1 are also functionally connected to the language network.
Thus overall, these findings suggest that (1) dramatic changes occur in functional connectivity
between the language and early visual areas of the adult brain that change the sign of the FC
from negative to positive; (2) these changes occur even in a partial visual defect condition,
though to a lesser extent; and (3) these changes presumably depend on the topography of the
functionally deprived areas.
4.3. Differences in Broca’s area functional connectivity to extrastriate areas in the three groups
RP blind subjects also exhibited increased FC between Broca’s area and a set of extrastriate
regions as compared to both RP tunnel vision and sighted subjects (see Fig. 3, Table 2) but
not with the lateral occipital regions. Most of these regions have been identified in verb
generation tasks on the late blind (Burton et al., 2003, 2002a). It was suggested that
multisensory regions transfer language functions to tactile or auditory stimuli. Our results
challenge this explanation for two main reasons: (1) we did not find any significant functional
connectivity changes between Broca's area and these regions in Braille as compared to
non-Braille readers (see Supplementary Table S2); (2) we did not find any significant difference
in functional connectivity between the auditory and extrastriate visual areas across groups, as
would be expected according to the auditory cross-modality hypothesis (Burton et al., 2002a).
These extrastriate visual areas have also been identified in verbal and semantic
ACCEPTED MANUSCRIPT
27
Noppeney et al., 2003; Raz et al., 2005). Hence increased FC between Broca’s area and these
extrastriate regions may reflect the lifting of inhibition of the visual association cortex to
process verbal memory and semantic information. Nevertheless, the specific differences
between the functional connectivity of these regions in RP blind compared to the RP tunnel
vision subjects support the idea that complete vision loss is required for such changes to
occur.
4.4. Preserved functional connectivity between Broca’s area and the rest of the brain
in the three groups
In all three groups, we identified regions that are regularly activated in functional language
tasks and also belong to several intrinsically connected networks such as the language
network (Bookheimer, 2002; Hagoort, 2005; Hampson et al., 2002; Johnson and Ojemann,
2000; Price, 2010; Yetkin et al., 1995)and the executive control network (Doucet et al., 2011;
Spreng et al., 2010; Sundermann and Pfleiderer, 2012; Vincent et al., 2008). These findings suggest that functional connectivity is useful in delineating networks for a given function, including language, and may imply that beyond the changes between Broca’s and visual areas, the rest of the network is well preserved in cases of visual deprivation.
4.5. No sensitive period for the development of cross-modal plasticity at least as
reflected by the rs-fMRI data
The massive changes observed in functional connectivity between language and visual areas
ACCEPTED MANUSCRIPT
28
sulcus / V1 can occur in the adult brain. This change in connectivity was gradual and quite
dramatic in term of the distance between these areas and the different functions they support.
The fact that the tunnel vision subjects exhibited an intermediate pattern reinforces this idea
and further suggests that it occurs not only after complete visual deprivation, but also in the
context of partial visual loss. These observations strengthen arguments from the field of
stroke rehabilitation where musical stimulation (Särkämö et al., 2008) as well as noninvasive
stimulation devices (Di Pino et al., 2014) enhanced recovery in aphasia, probably by
influencing the way information is processed in alternative networks. Taken together, these
data imply that following input loss or damage to a certain network, the adult brain preserves
the ability to functionally connect with other networks and to potentially optimize their
performance. Nevertheless, the challenge of selecting the appropriate way to harness this
functional connectivity for optimal behavioral recovery in such clinical conditions as stroke or
visual restoration via retinal prostheses is still to be addressed. It is also not clear whether
these changes are compensatory in nature or whether they simply underlie connections in the
adult brain and furnish the 'raw material' for task-related compensatory plasticity.
4.6. Limitations and methodological considerations
Rs-fMRI is an invaluable sensitive tool to detect changes in brain connectivity (Fox and
Greicius, 2010; Guerra-Carrillo et al., 2014; Smith et al., 2009). However, it should be
mentioned that this method is subject to reliability problems induced by movement (a main
confound) but also by mind wandering, or wakefulness state (Caceres et al., 2009;
Tagliazucchi et al., 2012; van Dijk et al., 2012). This is why we took extra measures in order
to control for head movement and verify that there was no significant difference in head
ACCEPTED MANUSCRIPT
29
are classically activated in functional language tasks and also belong to the intrinsic language
network (Bookheimer, 2002; Hagoort, 2005; Hampson et al., 2002; Johnson and Ojemann,
2000; Price, 2010; Yetkin et al., 1995) supporting that our analysis is valid. Moreover, it allowed the identification of specific functional connectivity between Broca’s area and V1. This result points towards probable plastic changes induced by visual loss. However, our approach does not allow a direct inference about the role of the increased FC between Broca’s area and V1. Other approaches, such as language task-based fMRI (Burton et al., 2002a,
2003; Bedny et al., 2011, 2012) or transcranial magnetic resonance (Amedi et al., 2003) could
provide complementary data to accurately establish the origin and the influence of this connectivity on processes that involve Broca’s area. It should be noted that the limited availability of such relatively rare homogenous blind and tunnel vision subjects prevented us
from extending the protocol to include these behavioral tasks or other interesting experiments
such as retinotopy, at least not in this point of time. For instance, a retinotopy experiment in
RP tunnel vision subjects would allow us to design seeds of different portions of V1 (i.e.
underlying the projections of normal central and deprived peripheral visual field) and give an
insight on the cross-modal FC changes occurring in their brain.
We should also specify that information on disease onset is lacking and therefore was not
used as a covariate in our analysis. Indeed, in clinical practice, it is very hard to define the
onset of RP because of fading and filling-in processes that could hide scotoma for years after
the disease onset (see Pessoa and De Weerd, 2003).
As previously described in the discussion, several studies support that negative FC reflect a
physiological neuronal processing (Behzadi et al., 2007; Chai et al., 2014; Fox et al., 2005;
Guerra-Carrillo et al., 2014; Logothetis et al., 2009; Shmuel et al., 2006, 2002; Shulman et al.,
(Whitfield-ACCEPTED MANUSCRIPT
30
Gabrieli and Ford, 2012). Nevertheless, the interpretation of the negative correlation is subject
to debate (Buckner et al., 2013). Indeed, several noise removal methods such as global signal
regressions are believed to introduce false negative correlations (see Murphy et al., 2009).
These preprocessing methods were not used in our study, which give us some confidence in
the data interpretation. Additionally, note that we did not record breathing or pulse during the
scan but that their frequencies were regressed out by the bandpass filtering preprocessing step.
4.7. Conclusion
The findings presented here showed increased functional connectivity between language and
visual areas, which strengthened with the progression of RP from tunnel vision to complete
blindness. The data suggest that the changes observed between the language and the visual
areas depend on the topography of the functionally deprived regions. These results contribute to the debate on claims concerning a sensitive period for the development of cross-modal
mechanisms between language and visual areas, at least in the context of large-scale
functional connectivity patterns between areas.
Future studies could address (1) the functional recruitment of foveal V1 for language
processing in central visual deficits (e.g. in age macular degeneration and Stargardt disease),
(2) the behavioral counterparts of the functional connectivity changes observed in the present
study, and their applicability to visual restoration (e.g. using retinal prosthesis) and
substitution (e.g. using sensory substitution devices) processes (3) the functional connectivity
ACCEPTED MANUSCRIPT
31
5. Funding
This work was supported by French State funding under the auspices of the Agence Nationale de la Recherche (ANR) within the Investissements d’Avenir program (ANR-11-IDEX-0004-02) and by a grant from Humanis. This work was conducted within the framework of the
Labex LIFESENSES (ANR-10-LABX-65). This work was also supported by a European
Research Council grant (grant number 310809 to AA), the James S. McDonnell Foundation
scholar award (grant number 220020284 to AA), the Edmond and Lily Safra Center for Brain
Sciences (ELSC) Vision center grant, the Maratier family and the Gatsby Foundation.
Conflict of interest: Norman Sabbah, None; Colas Nils Authié, None; Nicolae Sanda,
None; Saddek Mohand-Said, None; José-Alain Sahel, consultant for Pixium Vision, GenSight
Biologics, Sanofi-Fovea, Genesignal; Avinoam B. Safran, None; Christophe Habas, None;
Amir Amedi, None.
6. Acknowledgments
We thank Sami Abboud, Shachar Maidenbaum, Ella Striem-Amit, Ilan Goldberg, Céline
ACCEPTED MANUSCRIPT
32
7. References
Amedi, A., Floel, A., Knecht, S., Zohary, E., Cohen, L.G., 2004. Transcranial magnetic stimulation of the occipital pole interferes with verbal processing in blind subjects. Nat. Neurosci. 7, 1266–70. doi:10.1038/nn1328
Amedi, A., Raz, N., Pianka, P., Malach, R., Zohary, E., 2003. Early “visual” cortex activation correlates with superior verbal memory performance in the blind. Nat. Neurosci. 6, 758–66. doi:10.1038/nn1072
Ayton, L.N., Blamey, P.J., Guymer, R.H., Luu, C.D., Nayagam, D.A.X., Sinclair, N.C., Shivdasani, M.N., Yeoh, J., McCombe, M.F., Briggs, R.J., Opie, N.L., Villalobos, J., Dimitrov, P.N.,
Varsamidis, M., Petoe, M.A., McCarthy, C.D., Walker, J.G., Barnes, N., Burkitt, A.N., Williams, C.E., Shepherd, R.K., Allen, P.J., 2014. First-in-Human Trial of a Novel Suprachoroidal Retinal Prosthesis. PLoS One. doi:10.1371/journal.pone.0115239
Azulay, H., Striem, E., Amedi, A., 2009. Negative BOLD in sensory cortices during verbal memory: a component in generating internal representations? Brain Topogr. 21, 221–31.
doi:10.1007/s10548-009-0089-2
Bavelier, D., Neville, H.J., 2002. Cross-modal plasticity: where and how? Nat. Rev. Neurosci. 3, 443– 52. doi:10.1038/nrn848
Bedny, M., Pascual-Leone, A., Dodell-Feder, D., Fedorenko, E., Saxe, R., 2011. Language processing in the occipital cortex of congenitally blind adults. Proc. Natl. Acad. Sci. U. S. A. 108, 4429–34. doi:10.1073/pnas.1014818108
Bedny, M., Pascual-Leone, A., Dravida, S., Saxe, R., 2012. A sensitive period for language in the visual cortex: distinct patterns of plasticity in congenitally versus late blind adults. Brain Lang. 122, 162–70. doi:10.1016/j.bandl.2011.10.005
Behzadi, Y., Restom, K., Liau, J., Liu, T.T., 2007. A component based noise correction method (CompCor) for BOLD and perfusion based fMRI. Neuroimage 37, 90–101.
doi:10.1016/j.neuroimage.2007.04.042
Bookheimer, S., 2002. Functional MRI of language: new approaches to understanding the cortical organization of semantic processing. Annu. Rev. Neurosci. 25, 151–88.
doi:10.1146/annurev.neuro.25.112701.142946
Buckner, R.L., Krienen, F.M., Yeo, B.T.T., 2013. Opportunities and limitations of intrinsic functional connectivity MRI. Nat. Neurosci. 16, 832–7. doi:10.1038/nn.3423
Burton, H., Diamond, J.B., McDermott, K.B., 2003. Dissociating cortical regions activated by
semantic and phonological tasks: a FMRI study in blind and sighted people. J. Neurophysiol. 90, 1965–82. doi:10.1152/jn.00279.2003
Burton, H., Snyder, A., Diamond, J.B., Raichle, M.E., 2002a. Adaptive changes in early and late blind: a FMRI study of verb generation to heard nouns. J. Neurophysiol. 88, 3359–71.
doi:10.1152/jn.00129.2002
Burton, H., Snyder, A.Z., Conturo, T.E., Akbudak, E., Ollinger, J.M., Raichle, M.E., 2002b. Adaptive changes in early and late blind: a fMRI study of Braille reading. J. Neurophysiol. 87, 589–607. Butt, O.H., Benson, N.C., Datta, R., Aguirre, G.K., 2013. The fine-scale functional correlation of
striate cortex in sighted and blind people. J. Neurosci. 33, 16209–19. doi:10.1523/JNEUROSCI.0363-13.2013
Caceres, A., Hall, D.L., Zelaya, F.O., Williams, S.C.R., Mehta, M.A., 2009. Measuring fMRI reliability with the intra-class correlation coefficient. Neuroimage 45, 758–768.
ACCEPTED MANUSCRIPT
33
doi:10.1016/j.neuroimage.2008.12.035
Chai, X.J., Ofen, N., Gabrieli, J.D.E., Whitfield-Gabrieli, S., 2014. Selective Development of Anticorrelated Networks in the Intrinsic Functional Organization of the Human Brain. J. Cogn. Neurosci. 26, 501–513. doi:10.1162/jocn_a_00517
Cole, D.M., Smith, S.M., Beckmann, C.F., 2010. Advances and pitfalls in the analysis and interpretation of resting-state FMRI data. Front. Syst. Neurosci. 4, 8.
doi:10.3389/fnsys.2010.00008
Cunningham, S.I., Weiland, J.D., Bao, P., Lopez-Jaime, G.R., Tjan, B.S., 2015. Correlation of vision loss with tactile-evoked V1 responses in retinitis pigmentosa. Vision Res. 111, 197–207. doi:10.1016/j.visres.2014.10.015
Di Pino, G., Pellegrino, G., Assenza, G., Capone, F., Ferreri, F., Formica, D., Ranieri, F., Tombini, M., Ziemann, U., Rothwell, J.C., Di Lazzaro, V., 2014. Modulation of brain plasticity in stroke: a novel model for neurorehabilitation. Nat. Publ. Gr. doi:10.1038/nrneurol.2014.162
Dosenbach, N.U.F., Fair, D. a, Miezin, F.M., Cohen, A.L., Wenger, K.K., Dosenbach, R.A.T., Fox, M.D., Snyder, A.Z., Vincent, J.L., Raichle, M.E., Schlaggar, B.L., Petersen, S.E., 2007. Distinct brain networks for adaptive and stable task control in humans. Proc. Natl. Acad. Sci. U. S. A. 104, 11073–8. doi:10.1073/pnas.0704320104
Doucet, G., Naveau, M., Petit, L., Delcroix, N., Zago, L., Crivello, F., Jobard, G., Tzourio-Mazoyer, N., Mazoyer, B., Mellet, E., Joliot, M., 2011. Brain activity at rest: a multiscale hierarchical functional organization. J. Neurophysiol. 105, 2753–63. doi:10.1152/jn.00895.2010
Eckert, M.A., Kamdar, N., Chang, C.E., Beckmann, C.F., Greicius, M.D., Menon, V., 2008. A cross-modal system linking primary auditory and visual cortices: Evidence from intrinsic fMRI connectivity analysis. Hum. Brain Mapp. 29, 848–857. doi:10.1002/hbm.20560
Engel, S., Rumelhart, D., Wandell, B., Lee, A., Glover, G., Chichilnisky, E., Shadlen, M., 1994. fMRI of human visual cortex. Nature 369, 525. doi:10.1038/369525a0
Falchier, A., Clavagnier, S., Barone, P., Kennedy, H., 2002. Anatomical evidence of multimodal integration in primate striate cortex. J. Neurosci. 22, 5749–59. doi:20026562
Forman, S.D., Cohen, J.D., Fitzgerald, M., Eddy, W.F., Mintun, M.A., Noll, D.C., 1995. Improved assessment of significant activation in functional magnetic resonance imaging (fMRI): use of a cluster-size threshold. Magn. Reson. Med. 33, 636–47.
Fox, M.D., Greicius, M., 2010. Clinical applications of resting state functional connectivity. Front. Syst. Neurosci. 4, 19. doi:10.3389/fnsys.2010.00019
Fox, M.D., Snyder, A.Z., Vincent, J.L., Corbetta, M., Van Essen, D.C., Raichle, M.E., 2005. The human brain is intrinsically organized into dynamic, anticorrelated functional networks. Proc. Natl. Acad. Sci. U. S. A. 102, 9673–8. doi:10.1073/pnas.0504136102
Friston, K.J., Holmes, A., Worsley, K.J., 1999. How many subjects constitute a study? Neuroimage 10, 1–5. doi:10.1006/nimg.1999.0439
Goebel, R., Esposito, F., Formisano, E., 2006. Analysis of functional image analysis contest (FIAC) data with brainvoyager QX: From single-subject to cortically aligned group general linear model analysis and self-organizing group independent component analysis. Hum. Brain Mapp. 27, 392– 401. doi:10.1002/hbm.20249
Golland, Y., Bentin, S., Gelbard, H., Benjamini, Y., Heller, R., Nir, Y., Hasson, U., Malach, R., 2007. Extrinsic and intrinsic systems in the posterior cortex of the human brain revealed during natural sensory stimulation. Cereb. Cortex 17, 766–77. doi:10.1093/cercor/bhk030
ACCEPTED MANUSCRIPT
34
subdivision of the human cortex into two global systems. Neuropsychologia 46, 540–53. doi:10.1016/j.neuropsychologia.2007.10.003
Greicius, M.D., Krasnow, B., Reiss, A.L., Menon, V., 2003. Functional connectivity in the resting brain: a network analysis of the default mode hypothesis. Proc. Natl. Acad. Sci. U. S. A. 100, 253–8. doi:10.1073/pnas.0135058100
Guerra-Carrillo, B., Mackey, A.P., Bunge, S.A., 2014. Resting-State fMRI: A Window into Human Brain Plasticity. Neurosci. 20, 522–533. doi:10.1177/1073858414524442
Hagoort, P., 2005. On Broca, brain, and binding: a new framework. Trends Cogn. Sci. 9, 416–23. doi:10.1016/j.tics.2005.07.004
Hampson, M., Peterson, B.S., Skudlarski, P., Gatenby, J.C., Gore, J.C., 2002. Detection of functional connectivity using temporal correlations in MR images. Hum. Brain Mapp. 15, 247–62.
doi:10.1002/hbm.10022
Heine, L., Bahri, M. A., Cavaliere, C., Soddu, A., Laureys, S., Ptito, M., Kupers, R., 2015. Prevalence of increases in functional connectivity in visual, somatosensory and language areas in congenital blindness. Front. Neuroanat. 9. doi:10.3389/fnana.2015.00086
Hertz, U., Amedi, A., 2010. Disentangling unisensory and multisensory components in audiovisual integration using a novel multifrequency fMRI spectral analysis. Neuroimage 52, 617–32. doi:10.1016/j.neuroimage.2010.04.186
Hodge, M.R., Horton, W., Brown, T., Herrick, R., Olsen, T., Hileman, M.E., McKay, M., Archie, K. a., Cler, E., Harms, M.P., Burgess, G.C., Glasser, M.F., Elam, J.S., Curtiss, S.W., Barch, D.M., Oostenveld, R., Larson-Prior, L.J., Ugurbil, K., Van Essen, D.C., Marcus, D.S., 2015.
ConnectomeDB—Sharing human brain connectivity data. Neuroimage. doi:10.1016/j.neuroimage.2015.04.046
Johnson, M.D., Ojemann, G.A., 2000. The role of the human thalamus in language and memory: evidence from electrophysiological studies. Brain Cogn. 42, 218–30.
doi:10.1006/brcg.1999.1101
Kalloniatis, M., Fletcher, E.L., 2004. Retinitis pigmentosa: understanding the clinical presentation, mechanisms and treatment options. Clin. Exp. Optom. 87, 65–80.
Heckenlively J.T.R, "Good days, bad days", in Retinitis Pigmentosa, Philadelphia, Lippincott, 1988, p 73.
Lee, D.S., Lee, J.S., Oh, S.H., Kim, S.K., Kim, J.W., Chung, J.K., Lee, M.C., Kim, C.S., 2001. Cross-modal plasticity and cochlear implants. Nature 409, 149–50. doi:10.1038/35051653
Li, J., Liu, Y., Qin, W., Jiang, J., Qiu, Z., Xu, J., Yu, C., Jiang, T., 2013. Age of onset of blindness affects brain anatomical networks constructed using diffusion tensor tractography. Cereb. Cortex 23, 542–51. doi:10.1093/cercor/bhs034
Liu, Y., Yu, C., Liang, M., Li, J., Tian, L., Zhou, Y., Qin, W., Li, K., Jiang, T., 2007. Whole brain functional connectivity in the early blind. Brain 130, 2085–96. doi:10.1093/brain/awm121 Logothetis, N.K., Murayama, Y., Augath, M., Steffen, T., Werner, J., Oeltermann, A., 2009. How not
to study spontaneous activity. Neuroimage 45, 1080–1089. doi:10.1016/j.neuroimage.2009.01.010
Masuda, Y., Horiguchi, H., Dumoulin, S.O., Furuta, A., Miyauchi, S., Nakadomari, S., Wandell, B.A., 2010. Task-dependent V1 responses in human retinitis pigmentosa. Invest. Ophthalmol. Vis. Sci. 51, 5356–64. doi:10.1167/iovs.09-4775
ACCEPTED MANUSCRIPT
35
signal regression on resting state correlations: Are anti-correlated networks introduced? Neuroimage 44, 893–905. doi:10.1016/j.neuroimage.2008.09.036
Noppeney, U., Friston, K.J., Price, C.J., 2003. Effects of visual deprivation on the organization of the semantic system. Brain 126, 1620–7. doi:10.1093/brain/awg152
Pascual-Leone, A., Amedi, A., Fregni, F., Merabet, L.B., 2005. The plastic human brain cortex. Annu. Rev. Neurosci. 28, 377–401. doi:10.1146/annurev.neuro.27.070203.144216
Pessoa, L., and De Weerd, P. (Eds.). (2003). Filling-in: From perceptual completion to cortical reorganization. Oxford University Press. Chapter 5 Page 98
Price, C.J., 2010. The anatomy of language: a review of 100 fMRI studies published in 2009. Ann. N. Y. Acad. Sci. 1191, 62–88. doi:10.1111/j.1749-6632.2010.05444.x
Raz, N., Amedi, A., Zohary, E., 2005. V1 activation in congenitally blind humans is associated with episodic retrieval. Cereb. Cortex 15, 1459–68. doi:10.1093/cercor/bhi026
Raichle, M.E., MacLeod, a M., Snyder, a Z., Powers, W.J., Gusnard, D. a, Shulman, G.L., 2001. A default mode of brain function. Proc. Natl. Acad. Sci. U. S. A. 98, 676–82.
doi:10.1073/pnas.98.2.676
Reislev, N.L., Dyrby, T.B., Siebner, H.R., Kupers, R., Ptito, M., 2016. Simultaneous Assessment of White Matter Changes in Microstructure and Connectedness in the Blind Brain. Neural Plast. 2016, 6029241. doi:10.1155/2016/6029241
Sadato, N., Okada, T., Honda, M., Yonekura, Y., 2002. Critical period for cross-modal plasticity in blind humans: a functional MRI study. Neuroimage 16, 389–400. doi:10.1006/nimg.2002.1111 Särkämö, T., Tervaniemi, M., Laitinen, S., Forsblom, A., Soinila, S., Mikkonen, M., Autti, T.,
Silvennoinen, H.M., Erkkilä, J., Laine, M., Peretz, I., Hietanen, M., 2008. Music listening enhances cognitive recovery and mood after middle cerebral artery stroke. Brain 131, 866–876. doi:10.1093/brain/awn013
Sarubbo, S., De Benedictis, A., Maldonado, I.L., Basso, G., Duffau, H., 2013. Frontal terminations for the inferior fronto-occipital fascicle: Anatomical dissection, DTI study and functional
considerations on a multi-component bundle. Brain Struct. Funct. 218, 21–37. doi:10.1007/s00429-011-0372-3
Sereno, M.I., Dale, a M., Reppas, J.B., Kwong, K.K., Belliveau, J.W., Brady, T.J., Rosen, B.R., Tootell, R.B., 1995. Borders of multiple visual areas in humans revealed by functional magnetic resonance imaging. Science 268, 889–93.
Shmuel, A., Augath, M., Oeltermann, A., Logothetis, N.K., 2006. Negative functional MRI response correlates with decreases in neuronal activity in monkey visual area V1. Nat. Neurosci. 9, 569– 577. doi:10.1038/nn1675
Shmuel, A., Yacoub, E., Pfeuffer, J., Van de Moortele, P.-F., Adriany, G., Hu, X., Ugurbil, K., 2002. Sustained Negative BOLD, Blood Flow and Oxygen Consumption Response and Its Coupling to the Positive Response in the Human Brain. Neuron 36, 1195–1210.
doi:10.1016/S0896-6273(02)01061-9
Shu, N., Liu, Y., Li, J., Li, Y., Yu, C., Jiang, T., 2009. Altered anatomical network in early blindness revealed by diffusion tensor tractography. PLoS One 4, 1–13. doi:10.1371/journal.pone.0007228 Shulman, G.L., Fiez, J. a., Corbetta, M., Buckner, R.L., Miezin, F.M., Raichle, M.E., Petersen, S.E.,
1997. Common Blood Flow Changes across Visual Tasks: II. Decreases in Cerebral Cortex. J. Cogn. Neurosci. 9, 648–663. doi:10.1162/jocn.1997.9.5.648
Smith, S.M., Fox, P.T., Miller, K.L., Glahn, D.C., Fox, P.M., Mackay, C.E., Filippini, N., Watkins, K.E., Toro, R., Laird, A.R., Beckmann, C.F., 2009. Correspondence of the brain’s functional