HAL Id: inserm-00624803
https://www.hal.inserm.fr/inserm-00624803
Submitted on 19 Sep 2011
HAL is a multi-disciplinary open access
archive for the deposit and dissemination of
sci-entific research documents, whether they are
pub-lished or not. The documents may come from
teaching and research institutions in France or
abroad, or from public or private research centers.
L’archive ouverte pluridisciplinaire HAL, est
destinée au dépôt et à la diffusion de documents
scientifiques de niveau recherche, publiés ou non,
émanant des établissements d’enseignement et de
recherche français ou étrangers, des laboratoires
publics ou privés.
A low alpha-linolenic intake during early life increases
adiposity in the adult guinea pig.
Etienne Pouteau, Olivier Aprikian, Catherine Grenot, Denis Reynaud, Cecil
Pace-Asciak, Claude Cuilleron, Eurídice Castañeda-Gutiérrez, Julie Moulin,
Gregory Pescia, Carine Beysen, et al.
To cite this version:
Etienne Pouteau, Olivier Aprikian, Catherine Grenot, Denis Reynaud, Cecil Pace-Asciak, et al.. A
low alpha-linolenic intake during early life increases adiposity in the adult guinea pig.. Nutrition &
metabolism, 2010, 7 (1), pp.8. �10.1186/1743-7075-7-8�. �inserm-00624803�
R E S E A R C H
Open Access
A low
a-linolenic intake during early life increases
adiposity in the adult guinea pig
Etienne Pouteau
1*, Olivier Aprikian
1, Catherine Grenot
2, Denis Reynaud
3, Cecil Pace-Asciak
3, Claude Yves Cuilleron
2,
Eurídice Castañeda-Gutiérrez
1, Julie Moulin
1, Gregory Pescia
1, Carine Beysen
4, Scott Turner
4, Katherine Macé
1Abstract
Background: The composition of dietary fatty acids (FA) during early life may impact adult adipose tissue (AT) development. We investigated the effects ofa-linolenic acid (ALA) intake during the suckling/weaning period on AT development and metabolic markers in the guinea pig (GP).
Methods: Newborn GP were fed a 27%-fat diet (w/w %) with high (10%-ALA group), moderate (2.4%-ALA group) or low (0.8%-ALA group) ALA content (w/w % as total FA) until they were 21 days old (d21). Then all animals were switched to a 15%-fat diet containing 2% ALA (as total FA) until 136 days of age (d136).
Results: ALA and docosapentaenoic acid measured in plasma triglycerides (TG) at d21 decreased with decreasing ALA intake. Total body fat mass was not different between groups at d21. Adipose tissue TG synthesis rates and proliferation rate of total adipose cells, as assessed by2H2O labelling, were unchanged between groups at d21,
while hepatic de novo lipogenesis was significantly 2-fold increased in the ALA group. In older GP, the 0.8%-ALA group showed a significant 15-%-increased total fat mass (d79 and d107, p < 0.01) and epididymal AT weight (d136) and tended to show higher insulinemia compared to the 10%-ALA group. In addition, proliferation rate of cells in the subcutaneous AT was higher in the 0.8%-ALA (15.2 ± 1.3% new cells/5d) than in the 10%-ALA group (8.6 ± 1.7% new cells/5d, p = 0.021) at d136. AT eicosanoid profiles were not associated with the increase of AT cell proliferation.
Conclusion: A low ALA intake during early postnatal life promotes an increased adiposity in the adult GP.
Introduction
Worldwide, about 1.3 billion of individuals suffer of excessive adiposity, 940 million are overweight and 400 million are obese [1]. This epidemic is driven by a wide-spread energy imbalance, with energy intake exceeding energy expenditure. Nevertheless, individual differences in the susceptibility to gain an excess of fat mass, in obesogenic environments exist. In addition to genetic factors there is a growing body of evidence, from epide-miological and animal studies, that perinatal nutrition may substantially predispose to the development of obe-sity. Fetal over and under-nutrition promotes adiposity later in life in different animal models [2,3] and infants small for gestational age appear to have a higher risk of developing adult obesity [4]. Our understanding of the
factors and mechanisms, by which perinatal nutrition impacts later susceptibility to obesity, remains limited. Nevertheless, the early nutritional environment may set adipose tissue growth and function towards either fat storage or oxidation, later in life [5]. There is some evi-dence that the composition of dietary fatty acids and especially the essential polyunsaturated fatty acids (PUFA), linoleic acid (LA; C18:2n-6) and a-linolenic acid (ALA; C18:3n-3) and their respective long-chain products, arachidonic acid (AA; C20:4n-6), eicosapentae-noic acid (EPA; C20:5n-3) and docosahexaeeicosapentae-noic acid (DHA; C22:6n-3) influence early adipose tissue develop-ment. These effects may be mediated by eicosanoids, and more especially by prostaglandins (PG; PGD2, PGE2,
PGF2a, PGI2), involved in adipose tissue growth and
metabolism and dependent on the long-chain PUFA availability [6]. Animal studies showed that the intake of a high LA/ALA ratio during fetal and postnatal life pro-motes early adipose tissue growth and obesity [7,8].
* Correspondence: etienne.pouteau@rdls.nestle.com
1Nestlé Research Centre, PO Box 44, Vers-Chez-Les-Blanc, 1000 Lausanne 26, Switzerland
© 2010 Pouteau et al; licensee BioMed Central Ltd. This is an Open Access article distributed under the terms of the Creative Commons Attribution License (http://creativecommons.org/licenses/by/2.0), which permits unrestricted use, distribution, and reproduction in any medium, provided the original work is properly cited.
Nevertheless, since enhancing the LA/ALA ratio in the diet implies either a substantial increase of LA [8], a decrease of ALA [7] or both [8], it is difficult to deter-mine if the n-6 PUFA promote adipose tissue develop-ment or if the n-3 PUFA have anti-adipogenic properties. Because, the adipogenic effects of the n-6 PUFA remain controversial [9], we hypothesized that a low level of ALA rather than an excess of LA leads to an increased adiposity. In order to test part of this hypothesis, 3 groups of newborn guinea pigs (GP) were fed until 21 days of age with milk and pellets containing either a high (10% total FA), medium (2.4% total FA) or low but adequate (0.8% total FA) ALA content corre-sponding respectively to a LA/ALA ratio of 2:1, 10:1 and 30:1. The short and long term consequences of such early postnatal dietary interventions on adipose tis-sue development and metabolic markers were determined.
Materials and methods
Animals and diets
All experimental procedures were reviewed and approved by the Swiss authorities ethical committee (authorization 1910, “Service vetérinaire du canton de Vaud”). Male and female Dunkin-Hartley guinea pigs (450-500 g of body weight) were purchased from Charles-River (Lyon, France) and housed together for mating. The guinea pigs received a commercial chow diet (Kliba 3420, Promivi Kliba SA, Kaiseraugst, Switzer-land) during mating and gestation period. At birth, pups remained with their dams for 2 days, and afterwards the male pups were nourished with one of the following 27%-fat diets (w/w) differing in ALA content: 10%-ALA (high), 2.4%-ALA (moderate) or 0.8%-ALA (low, w/w % as total FA) until d21. From d2 to d4 the pups received reconstituted milk formula and from d5 to d21 food pel-lets. Milk formula and pellet composition is provided in Table S1, Additional file 1 and the fatty acid profile is detailed in Table S2, Additional file 2. From d21 to d136, all guinea pigs received a 15%-fat diet based on D22451 formulation (Research Diets, New Brunswick, NJ). Coconut oil, corn oil, palm oil and rapeseed oil (Sofinol S.A. Manno, Switzerland) were mixed with ingredients of D224521 diet. Corn starch was added (Schweizerhall Chemie, Basel, Switzerland) and lard, soybean oil and maltodextrin were removed. The diet contained 32.6% saturated fat, 39.2% monounsaturated fat and 28.2% PUFA among them 26% LA and 2% ALA. Twenty grams of timothy hay (Bio-Serv, Frenchtown, NJ) was added weekly.
Study design
The male pups were randomized by body weight and assigned to 10%-ALA group (n = 25), 2.4%-ALA group (n = 20) or 0.8%-ALA group (n = 25) during the
suckling/weaning period until d21, and then all groups were fed a common diet until the end of the experi-ment. Body weight and food intake were recorded every morning until d21 and then every 3 d until d136. Gui-nea pigs were euthanized by exsanguination under iso-fluorane anesthesia at d21 (10 pups for 10%-ALA and 0.8%-ALA groups and 5 pups for 2.4%-ALA group) and at d136 (15 animals/group). Ten animals from 10%-ALA and 0.8%-ALA groups received deuterated water (2H2O)
for determination of cell proliferation and lipid synthesis rate at d21 and d136 [10-12]. These animals received
2
H2O (99%, sterilized 0.9% NaCl, 35 mg/g of BW)
intra-peritoneally 5 d before euthanasia, thereafter, they drank 8% deuterated water ad libitum until euthanasia. Blood (200 μL) was collected from the aorta in heparinised vials. Bone marrow from the femur of the hind limb (flushed by 0.9%-NaCl-water using a 25G-needle-ser-inge), adipose tissue, and liver were collected (about 50 mg) and weighed. All tissues and plasma were kept at -80°C until analyses. Additionally and for the other ani-mals, venous blood was collected from the saphenous vein prior sacrifice for metabolite analyses. Retroperito-neal, epididymal, interscapular and subcutaneous adi-pose tissue, as well as the liver and the pancreas were collected and weighed. The body composition of animals was determined at regular intervals.
Analytical procedure Fatty acid (FA) analysis
Total lipids of diet and plasma were extracted, and FA profile of plasma phospholipids (PL) and TG was deter-mined in 4 animals per group as previously described [9].
Biochemical assays
Plasma TG, FFA and glucose concentrations were ana-lyzed with commercially available kits (Roche Diagnos-tic, Basel, Switzerland; Wako Chemicals, Richmond, VA and Sigma, Buchs, Switzerland, respectively).
Guinea pig insulin purification and immunization
Guinea pig insulin was isolated from frozen pancreas according to Yip & Ottensmeyer [13]. Purification was improved by three successive chromatographies during which the insulin-containing fractions were detected by measurement of the radioactivity of 125I bovine insulin added as tracer. The overall yield was 2.5 mg of purified insulin per 20 pancreas of guinea pig. Degree of purity of purified insulin was first controlled by reverse-phase HPLC (300-5-C18 column, Macherey-Nagel, France) that showed the presence of a major protein peak (>90%) and by SDS-PAGE using the Schägger and von Jagow method [14], adapted for the separation of low molecular mass proteins and peptides (≤ 10 kDa). After silver nitrate staining, the gel showed the presence of a single intense band with an apparent mass of 6 kDa, in agreement with the molecular mass of insulin. The
Pouteauet al. Nutrition & Metabolism 2010, 7:8 http://www.nutritionandmetabolism.com/content/7/1/8
degree of purity was higher than 90%. An electrospray mass spectrum of the purified fraction showed the pre-sence of three multicharged [M+nH+] ions correspond-ing to a scorrespond-ingle protein of molecular mass M of 5778.5, in agreement with the mass of 5778.4, calculated for guinea pig insulin. A radioactive insulin tracer was pre-pared by radioiodination of 3μg of purified insulin with 400 μCi of 125I iodine using the chloramine T method in the conditions employed for the radiolabeling of bovine insulin. Radiolabeled insulin was purified on Sephadex G50 column and a fraction corresponding to the top of the radioactive peak was collected and used as tracer to test rabbit antibodies. Immunization of rab-bits was initiated by 4 successive injections. After the first six months of immunization titers of both rabbits were measured at 1/10,000 and remained stable up to now (one year of immunization). An estimation of the specificity was done by the determination of cross-reac-tivity with human, bovine, rabbit and mouse sera that showed no cross-reaction with human, bovine and mouse sera.
Radio-immunoassay (RIA) for guinea pig insulin
RIA was developed with rabbit antiserum incubated with the radioactive 125I insulin tracer and different concentrations of purified insulin as standard hormone. The assay was performed with serum or plasma obtained after collection of blood samples on EDTA. Owing to the low concentrations observed in young gui-nea pigs, the standard curve was established with eight concentrations of standard insulin ranging from 0.5 to 100 ng.mL-1. The best standard curve was obtained with an amount of 35’000-cpm/per tubes. Rabbit anti-serum at a dilution of 1/10,000, were found to be suita-ble for the establishment of the standard curve. Incubation for 20 hours at 20°C led to the highest bound fractions along with the lowest non-specific bind-ing. The RIA program of the gamma counter was employed using the LOGIT/log curve fitting. Reproduci-bility and accuracy (spiking and dilution test) controls were performed to assess of the values of insulin con-centration. The RIA developed with rabbit antibodies showed a sensitivity of 1 ng.mL-1.
The pancreatic insulin content
The insulin was extracted from pancreas by acid-ethanol solution at -20°C overnight [15]. The insulin content in the supernatant was assessed by above developed RIA method and expressed in ng.μg-1
of protein.
Eicosanoid analysis
Adipose tissue (50 mg) was homogenized with distilled ethanol (3 mL) as previously detailed [9]. The lipid supernatant was then dried under nitrogen, dissolved with 50μL of ethanol/1 mL water and extracted with ethyl acetate after acidification. The ethyl acetate extract was dried and dissolved in acetonitrile/water for analysis
of eicosanoids by liquid chromatography-mass spectro-metry (LC-MS/MS) using selected ion monitoring [9].
Determination of deuterium enrichments in DNA and lipids
The measure of 2H-enrichments in DNA and in lipids has been previously detailed [11,16,17]. Briefly, cellular DNA from the adipose depot (> 20 mg of tissue) was isolated. After sequential hydrolysis genomic deoxyri-bose moiety was obtained from deoxyadenosine. Deox-yribose was then acetylated into pentose-tetraacetate derivative and analyzed by gas chromatograph/mass spectrometer (GC/MS, Hewlett-Packard, Palo Alto, CA) for measurement of2H-isotope enrichments [17]. Sepa-rately, adipose TG were isolated for analyses of 2 H-enrichments of TG-glycerol and of TG-palmitate by GC/MS as described elsewhere [12,18-20]. Deuterium enrichment in body water was measured from plasma (20μL) as described previously [21]. Standard curves of known2H-enrichments (EM1 in % excess) of the meta-bolites were used to assess2H-isotope enrichments [20].
Calculations of fractional synthesis rates
Use of 2H2O incorporation for the measurements of
DNA replication rate (cell proliferation rate), gly-cerol synthesis rate (all-source TG turnover) and TG-palmitate synthesis rate (all-source DNL) has been described [12,20]. The method counts the cell divisions that occurred during the labeling period. The fractional proliferation rate of adipose tissue cells (fractional synthesis rate, FSRcellin % new cell/5 d) identical to the
fraction of newly synthesized DNA was calculated as the
2
H-enrichment in adipose tissue DNA divided by 2 H-enrichment in bone marrow DNA [11,22]. The principle for calculating the fractional synthesis rate of TG (FSRTG) in adipose tissues is that TG that were
synthe-sized from endogenous alpha-glycerol phosphate before
2
H2O was present, do not contain covalent C-2H label
in their glycerol moiety, thereby allowing the proportion of newly synthesized vs. pre-existing TG to be assessed [20]. Glycerol kinase in the liver overestimates the calcu-lation of FSRTGin the liver. The FSRTG (in % new TG/5
d) was calculated from the ratio of EM1TG to A1,
where EM1TGis2H-enrichment for glycerol at 5 d, and
A1 is the maximal 2H-enrichment for glycerol [12]. The fractional synthesis rate of palmitate (DNL contri-bution to palmitate, FSRpalmitatein % new palmitate/5 d)
in TG was calculated from the label 2H-incorporation from water into TG-palmitate using MIDA (mass isoto-pomer distribution analysis) [23].
Body composition
Body composition of pups was determined at 2, 21, 51, 79, 107 and 128 days of age using a 0.05-Tesla-Magnetic Resonance Imaging (EchoMRITM 400, Echo Medical Systems, Houston, TX, US). Calculation and interpreta-tion were performed according to Taicher GZ [24] and Tinsley FC [25].
Statistical analysis
According to distribution of data, non-parameteric tests were used for most outcomes (Global kruskal-Wallis tests and Mann-Whitney-Wilcoxon tests for pairwise comparisons). Outcomes were expressed as Median and Standard Error of the Median (SEmedian) based on the robust Sn of Rousseeuw. Comparisons of tissues based on eicosanoids were done using Wilcoxon Signed Rank tests. A low number of data on the FA profile was suffi-cient to illustrate differences, although low number of data involves cautious interpretation. A parametric mixed model was used for NMR analysis, with subject as random effect. These parameters are thus described by the Mean and the Standard Error of the Mean (SEM).
Results
Food intake was not different between groups. The mean cumulative food intake was 118.1 ± 5.8 g (10%-ALA), 124.6 ± 7.0 g (2.4%-ALA) and 125.1 ± 10.7 g (0.8%-ALA group) from d9 to d18 and was 3013.3 ± 228.7 g (10%-ALA), 3138.6 ± 166.2 g (2.4%-ALA) and 3231.4 ± 119.9 g (0.8%-ALA group) from d23 to d129.
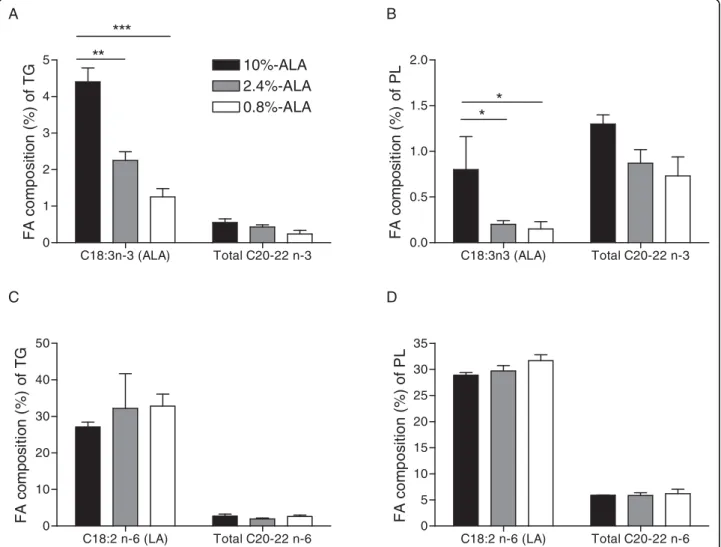
Fatty acid profile of plasma lipids was determined at the end of the dietary intervention period (d21). Inclu-sion of 10% ALA in the diet resulted in its increase in plasma TG and PL (TG: 4.40 ± 0.35%; PL: 0.80 ± 0.26%, figures 1A and 1B), but the increase was not significant with the addition of 2.4% ALA (TG: 2.25 ± 0.23%; PL: 0.20 ± 0.01% and TG: 1.25 ± 0.37%; PL: 0.15 ± 0.07% for 2.4% ALA and 0.8% ALA, respectively). The propor-tion of total C20-22 n-3 PUFA, including eicosapentae-noic acid (EPA), docosapentaeeicosapentae-noic acid (DPA) and docosahexaenoic acid (DHA), in plasma TG (figure 1A) and PL (figure 1B) tended to decrease with decreasing ALA intake, but this effect did not reach statistical sig-nificance (p = 0.09 and p = 0.07 for PL and TG, respec-tively), except for DPA in TG and for EPA in PL. The 0.8%-ALA group (0.01 ± 0.01 mol %) had lower DPA in TG than both other groups (2.4%-ALA: 0.20 ± 0.12, p < 0.05 and 10%-ALA: 0.20 ± 0.01 mol %, p = 0.06). For EPA in PL, there was a significant difference between 10%-ALA group (0.10 ± 0.01 mol %) and 0.8%-ALA group (0.01 ± 0.01 mol %, p = 0.018). As expected, there was no difference in plasma LA between groups and increasing ALA intake did not modify the propor-tion of n-6 PUFA (figures 1C and 1D).
The body weight (BW; 10%-ALA: 869.3 ± 54.2 g; 2.4%-ALA: 860.7 ± 29.6 g and 0.8%-ALA group: 902.3 ± 25.7 g at d136) and BW gain (data not shown) did not differ between groups during the course of the experiment.
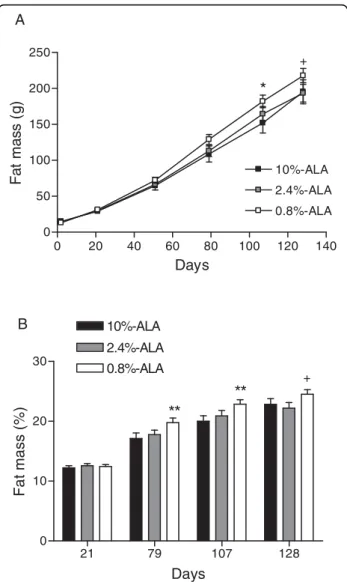
Decreased intake of ALA during early life resulted in increased body fat at 136 days; Figure 2 shows the fat
mass evolution during the course of the study expressed as g (figure 2A) or % body weight (figure 2B). While no differences were observed at the end of the dietary inter-vention period (d21), older guinea pigs in the 0.8%-ALA group had or tended to have more fat mass than those in the 10%-ALA group at d79 (figure 2A: +20.3 g, p = 0.08; figure 2B: +2.6%, p < 0.01), at d107 (+29.9 g, p < 0.05; +2.8%, p < 0.01) and at d128 (+22.6 g, p = 0.05; +1.7%, p = 0.08) and than those in the 2.4%-ALA group at d128 (+24.2 g, p < 0.05; +2.2%, p < 0.05).
Likewise, at d 136, epididymal AT was or tended to be heavier in the 0.8%-ALA than in the 10%-ALA (+0.19 g/ 100 g BW, p < 0.05) and the 2.4%-ALA group (+0.16 g/ 100 g BW, p = 0.05). The interscapular AT weight also was higher in the 0.8% than in the 2.4%-ALA groups (+0.18 g/100 g BW, p < 0.01). The weights of epididy-mal, interscapular and retroperitoneal AT relative to BW were not different between groups at d21 (Table S3, Additional file 3). The liver weight as well as the pancreas weight did not differ between groups at d21 and d136 (data not shown).
The fractional proliferation rates (FSR) of cells, mea-sured in the retroperitoneal and epididymal AT, were unchanged between 10%-ALA and 0.8%-ALA groups at both d21 and d136 (Table 4, Additional file 4). Nonethe-less, the cell proliferation rate in the subcutaneous AT was higher in the 0.8%-ALA group compared to the 10%-ALA group at d21 (2.1-fold higher; not significant) and d136 (1.8-fold higher; p = 0.021) (Table 4, Addi-tional file 4).
The de novo lipogenesis (DNL) and synthesis rate of TG in the different adipose fat pads did not differ between the 10%- and 0.8%-ALA groups at d21 (Table 5, Additional file 5). A higher hepatic DNL (P < 0.001) was observed at d21 in guinea pigs fed 0.8%-ALA intake compared to 10%-ALA intake (Table 5, Additional file 5). No difference was observed in DNL or synthesis rate of TG in hepatic or adipose tissues between groups at d136 (Table 5, Additional file 5).
The arachidonic acid (AA) and most eicosanoid con-centrations determined in retroperitoneal and subcuta-neous fat pads were not different between the groups (Table 6, Additional file 6). An exception was observed for PGE2 and PGJ2 that were both significantly higher after medium vs low ALA intake at d136 (Table 6, Additional file 6). In order to evaluate the AT differ-ences, the groups were combined and the eicosanoid profile was compared between the fat depots at both ages. At d21, AA, 6-keto-PGF1a and PGJ2
concentra-tions were 1.6-fold (244.7 ± 24.9 vs 149.6 ± 14.0 ng/50 mg AT, p < 0.01), 3.7-fold (1.95 ± 0.10 vs 0.52 ± 0.09 ng/50 mg AT, p < 0.0001) and significantly (0.015 ± 0.001 vs 0.001 ± 0.001 ng/50 mg AT, p < 0.0001) higher in the retroperitoneal AT when compared to the
Pouteauet al. Nutrition & Metabolism 2010, 7:8 http://www.nutritionandmetabolism.com/content/7/1/8
subcutaneous one, respectively. At d136, the difference of PGJ2 concentrations was even higher between the
ret-roperitoneal (1.53 ± 0.35 ng/50 mg AT) and subcuta-neous (0.01 ± 0.01 ng/50 mg AT, p < 0.0001) AT. In addition, 6-keto-PGF1a, PGE2 and PGF2a were 1.5-fold
(p < 0.001), 23-fold (p < 0.0001) and 1.6-fold (p < 0.0001) higher in the retroperitoneal vs subcutaneous AT (data not shown).
The plasma FFA were not different between groups at d21 (data not shown) or at d136 (10%-ALA, 17.6 ± 0.7; 2.4%-ALA, 18.0 ± 0.6 and 0.8%-ALA group, 18.0 ± 1.1 mg.dL-1). The plasma TG concentrations were unchanged at d21 (data not shown) but were 1.3-fold lower in the 0.8%-ALA vs 10%-ALA (1.31 ± 0.05 vs 1.78 ± 0.21 mmol.L-1, p < 0.05) and vs 2.4%-ALA group (1.61 ± 0.15 mmol.L-1, not significant), at d136. There were no differences in plasma insulin concentrations between groups at the end of the suckling/weaning
period (figure 3A). At d136 (figure 3B) the 0.8%-ALA group (6.8 ± 1.5 ng.mL-1) showed about 1.5-fold higher concentrations of plasma insulin when compared with other groups (2.4%-ALA, 4.3 ± 1.3 and 10%-ALA group, 5.1 ± 1.7 ng.mL-1, not significant). Similar results were observed regarding the pancreatic insulin content. The 0.8%-ALA group showed about 1.6-fold increase in the pancreatic insulin content (3.5 ± 0.8 ng.μg-1
of protein) when compared to the 10%-ALA group (2.2 ± 0.3 ng.μg -1
of protein, p = 0.06, not significant) at d136 (figure 3B). There were no significant differences in plasma glu-cose between groups at d21 (data not shown) and neither at d136 (10%-ALA, 112.0 ± 3.3; 2.4%-ALA, 110.0 ± 6.7 and 0.8%-ALA group, 104.5 ± 4.6 mg.dL-1).
Discussion
To our knowledge this is the first study showing that dietary ALA intake during the suckling/weaning period
Figure 1 Fatty acid composition (mol %) of plasma triglycerides (TG) and phospholipids (PL) at d21. Proportion of ALA and total other long-chain n-3 PUFAs (C20:3n-3, C20:5n-3, C22:5n-3, C22:6n-3) in plasma TG (A) and PL (B). Proportion of LA and total other long-chain n-6 PUFAs (C20:2n-6, C20:3n-6, C20:4n-6, C22:2n-6, C22:4n-6) in plasma TG (C) and PL (D). Data are medians ± SEmedian, n = 4-5 samples/group in duplicate. LA, linoleic acid; ALA, alpha-linolenic acid. * p < 0.05, ** p < 0.01, *** p < 0.001 between groups.
influences fat mass development later in life; the lowest dietary ALA intake programming the highest adiposity in the adult guinea pig.
In our study, the adipose tissue development was not impacted during the period of dietary intervention with different ALA levels. Indeed, the fat mass and adipose tissue weight at d21 were not different between the high, moderate and low ALA fed guinea pigs. Our results are in agreement with Korotkova et al. who showed that offspring of rat dams, fed a 6.2% ALA (total FA) enriched diet during the gestation and suck-ling period, did not differ in AT weight at 3 weeks of age compared to a low ALA diet with the same amount of dietary lipids [8]. On the contrary, the dietary intake
of chia seed (rich in ALA) decreased adiposity in adult rats fed an obesegenic diet [26]. Interestingly this effect was associated with a large increase in plasma lipid n-3 LC-PUFAs (EPA and DHA), known to have anti-adipo-genic effects [27], probably through inhibition of the proliferation of adipose tissue cells [27]. While no one can exclude that ALA has its own specific physiological effects on AT development, it is tempting to speculate that these effects are more dependent on its long-chain products. Unlike other rodents and similarly to humans, the efficiency of ALA conversion into its long-chain pro-ducts is limited in guinea pigs [28]. As previously shown in AT and other tissues of the guinea pigs [29], we observed in our study a higher ALA proportion in plasma TG and phospholipids with an increasing ALA intake but with a limited increase of >C20 n-3 PUFA. Indeed, EPA, DPA or DHA represents less than 0.8% of
Figure 2 Fat mass evolution. (A) Fat mass (g) evolution from d21 to 128. (B) Fat mass (% of body weight) at 21, 79, 107 and 128 days. Data are means ± SE, n = 15-20 guinea pigs/group.+indicates p < 0.05 between the 0.8%-ALA and 2.4%-ALA or 10%-ALA groups. * indicates p < 0.05 and ** indicates p < 0.01 between the 0.8%-ALA and 10%-0.8%-ALA groups.
Figure 3 Plasma insulin concentrations and pancreatic insulin contents. (A) Plasma insulin at d21, n = 5 guinea pigs/group. (B) Plasma and pancreas insulin at d136, n = 10-15 guinea pigs/group. Data are medians ± SEmedian, no significant difference.
Pouteauet al. Nutrition & Metabolism 2010, 7:8 http://www.nutritionandmetabolism.com/content/7/1/8
total FA in our study, even in the group with the highest ALA intake, and could explain the absence of impact on the adipose tissue development of the 21-day old guinea pigs. Previous studies have indicated that n-3 LC-PUFAs enriched diets diminish the hepatic enzymatic activities of endogenous fatty acids synthesis [30] associated with a decrease in plasma TG [31,32]. In the present study, the high ALA intake induced a 2-fold reduction of frac-tional DNL in the liver at d21 with no impact on total plasma TG concentration. A higher >20 n-3 PUFA plasma concentration during the high ALA intake could modulate transcription factors in the liver. It is possible that that >20 n-3 PUFAs reduce DNL by down-regulat-ing SREBP-1 (sterol regulatory element-binddown-regulat-ing protein-1) and activating PPAR alpha (peroxisome proliferator-activated receptor alpha) as shown by previous studies [33]. To explain no difference on total plasma TG, we considered that fatty acids for TG synthesis come from the DNL, the dietary source or from the adipose tissue lipolysis. Based on the calculation of the FA contribu-tion from DNL to TG synthesis (ratio of DNL to TG FSR), we estimated that the contributions from the diet-ary source plus the adipose tissues were 72% and 87% for the low and high ALA groups, respectively [10]. Since dietary FA contributed equally between groups, plasma TG containing FA from the adipose tissue may have been greater in the high ALA group compared with low ALA group at d21. It is possible that more plasma TG containing FA from the adipose tissue was utilized by the liver or muscle (e.g. for oxidation). Further analysis of VLDL-TG (very large density lipo-protein-TG) secretion and removal rates in and from the circulation could clarify the unchanged plasma TG. Ultimately the fat mass was unchanged between the groups at the end of the suckling/weaning diet treatment.
The long-term adipogenic effect of a low ALA intake during early postnatal life seems to be more pronounced on subcutaneous than visceral AT. Indeed, the 2 to 3% differences of total fat mass found between the low and high ALA group at d107 and d128 may not be explained by the observed difference of epididymal fat pad weights, knowing that the visceral fat depots (calculated by sum-ming the weight of epididymal, retroperitoneal and mesenteric AT) represent only about 18% of total fat mass in the adult GP. The subcutaneous adipose tissue which represents the major fat depot in adult (about 80%) revealed a significant increase in cell proliferation in adults after the 0.8% ALA versus 10% ALA postnatal diet treatment. No hyperplasia was noticed in other fat depots after 0.8% ALA intake. This supports a specific role of the subcutaneous adipose tissue. Previous studies indicated a direct effect of n-3 fatty acid enriched diet on decreasing adipocyte differentiation and increasing
apoptosis in vitro [34] and in high-fat fed rats [35]. In the present study, we could not measure the deuterium enrichment decay in DNA to determine the apoptosis rate that could have been lowered in subcutaneous AT of the adult GP of low ALA group. On the contrary, we observed a clear imprinted effect of low ALA early intake on increasing the cell proliferation rate by 75% versus high ALA early intake in the subcutaneous AT of adult GP. In addition, we showed a transient increase of hepatic DNL in the low ALA group at d21 that could be involved in the imprinting mechanism. Further inves-tigations are needed to clarify the mechanism.
Interestingly, the 0.8% ALA group had higher insulin at the end of the experiment, though the differences between groups did not reach statistical significance due to a high variability. This tendency for higher insuline-mia is probably linked to an increased adiposity, as known for other animal species and human. We found a positive correlation between insulin (expressed as log) and fat mass in the adult guinea pigs (Pearson r = 0.77, p < 0.0001). Although all in a normal range [36], plasma TG were significantly higher in the high versus medium and low ALA groups at d136. This was not associated with an increased adipose tissue FSR of total TG in the high ALA group. Previous studies showed the capabil-ities of n-3 LC-PUFAs to modulate lipolysis and conse-quently alter TG level [27,37]. Although we described a possible imprinted effect in the present study, the increased plasma TG could be due to an increased lipo-lysis to support a lower fat mass in the adult GP of high ALA group.
The mechanism by which a low ALA intake programs an excess of adipose tissue is unclear. It may imply cell proliferation as indicated in the present study by the increase of fractional proliferation rate of cells in the subcutaneous AT. Because eicosanoids are modulated by LC-PUFAs and are involved in the differentiation and proliferation of adipose tissue cells we expected to see differences between groups [38]. Beside the large dif-ferences between the types of fat depots (visceral vs sub-cutaneous) on eicosanoid levels, we found only minor changes between groups and none in subcutaneous AT. Further studies are definitely needed to understand the mechanism by which early dietary ALA impacts adipo-genesis and lipoadipo-genesis later in life. The Guinea Pig represents a good model to the human term newborn [39] but shows some experimental limitations due to the lack of commercially available immunological kits and epigenetic markers. This may change with the recent first release of the genome sequencing and assembly of the Guinea Pig [40]. Future investigations using the Gui-nea Pig model will help understanding the mechanisms by which early nutrition may program adiposity later in life. It would be also interesting to evaluate whether the
programming effect of a low ALA intake may have been more pronounced with dietary interventions including gestation and/or with more obesogenic post-weaning diets (e.g., high fat/high sucrose diet).
Our main finding shows that a suboptimal ALA intake during suckling/weaning promotes the susceptibility to an increased adiposity later in life. It is important to note that the ALA diet (0.8% total FA; 0.16 g ALA/100 g diet), used for the low intake group, does not corre-spond to a deficient diet (0.01 g/100 g diet) as pre-viously described [41]. Interestingly, smoking mothers have lower ALA content in breast milk than non-smok-ing ones [42] and maternal smoknon-smok-ing is associated with an increased risk of late onset overweight [43]. Conse-quently, if relevant to the human newborn, our findings suggest the need of recommending n-3 PUFA supple-mentation in the pregnant/lactating mother with a low ALA intake or at risk of suboptimal breast milk content.
Additional file 1: Table S1 on“Composition of milk formula and weaning diets”. The file contains one table.
Click here for file
[ http://www.biomedcentral.com/content/supplementary/1743-7075-7-8-S1.DOC ]
Additional file 2: Table S2 on“Fatty acid composition of the suckling/weaning diets (milk formula and pellets)”. The file contains one table.
Click here for file
[ http://www.biomedcentral.com/content/supplementary/1743-7075-7-8-S2.DOC ]
Additional file 3: Table S3 on“Adipose tissue (AT) weight (% body weight) at d21 and d136”. The file contains one table.
Click here for file
[ http://www.biomedcentral.com/content/supplementary/1743-7075-7-8-S3.DOC ]
Additional file 4: Table S4 on“Fractional proliferation rate of cells (in % new cells/5 days) in adipose tissue (AT) at d21 and d136”. The file contains one table.
Click here for file
[ http://www.biomedcentral.com/content/supplementary/1743-7075-7-8-S4.DOC ]
Additional file 5: Table S5 on“De novo lipogenesis (DNL) and fractional synthesis rate (FSR) of TG in the liver and adipose tissues (AT) at d21 and d136”. The file contains one table.
Click here for file
[ http://www.biomedcentral.com/content/supplementary/1743-7075-7-8-S5.DOC ]
Additional file 6: Table S6 on“Eicosanoid and AA concentrations (ng/50 mg tissue) in retroperitoneal and subcutaneous AT at d21 and d136”. The file contains one table.
Click here for file
[ http://www.biomedcentral.com/content/supplementary/1743-7075-7-8-S6.DOC ]
Acknowledgements
We particularly thank Corinne Ammon-Zufferey and Irina Monnard for their major contribution to the animal study. We are grateful to the animal house staff, especially Massimo Marchesini, Muriel Briand and Christophe Maubert. The present work was financed by Nestec Ltd and has been carried out in the frame of the European Community project entitled“Early nutrition programming-long term follow up of efficacy and safety trials and
integrated epidemiological, genetic, animal, consumer and economic research”, EARNEST, (Food-CT-2005-007036 FP 6 priority 5.4.3.1 Food quality and safety).
Author details
1Nestlé Research Centre, PO Box 44, Vers-Chez-Les-Blanc, 1000 Lausanne 26, Switzerland.2Institut National de la Santé et de la Recherche Médicale, ERM 322, Hôpital Debrousse, 69322 Lyon, France.3Research Institute, Rm 2032F, E McMaster Bldg, The Hospital for Sick Children, Toronto, Canada.4KineMed Ltd, 5980 Horton Street, Suite 400, Emeryville, CA 94608, USA.
Authors’ contributions
EP wrote the manuscript and designed the use of the deuterium approach. OA designed and conducted the study. CG and CC developed the specific insulin analysis for GP. DR and CPA contributed with the eicosanoid analyses. ECG interpreted the data and drafted the manuscript. JM and GP performed the statistics. CB and ST developed the deuterium approach and did the analyses. KM directed the study and wrote the manuscript. All authors read and approved the final manuscript.
Competing interests
EP, OA, ECG, JM, GP and KM authors work for Nestle Company. Received: 4 December 2009
Accepted: 29 January 2010 Published: 29 January 2010 References
1. Kelly T, Yang W, Chen CS, Reynolds K, He J: Global burden of obesity in 2005 and projections to 2030. Int J Obes (Lond) 2008, 32:1431-1437. 2. Gardner DS, Tingey K, Van Bon BW, Ozanne SE, Wilson V, Dandrea J,
Keisler DH, Stephenson T, Symonds ME: Programming of glucose-insulin metabolism in adult sheep after maternal undernutrition. Am J Physiol Regul Integr Comp Physiol 2005, 289:R947-R954.
3. Bieswal F, Ahn MT, Reusens B, Holvoet P, Raes M, Rees WD, Remacle C: The importance of catch-up growth after early malnutrition for the programming of obesity in male rat. Obesity (Silver Spring) 2006, 14:1330-1343.
4. Meas T, Deghmoun S, Armoogum P, Alberti C, Levy-Marchal C: Consequences of being born small for gestational age on body composition: an 8-year follow-up study. J Clin Endocrinol Metab 2008, 93:3804-3809.
5. Budge H, Sebert S, Sharkey D, Symonds ME: Session on‘Obesity’. Adipose tissue development, nutrition in early life and its impact on later obesity. Proc Nutr Soc 2009, 68:321-326.
6. MacDougald OA, Mandrup S: Adipogenesis: forces that tip the scales. Trends Endocrinol Metab 2002, 13:5-11.
7. Massiera F, Saint-Marc P, Seydoux J, Murata T, Kobayashi T, Narumiya S, Guesnet P, Amri EZ, Negrel R, Ailhaud G: Arachidonic acid and prostacyclin signaling promote adipose tissue development: a human health concern?. J Lipid Res 2003, 44:271-279.
8. Korotkova M, Gabrielsson B, Lonn M, Hanson LA, Strandvik B: Leptin levels in rat offspring are modified by the ratio of linoleic to alpha-linolenic acid in the maternal diet. J Lipid Res 2002, 43:1743-1749.
9. Aprikian O, Reynaud D, Pace-Asciak C, Leone P, Blancher F, Monnard I, Darimont C, Mace K: Neonatal dietary supplementation of arachidonic acid increases prostaglandin levels in adipose tissue but does not promote fat mass development in guinea pigs. Am J Physiol Regul Integr Comp Physiol 2007, 293:R2006-R2012.
10. Pouteau E, Turner S, Aprikian O, Hellerstein M, Moser M, Darimont C, Fay LB, Mace K: Time course and dynamics of adipose tissue development in obese and lean Zucker rat pups. International Journal of Obesity 2008, 32:648-657.
11. Neese RA, Misell LM, Turner S, Chu A, Kim J, Cesar D, Hoh R, Antelo F, Strawford A, McCune JM, et al: Measurement in vivo of proliferation rates of slow turnover cells by 2H2O labeling of the deoxyribose moiety of DNA. Proc Natl Acad Sci USA 2002, 99:15345-15350.
12. Turner SM, Murphy EJ, Neese RA, Antelo F, Thomas T, Agarwal A, Go C, Hellerstein MK: Measurement of TG synthesis and turnover in vivo by 2H2O incorporation into the glycerol moiety and application of MIDA. Am J Physiol Endocrinol Metab 2003, 285:E790-E803.
Pouteauet al. Nutrition & Metabolism 2010, 7:8 http://www.nutritionandmetabolism.com/content/7/1/8
13. Yip CC, Ottensmeyer P: Three-dimensional structural interactions of insulin and its receptor. J Biol Chem 2003, 278:27329-27332.
14. Schagger H, von Jagow G: Tricine-sodium dodecyl sulfate-polyacrylamide gel electrophoresis for the separation of proteins in the range from 1 to 100 kDa. Anal Biochem 1987, 166:368-379.
15. Portha B, Picon L, Rosselin G: Chemical diabetes in the adult rat as the spontaneous evolution of neonatal diabetes. Diabetologia 1979, 17:371-377.
16. Pouteau E, Beysen C, Saad N, Turner S: Dynamics of adipose tissue development by 2H2O labeling. Methods Mol Biol 2009, 579:337-358. 17. Neese RA, Siler SQ, Cesar D, Antelo F, Lee D, Misell L, Patel K, Tehrani S,
Shah P, Hellerstein MK: Advances in the stable isotope mass spectrometric measurement of DNA synthesis and cell proliferation. Analytical Biochemistry 2001, 298:189-195.
18. Hellerstein MK, Neese RA, Schwarz JM: Model for measuring absolute rates of hepatic de novo lipogenesis and reesterification of free fatty acids. Am J Physiol 1993, 265:E814-E820.
19. Hellerstein MK, Kletke C, Kaempfer S, Wu K, Shackleton CH: Use of mass isotopomer distributions in secreted lipids to sample lipogenic acetyl-CoA pool in vivo in humans. Am J Physiol 1991, 261:E479-E486. 20. Strawford A, Antelo F, Christiansen M, Hellerstein MK: Adipose tissue
triglyceride turnover, de novo lipogenesis, and cell proliferation in humans measured with 2H2O. Am J Physiol Endocrinol Metab 2004, 286: E577-E588.
21. Collins ML, Eng S, Hoh R, Hellerstein MK: Measurement of mitochondrial DNA synthesis in vivo using a stable isotope-mass spectrometric technique. J Appl Physiol 2003, 94:2203-2211.
22. Macallan DC, Fullerton CA, Neese RA, Haddock K, Park SS, Hellerstein MK: Measurement of cell proliferation by labeling of DNA with stable isotope-labeled glucose: studies in vitro, in animals, and in humans. Proc Natl Acad Sci USA 1998, 95:708-713.
23. Hellerstein MK, Neese RA: Mass isotopomer distribution analysis at eight years: theoretical, analytic, and experimental considerations. Am J Physiol 1999, 276:E1146-E1170.
24. Taicher GZ, Tinsley FC, Reiderman A, Heiman ML: Quantitative magnetic resonance (QMR) method for bone and whole-body-composition analysis. Anal Bioanal Chem 2003, 377:990-1002.
25. Tinsley FC, Taicher GZ, Heiman ML: Evaluation of a quantitative magnetic resonance method for mouse whole body composition analysis. Obes Res 2004, 12:150-160.
26. Chicco AG, D’Alessandro ME, Hein GJ, Oliva ME, Lombardo YB: Dietary chia seed (Salvia hispanica L.) rich in alpha-linolenic acid improves adiposity and normalises hypertriacylglycerolaemia and insulin resistance in dyslipaemic rats. Br J Nutr 2009, 101:41-50.
27. Flachs P, Rossmeisl M, Bryhn M, Kopecky J: Cellular and molecular effects of n-3 polyunsaturated fatty acids on adipose tissue biology and metabolism. Clin Sci (Lond) 2009, 116:1-16.
28. Huang YS, Horrobin DF, Manku MS, Mitchell J: Effect of dietary alpha- and gamma-linolenic acid on tissue fatty acids in guinea pigs. Proc Soc Exp Biol Med 1985, 178:46-49.
29. Fu Z, Sinclair AJ: Increased alpha-linolenic acid intake increases tissue alpha-linolenic acid content and apparent oxidation with little effect on tissue docosahexaenoic acid in the guinea pig. Lipids 2000, 35:395-400. 30. Ikeda I, Cha JY, Yanagita T, Nakatani N, Oogami K, Imaizumi K, Yazawa K:
Effects of dietary alpha-linolenic, eicosapentaenoic and docosahexaenoic acids on hepatic lipogenesis and beta-oxidation in rats. Biosci Biotechnol Biochem 1998, 62:675-680.
31. Kim HK, Choi S, Choi H: Suppression of hepatic fatty acid synthase by feeding alpha-linolenic acid rich perilla oil lowers plasma triacylglycerol level in rats. J Nutr Biochem 2004, 15:485-492.
32. Morise A, Mourot J, Riottot M, Weill P, Fenart E, Hermier D: Dose effect of alpha-linolenic acid on lipid metabolism in the hamster. Reprod Nutr Dev 2005, 45:405-418.
33. Jump DB: N-3 polyunsaturated fatty acid regulation of hepatic gene transcription. Curr Opin Lipidol 2008, 19:242-247.
34. Kim HK, Della-Fera M, Lin J, Baile CA: Docosahexaenoic acid inhibits adipocyte differentiation and induces apoptosis in 3T3-L1 preadipocytes. J Nutr 2006, 136:2965-2969.
35. Perez-Matute P, Perez-Echarri N, Martinez JA, Marti A, Moreno-Aliaga MJ: Eicosapentaenoic acid actions on adiposity and insulin resistance in
control and high-fat-fed rats: role of apoptosis, adiponectin and tumour necrosis factor-alpha. Br J Nutr 2007, 97:389-398.
36. Mori N, Murase T, Yamada N, Arakawa N, Takaku F: Wide variations of plasma triglyceride concentrations in guinea pigs. Lipids 1984, 19:978-981. 37. Jacobson TA: Role of n-3 fatty acids in the treatment of
hypertriglyceridemia and cardiovascular disease. Am J Clin Nutr 2008, 87:1981S-1990S.
38. Wortman P, Miyazaki Y, Kalupahana NS, Kim S, Hansen-Petrik M, Saxton AM, Claycombe KJ, Voy BH, Whelan J, Moustaid-Moussa N: n3 and n6 polyunsaturated fatty acids differentially modulate prostaglandin E secretion but not markers of lipogenesis in adipocytes. Nutr Metab (Lond) 2009, 6:5.
39. Mace K, Shahkhalili Y, Aprikian O, Stan S: Dietary fat and fat types as early determinants of childhood obesity: a reappraisal. International Journal of Obesity 2006, 30:S50-S57.
40. Broad Institute: Genome of the Guinea Pig (Cavia porcellus).http://www. ensembl.org/Cavia_porcellus/Info/Index.
41. Kurvinen JP, Kuksis A, Sinclair AJ, Abedin L, Kallio H: The effect of low alpha-linolenic acid diet on glycerophospholipid molecular species in guinea pig brain. Lipids 2000, 35:1001-1009.
42. Agostoni C, Marangoni F, Grandi F, Lammardo AM, Giovannini M, Riva E, Galli C: Earlier smoking habits are associated with higher serum lipids and lower milk fat and polyunsaturated fatty acid content in the first 6 months of lactation. Eur J Clin Nutr 2003, 57:1466-1472.
43. Li C, Goran MI, Kaur H, Nollen N, Ahluwalia JS: Developmental trajectories of overweight during childhood: role of early life factors. Obesity (Silver Spring) 2007, 15:760-771.
doi:10.1186/1743-7075-7-8
Cite this article as: Pouteau et al.: A lowa-linolenic intake during early life increases adiposity in the adult guinea pig. Nutrition & Metabolism 2010 7:8.
Submit your next manuscript to BioMed Central and take full advantage of:
• Convenient online submission
• Thorough peer review
• No space constraints or color figure charges
• Immediate publication on acceptance
• Inclusion in PubMed, CAS, Scopus and Google Scholar
• Research which is freely available for redistribution
Submit your manuscript at www.biomedcentral.com/submit