Additional file 1:
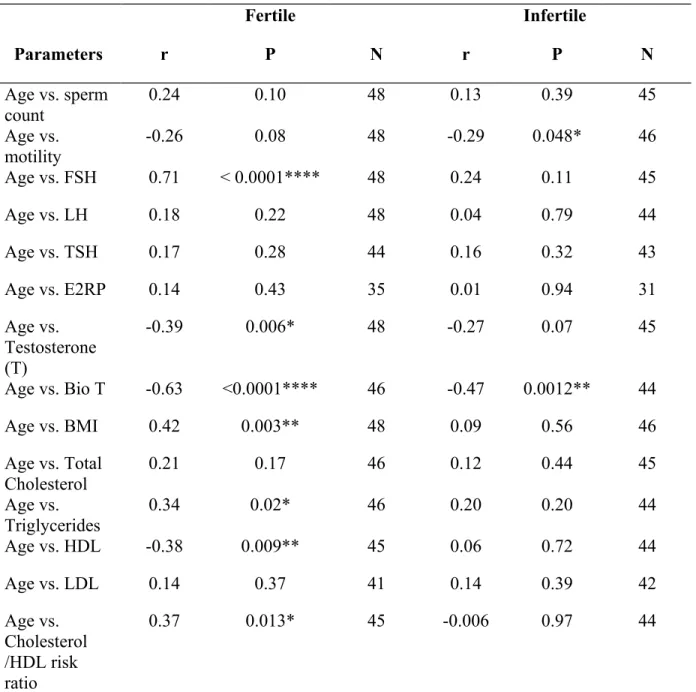
Table S1. Pearson correlation analysis of the age of subjects and clinical indices in the fertile and infertile subjects
Fertile Infertile
Parameters r P N r P N
Age vs. sperm
count 0.24 0.10 48 0.13 0.39 45
Age vs.
motility
-0.26 0.08 48 -0.29 0.048* 46
Age vs. FSH 0.71 < 0.0001**** 48 0.24 0.11 45
Age vs. LH 0.18 0.22 48 0.04 0.79 44
Age vs. TSH 0.17 0.28 44 0.16 0.32 43
Age vs. E2RP 0.14 0.43 35 0.01 0.94 31
Age vs.
Testosterone (T)
-0.39 0.006* 48 -0.27 0.07 45
Age vs. Bio T -0.63 <0.0001**** 46 -0.47 0.0012** 44
Age vs. BMI 0.42 0.003** 48 0.09 0.56 46
Age vs. Total Cholesterol
0.21 0.17 46 0.12 0.44 45
Age vs.
Triglycerides
0.34 0.02* 46 0.20 0.20 44
Age vs. HDL -0.38 0.009** 45 0.06 0.72 44
Age vs. LDL 0.14 0.37 41 0.14 0.39 42
Age vs.
Cholesterol /HDL risk ratio
0.37 0.013* 45 -0.006 0.97 44
FSH: follicle stimulating hormone; LH: luteinizing hormone; TSH: thyroid stimulating
hormone; E2RP: estradiol levels; BMI: body mass index; HDL: high density lipoprotein; LDL:
low density lipoprotein.
Table S2. Association results for age models with different corrections
#TestedCpGs #DMC_qv<0.01
LM.Age 2654805 155416
LM.Fertility 2654805 0
LM.Age+Fertility+all covariates 2599141 21971
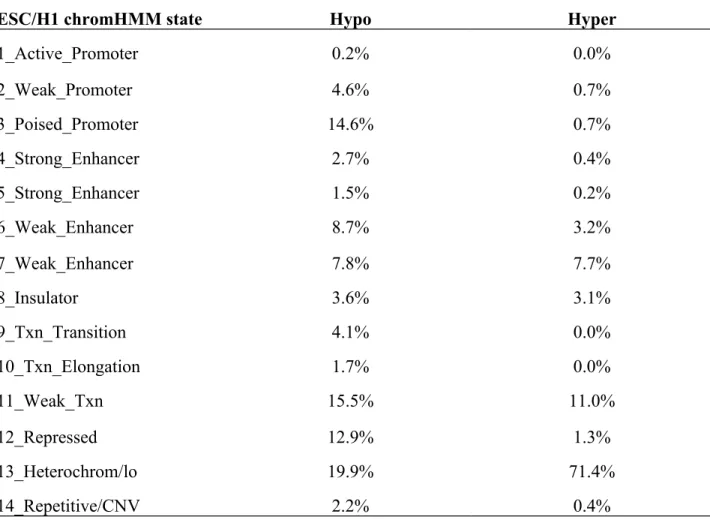
Table S3. Chromatin states distribution (ChromHMM from ENCODE data) of sperm age hypo –and hypermethylated regions in human hESC (H1)
ESC/H1 chromHMM state Hypo Hyper
1_Active_Promoter 0.2% 0.0%
2_Weak_Promoter 4.6% 0.7%
3_Poised_Promoter 14.6% 0.7%
4_Strong_Enhancer 2.7% 0.4%
5_Strong_Enhancer 1.5% 0.2%
6_Weak_Enhancer 8.7% 3.2%
7_Weak_Enhancer 7.8% 7.7%
8_Insulator 3.6% 3.1%
9_Txn_Transition 4.1% 0.0%
10_Txn_Elongation 1.7% 0.0%
11_Weak_Txn 15.5% 11.0%
12_Repressed 12.9% 1.3%
13_Heterochrom/lo 19.9% 71.4%
14_Repetitive/CNV 2.2% 0.4%
Table S7. Bisulfite pyrosequencing primers and PCR conditions for human sperm germline
differentially methylated regions (DMRs)
Germli ne DMR (No. of CpGs examin ed)
Methyla ted
Allele Bisulfite converted Sequence (5'-3')a Location
b
PCR amplico
n (bp)
PCR conditi
ons (anneal
ing temper
ature)
H19 (7)
F:GGGATGTTTTTGTAGGTAAATTATA GGTAG
chr11:2,022,3
55-2,022,636 55.6°C Paternal R*: ACTTCCAAAATAAAAAATCCCTAT
ATTCTA 282
S
1:TTGTAGGTAAATTATAGGTAGT S
2:TTGTGTTTTTATATTTTTAATTGAT DLK1/G
TL2 IG- DMR
(6)
F:AGTAGTTGGGATTATAGGTATTATG
T chr14:101,27
6,661-
101,276,851 58°C Paternal R*: ATCTTTTAAACTCTACCCTATCTTA
CTCT 217
S: GATAATTTTTTGTATTTTTAGTAGG
MEST (6)
F * :TTATTAGTTTGGTGGTGGGTTTAAT
AG chr7:130,131,
314-
130,131,616 55.6°C Maternal R: CCCTAAATACCCCAACTCTT 303
S:CTAAAAAACAACAAAACTCTAAAA T
KCNQ1 OT1 (15)
F: AGGGGAGTTTTGGTAGGATTTTGT
chr11:2,721,1
53-2,721,466 65°C Maternal
R*: CCTCACACCCAACCAATACCTCAT
A 314
S
1: GGAGTTTTTTGGAGG
S
2: GTGGAGATAGTTTTTTATTTGT
a
Primers indicated by a star are biotinylated at the 5' end. (Forward primer has no C, reverse primer has no G after bisulfite conversion.)
b