HAL Id: hal-01875621
https://hal.sorbonne-universite.fr/hal-01875621
Submitted on 17 Sep 2018
HAL is a multi-disciplinary open access archive for the deposit and dissemination of sci-entific research documents, whether they are pub-lished or not. The documents may come from teaching and research institutions in France or abroad, or from public or private research centers.
L’archive ouverte pluridisciplinaire HAL, est destinée au dépôt et à la diffusion de documents scientifiques de niveau recherche, publiés ou non, émanant des établissements d’enseignement et de recherche français ou étrangers, des laboratoires publics ou privés.
visual field loss
Nicolae Sanda, Leonardo Cerliani, Colas N. Authié, Norman Sabbah,
José-Alain Sahel, Christophe Habas, Avinoam B. Safran, Michel Thiebaut de
Schotten
To cite this version:
Nicolae Sanda, Leonardo Cerliani, Colas N. Authié, Norman Sabbah, José-Alain Sahel, et al.. Visual brain plasticity induced by central and peripheral visual field loss. Brain Structure and Function, Springer Verlag, 2018, 223 (7), pp.3473 - 3485. �10.1007/s00429-018-1700-7�. �hal-01875621�
https://doi.org/10.1007/s00429-018-1700-7 ORIGINAL ARTICLE
Visual brain plasticity induced by central and peripheral visual field
loss
Nicolae Sanda1,2,3,4,5 · Leonardo Cerliani6,7,8,9 · Colas N. Authié1,2,3,4 · Norman Sabbah1,2,3,4 ·
José‑Alain Sahel1,2,3,4,11,12,13 · Christophe Habas1,2,3,10 · Avinoam B. Safran1,2,3,4,5 · Michel Thiebaut de Schotten6,7,14
Received: 13 October 2017 / Accepted: 15 June 2018 / Published online: 23 June 2018 © The Author(s) 2018
Abstract
Disorders that specifically affect central and peripheral vision constitute invaluable models to study how the human brain adapts to visual deafferentation. We explored cortical changes after the loss of central or peripheral vision. Cortical thick-ness (CoTks) and resting-state cortical entropy (rs-CoEn), as a surrogate for neural and synaptic complexity, were extracted in 12 Stargardt macular dystrophy, 12 retinitis pigmentosa (tunnel vision stage), and 14 normally sighted subjects. When compared to controls, both groups with visual loss exhibited decreased CoTks in dorsal area V3d. Peripheral visual field loss also showed a specific CoTks decrease in early visual cortex and ventral area V4, while central visual field loss in dorsal area V3A. Only central visual field loss exhibited increased CoEn in LO-2 area and FG1. Current results revealed biomark-ers of brain plasticity within the dorsal and the ventral visual streams following central and peripheral visual field defects.
Keywords Visual plasticity · Cortical thickness · Resting-state cortical entropy · Central visual field loss · Peripheral visual field loss · Retinitis pigmentosa · Stargardt macular degeneration · Cytoarchitectonic areas
Introduction
Vision represents the most elaborated sensory input in the human brain. Central vision is captured at retinal level by the macula, which samples about 20° of the central visual field and provides a high spatial resolution. The peripheral
Electronic supplementary material The online version of this article (https ://doi.org/10.1007/s0042 9-018-1700-7) contains supplementary material, which is available to authorized users. * Nicolae Sanda
1 Sorbonne Universités, UPMC Université Paris 06, UMR
S968, Institut de la Vision, 75012 Paris, France
2 INSERM, U968, Institut de la Vision, 75012 Paris, France 3 CNRS, UMR 7210, Institut de la Vision, 75012 Paris, France 4 Centre d’investigation clinique, Centre Hospitalier National
d’Ophtalmologie des Quinze-Vingts, INSERM-DHOS CIC 1423, 75012 Paris, France
5 Department of Clinical Neurosciences, Geneva University
Hospital and Geneva University School of Medicine, Gabrielle-Perret-Gentil 4, 1205 Geneva, Switzerland
6 Frontlab, UPMC Univ Paris 06, Inserm, CNRS, Institut
du cerveau et la moelle (ICM), Hôpital Pitié-Salpêtrière, Boulevard de l’hôpital, 75013 Paris, France
7 Brain Connectivity and Behaviour Group, Sorbonne
University, Paris, France
8 Department of Psychiatry, Academic Medical Centre,
Amsterdam, The Netherlands
9 Amsterdam Brain and Cognition, University of Amsterdam,
Amsterdam, The Netherlands
10 Centre de Neuroimagerie, Centre Hospitalier National
d’Ophtalmologie des Quinze-Vingts, 75012 Paris, France
11 Institute of Ophthalmology, University College of London,
London, UK
12 Fondation Ophtalmologique Adolphe de Rothschild, Paris,
France
13 Department of Ophthalmology, School of Medicine,
University of Pittsburg, Pittsburg, USA
14 Groupe d’Imagerie Neurofonctionnelle, Institut des Maladies
Neurodégénératives, UMR 5293, CNRS, CEA University of Bordeaux, Bordeaux, France
visual field is collected by the remaining of the retina and has a low spatial resolution. The distinction between cen-tral and peripheral vision is also maintained within the brain. Particularly, dorsal visual areas receive relatively more projections from areas processing peripheral visual field representations, whereas ventral visual areas are more densely connected to those processing central representa-tions (Ungerleider and Desimone 1986; Gattass et al. 2005). Hence, the loss of central or peripheral visual field should impair in different ways the visual brain and its neuroanat-omy. Yet, little is known about the anatomical consequences and compensation mechanisms occurring after central or peripheral visual deprivation.
Central visual field loss prevents the central fixation, compelling patients to employ strategies of fixation in the peripheral retina, near the limit of the field defect (Duret et al. 1999). While the rest of visual field allows for an appropriate spatial orientation and navigation, its low spatial resolution impairs drastically object, face recognition and reading (Safran et al. 1999; Boucart et al. 2010). Reversely, peripheral visual field loss excludes the use of covert visual attention, constraining the affected individuals to increase their saccade rate to laboriously explore their environment (Authié et al. 2017). Affected individuals preserve functions related to the high spatial resolution of the residual central vision such as face and small objects recognition but exhibit impaired spatial orientation (Wittich et al. 2011) and scene perception (Fortenbaugh et al. 2007), altered postural control (Berencsi et al. 2005) and increased risk of object collision during locomotion (Turano et al. 1999, 2002) due to the lim-ited coverage of the residual visual field. However, shreds of evidences support a brain reorganisation consequent to the adjustment of these behaviours.
Preliminary findings suggest that following a visual defect, the deafferented primary visual cortex alters its con-nections and the residual afferented primary visual cortex reinforces preexistent functional connections (Sabbah et al.
2017). The latter is presumably an attempt to compensate for the loss of the former to sustain higher order visual mechanisms. As central or peripheral visual loss generates sensory deprivation in a part of the visual cortex, structural alterations are also expected. Indeed, previous reports noted grey matter thinning in the posterior part of the primary visual cortex induced by central visual field loss (Boucard et al. 2009; Plank et al. 2011; Hernowo et al. 2014; Prins et al. 2016), whereas peripheral visual field loss induced thinning of the anterior part of the primary visual cortex (Boucard et al. 2009; Yu et al. 2013). However, above-men-tioned studies evaluated disorders such as glaucoma and age-related macular degeneration that are not limited to the eye but imply widespread neurodegenerative cerebral altera-tions (McKinnon 2003; Pham et al. 2006; Woo et al. 2012; Chen et al. 2013; Cheung and Wong 2014). Such approaches
may have hampered the identification of differences strictly related to early visual deafferentation and further research on disorders restricted to the retina may clarify the brain modification occurring after a pure early visual deprivation.
In the current study, we investigated long-term brain changes associated with two well-described pure and pro-gressive retinal disorders that induce bilateral, converse visual field defects—Stargardt macular degeneration for central visual loss and non-syndromic retinitis pigmentosa for peripheral visual field loss. Stargardt macular degenera-tion is a hereditary cone-rod dystrophy that, in advanced stages, destroys the macular region, constraining affected individuals to rely only on the peripheral vision (Stargardt
1909). Reversely, retinitis pigmentosa—a rod-cone dystro-phy—primarily affects peripheral retina and results in a pro-gressive constriction of the visual field. It leads to a “tunnel vision” stage, with retained central vision, and later, in the most advanced stage, to blindness (Donders 1857; Sahel et al. 2015).
To evaluate the effects of the remote loss of central or peripheral vision, we estimated the cortical morphology derived from measures of cortical thickness (Das et al.
2009). However, the specific cellular mechanisms under-lying the variations in cortical thickness remain obscure. They may be related to neuronal apoptosis, variations in cortical myelination, alterations of the synaptic complex-ity or a summation of these events (Wagstyl et al. 2015; Zilles and Amunts 2015; Burge et al. 2016). To explain the eventual differences in cortical thickness, we measured the functional MRI entropy during resting state session (rs-CoEn). rs-CoEn is a method derived from informa-tion theory and linked to neural and synaptic complex-ity (Tononi 1998). According to this approach, increased entropy corresponds to higher connective properties (Sokunbi et al. 2011; Yao et al. 2013; Thiebaut de Schot-ten et al. 2016), while the reduction in entropy may imply synaptic and dendritic degeneration (Sokunbi et al. 2013). To intimately respect its anatomy, the occipital lobe was partitioned in its corresponding cytoarchitectonic regions using cytoarchitectonic probability maps (Amunts et al.
2000; Malikovic et al. 2007; Rottschy et al. 2007; Mohlberg et al. 2012; Caspers et al. 2013; Kujovic et al. 2013; Lor-enz et al. 2015; Rosenke et al. 2017). CoTks and rs-CoEn extracted from each of these regions were used to perform group comparisons.
Methods and materials
Participants
The Ethics Committee (Comité de protection des person-nes, Ile de France V, and Agence Nationale de Sécurité du
Médicament et des Produits de Santé) approved the study protocol (number 12,873). Thirty-eight subjects gave their written informed consent prior to inclusion. Twelve sub-jects suffered from Stargardt macular dystrophy (SMD) (six women, six men; all right-handed, age range from 18 to 58 year-old, mean 38.4 ± 12, median 39). This group pre-sented a central scotoma, 10°–20° in diameter (as evaluated by Goldmann III/4 kinetic perimetry), without foveal spar-ing, with a best-corrected visual acuity equal or superior to 20/400 (measured by EDTRS charts). Twelve subjects suf-fered from retinitis pigmentosa, tunnel vision stage (RPTV) (six women, six men; nine right-handed, age range from 18 to 62 year-old, mean 41.7 ± 16.7, median 40), and pre-sented a central residual visual field limited to a 10°–20° diameter (as evaluated by Goldmann III/4 kinetic perim-etry) with a best-corrected visual acuity equal or superior to 20/40 (measured by EDTRS charts). Additionally, fourteen normally sighted controls (seven women, seven men; all right-handed, age range from 18 to 59 year-old, 41.6 ± 14.6, median 41), with normal routine ophthalmological examina-tions were also recruited for this study. Groups were matched for age and no significant difference between groups was observed (Kruskal–Wallis, c2(2) = 0.445, p = 0.801, mean rank age 19.83 in SMD group, 20.79 in RPTV group and 19.82 in normally sighted group) (see for details Supple-mentary Table 1).
Neuroimaging
MRI was performed with a whole-body 3T clinical imager (Sigma Horizon) using an 8-channel head coil.
T1-weighted gradient-echo images were acquired with the following parameters TE/TR/flip angle, 3.9/9.5 ms/20°; FOV, 25.6 × 25.6 mm; matrix, 512 × 512; source voxel size, 1.2 × 0.5 × 0.5 mm; thickness, 1.2 mm, no gap.
Additionally, 32 contiguous axial T2*-weighted gra-dient-echo echo-planar images (TE/TR, 93/3000 ms; FOV, 240 × 240 mm; matrix, 64 × 64; voxel size, 4 × 3.75 × 3.75 mm converted to 3 × 3 × 3 mm; thickness, 4 mm; no gap; NEX, 1) were recorded to encompass the entire brain. 184 volumes were acquired including 4 “dummy” volumes obtained at the start of the session. Scan duration was 9.25 min for the whole sequence. No explicit task was required, and subjects were instructed to keep their eyes closed.
Cortical thickness analysis (CoTks)
A registration-based method (Diffeomorphic Registra-tion based Cortical Thickness, DiReCT) was employed to estimate the cortical thickness (Das et al. 2009) from the T1-weighted imaging dataset. The first step of this method consists in creating two-voxel thick sheets, one that lies just
between the grey matter and the subcortical white matter and a second lying between the grey matter and the pia matter. Then, the former is expanded to the latter using diffeomor-phic deformation estimated with ANTs (Avants et al. 2007; Klein et al. 2009; Tustison and Avants 2013). The registra-tion produces a correspondence field that allows an estimate of the distance between the outer and inner boundaries of the grey matter ribbon, and thus cortical thickness. This approach has good scan-rescan repeatability and good neu-robiological validity as it can predict, with high statistical power the age and gender of the participants (Tustison et al.
2014). All these steps were carried on automatically using BCBtoolkit (http://toolk it.bcbla b.com) (Foulon et al. 2018). Average cortical thickness of the occipital lobes of each sub-ject was also measured to account for the inter-individual variability (Ferreira et al. 2017).
Entropy analysis (rs‑CoEn)
First, T1-weighted gradient-echo images were skull stripped using Brain Extraction Tool (BET) as part of the FMRIB software package (FSL, http://fsl.fmrib .ox.ac.uk). T2*-weighted images were subsequently registered to the ana-tomical (T1-weighted) image using affine deformations. Skull-stripped T1-weighted gradient-echo images were registered to the MNI152 template (http://nist.mni.mcgil
l.ca/?p=904) using affine and diffeomorphic deformations
(http://stnav a.githu b.io/ANTs) (Klein et al. 2009; Avants
et al. 2011). The latter deformations were applied to the T1 registered T2*-weighted images. Since the resting-state
fMRI signal can be heavily affected by motion, even
fol-lowing motion correction between temporally adjacent vol-umes (Van Dijk et al. 2012), we estimated the signal fluctua-tion associated with mofluctua-tion and regressed it out from the
fMRI data prior to the calculation of entropy. To this aim,
we employed a recently developed and validated procedure based on data-driven Independent Component Analysis (ICA), termed ICA-Aroma (Pruim et al. 2015). This method performs an ICA decomposition of the data and estimates which components reflect motion-related noise in the fMRI signal on the basis of a robust set of spatial and temporal features. This is made possible due the distinctiveness of the motion-related components isolated by ICA on the fMRI signal (Salimi-Khorshidi et al. 2014). This approach outper-forms other methods such as the regression of the motion parameter estimates, while limiting in the same time the loss in degrees of freedom (Pruim et al. 2015). Compared to spike removal methods such as scrubbing (Power et al.
2012), ICA-Aroma has the advantage of preserving the temporal structure of the fMRI signal. Finally, the resting-state cortical entropy (rs-CoEn) was estimated using FSL fslstats by first binning—using a fixed amount of 1000 bins—the pre-processed fMRI signal within each region of
interest (ROI), and subsequently estimating the mean Shan-non entropy over the entire ROI. Like in the case of CoTks, to account for inter-individual variability, we extracted the average cortical entropy for each subject. These values were estimated on a grey matter mask from the MNI single sub-ject template, in turn obtained from FAST segmentation, and subsequent thresholding at 0.4 the partial volume estimate map of the grey matter.
Regions of interest
To intimately respect the anatomy and cytoarchitecture of the cerebral cortex, we used probabilistic cytoarchitectonic maps of the occipital lobe (Amunts et al. 2007; Zilles and Amunts 2010; Mohlberg et al. 2012) to extract region-specific measures of cortical thickness and entropy. These regions included hOc1 (V1), hOc2 (V2), hOc3d (V3d), hOc4d (V3A), hOc3v (VP/V3v), hOc4v (V4/V4v), hOc5 (V5/ hMT+), hOc4la (LO-2), hOc4lp (LO-1), FG1, FG2 and FG4 (http://www.fz-jueli ch.de/inm/inm- 1/EN/Forsc hung/_docs/SPMAn atomy Toolb ox/SPMAn atomy Toolb
ox_node.html).
Statistical analysis
We confirmed the Gaussian distribution of the data for the three groups using the Shapiro–Wilk test (Shapiro and Wilk
1965), as well as the homogeneity of variance with the Lev-ene test (LevLev-ene 1960).
Statistical analysis was performed with SPSS 20 (SPSS, Chicago, IL, USA). Two consecutive repeated measures ANOVAs were employed to assess differences in CoTks and
rs-CoEn between the three groups. Cytoarchitectonic areas
were considered as between subject factors and hemisphere as within subject factor. Post-hoc independent-sample t tests (Bonferroni corrected for multiple comparisons) were per-formed when statistically appropriate.
The relation between age, visual deficit duration and the cortical thickness and cortical entropy for the entire brain and for each cytoarchitectonic ROI was analysed through linear regression in SPSS 20 (SPSS, Chicago, IL, USA).
Results
Cortical thickness analysis
Whole brain average CoTks was measured for each patient and employed in group analysis, ANOVA showing no sig-nificant group effect [F(2, 35) = 0.557, p = 0.578]. Further, the measured CoTks of occipital lobe cytoarchitectonic areas were normalized with the average CoTks of the entire brain.
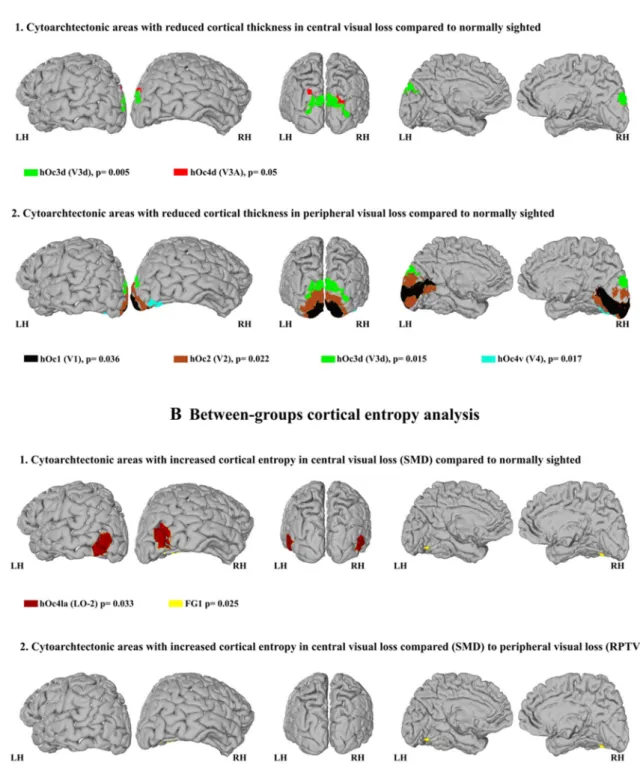
The ratio between each cytoarchitectonic area CoTks and brain’s average CoTks was further employed in the sub-sequent analysis (Ferreira et al. 2017). ANOVA revealed a significant group effect for the cytoarchitectonic areas hOc1 [F(2, 35) = 3.882, p = 0.03], hOc2 [F(2, 35) = 4.05,
p = 0.026], hOc3d [F(2, 35) = 7.09; p = 0.003], hOc4d [F(2,
35) = 3.633; p = 0.037], hOc4v [F(2, 35) = 5.013; p = 0.012]. Left hemispheric regions did not differ significantly from right hemisphere regions [occipital LH, F(2, 35) = 2.873,
p = 0.07; occipital RH, F(2, 35) = 2.716; p = 0.08]. Post-hoc
independent-sample t tests (Bonferroni corrected for mul-tiple comparisons) are summarized in Table 1 and in the following paragraphs.
Visual brain CoTks in visual field loss compared to normally sighted
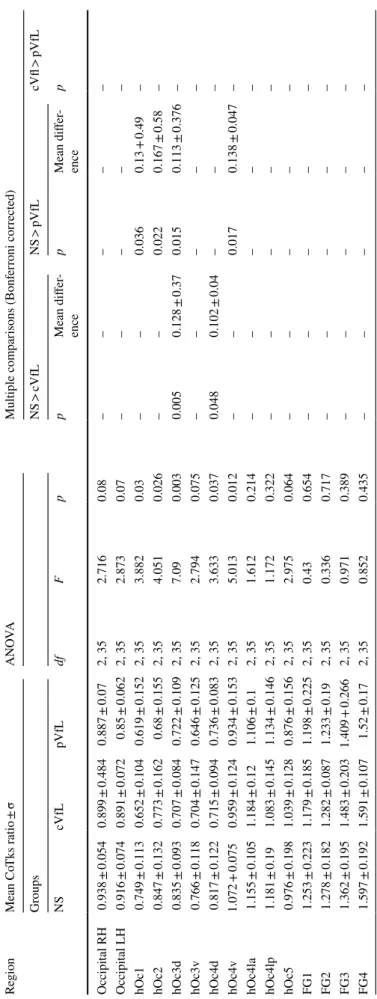
All the following post-hoc comparisons were Bonferroni corrected for multiple comparisons. Compared to normally sighted we found a significant reduction of CoTks in the dorsal region hOc3d for both central (p = 0.005) and periph-eral (p = 0.015) visual field defects (see Table 1). In central visual field loss/ SMD, we also noted significant reduction in dorsal area hOc4d (p = 0.048) (see Fig. 1a1, and Table 1) and in peripheral visual field loss/ RPTV in early visual cortex [hOc1 (p = 0.036), hOc2 (p = 0.022)] and the ventral region hOc4v (p = 0.017) (see Fig. 1a2, Table 1 and also Supple-mentary Fig. 1).
Visual brain CoTks differences in central and peripheral visual field loss
There was no CoTks difference between central and periph-eral visual loss (see Table 1).
Resting‑state cortical entropy analysis
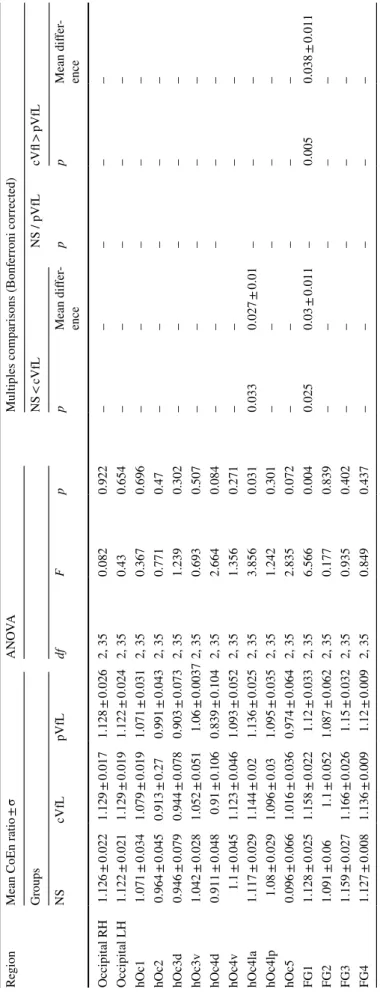
Whole brain average CoEn was measured for each patient and employed in group analysis, ANOVA showing no sig-nificant group effect [F(2, 35) = 1.378, p = 0.273]. Further, the measured rs-CoEn of occipital lobe cytoarchitectonic areas was normalized with the average rs-CoEn of the entire brain. The ratio between each cytoarchitectonic area
rs-CoEn and brain’s average rs-CoEn was further employed
in the subsequent analysis. ANOVA revealed a signifi-cant group effect for the cytoarchitectonic areas hOc4la (F(2, 35) = 3.856 ; p = 0.031) and FG1 (F(2, 35) = 6.566;
p = 0.004). There was no significant effect for the
fac-tor hemisphere [occipital LH, F(2, 35) = 0.43, p = 0.654; occipital RH, F(2, 35) = 0.082; p = 0.922]. Note that none of the areas with altered CoTks compared to normally sighted exhibited significant rs-CoEn alterations. Post-hoc
Table 1 Cyt oar chitect onic ar eas sho
wing significant differ
ences in cor tical t hic kness NS nor mall y sighted, cVfL centr
al visual field loss (SMD),
pVfL
per
ipher
al visual field loss (RPT
V) Region Mean Co Tk s r atio ± σ A N OVA Multiple com par isons (Bonf er roni cor rected) Gr oups NS > cVfL NS > pVfL cVfl > pVfL NS cVfL pVfL df F p p Mean differ -ence p Mean differ -ence p Occipit al RH 0.938 ± 0.054 0.899 ± 0.484 0.887 ± 0.07 2, 35 2.716 0.08 – – – – – Occipit al LH 0.916 ± 0.074 0.891 ± 0.072 0.85 ± 0.062 2, 35 2.873 0.07 – – – – – hOc1 0.749 ± 0.113 0.652 ± 0.104 0.619 ± 0.152 2, 35 3.882 0.03 – – 0.036 0.13 + 0.49 – hOc2 0.847 ± 0.132 0.773 ± 0.162 0.68 ± 0.155 2, 35 4.051 0.026 – – 0.022 0.167 ± 0.58 – hOc3d 0.835 ± 0.093 0.707 ± 0.084 0.722 ± 0.109 2, 35 7.09 0.003 0.005 0.128 ± 0.37 0.015 0.113 ± 0.376 – hOc3v 0.766 ± 0.118 0.704 ± 0.147 0.646 ± 0.125 2, 35 2.794 0.075 – – – – – hOc4d 0.817 ± 0.122 0.715 ± 0.094 0.736 ± 0.083 2, 35 3.633 0.037 0.048 0.102 ± 0.04 – – – hOc4v 1.072 + 0.075 0.959 ± 0.124 0.934 ± 0.153 2, 35 5.013 0.012 – – 0.017 0.138 ± 0.047 – hOc4la 1.155 ± 0.105 1.184 ± 0.12 1.106 ± 0.1 2, 35 1.612 0.214 – – – – – hOc4lp 1.181 ± 0.19 1.083 ± 0.145 1.134 ± 0.146 2, 35 1.172 0.322 – – – – – hOc5 0.976 ± 0.198 1.039 ± 0.128 0.876 ± 0.156 2, 35 2.975 0.064 – – – – – FG1 1.253 ± 0.223 1.179 ± 0.185 1.198 ± 0.225 2, 35 0.43 0.654 – – – – – FG2 1.278 ± 0.182 1.282 ± 0.087 1.233 ± 0.19 2, 35 0.336 0.717 – – – – – FG3 1.362 ± 0.195 1.483 ± 0.203 1.409 + 0.266 2, 35 0.971 0.389 – – – – – FG4 1.597 ± 0.192 1.591 ± 0.107 1.52 ± 0.17 2, 35 0.852 0.435 – – – – –
Fig. 1 a group analysis of cortical thickness. b
Between-group analysis of cortical entropy. The cytoarchitectonic areas are shown on neutral brains (left hemisphere) extracted from JuBrain
CytoViewer Atlas (https ://www.jubra in.fz-jueli ch.de); each cytoarchi-tectonic group is depicted in a different colour
Table 2 Cyt oar chitect onic ar eas sho
wing significant differ
ences in r es ting-s tate cor tical entr op y NS nor mall y sighted, cVfL centr
al visual field loss (SMD),
pVfL
per
ipher
al visual field loss (RPT
V) Region Mean CoEn ratio ± σ A N OVA Multiples com par isons (Bonf er roni cor rected) Gr oups NS < cVfL NS / pVfL cVfl > pVfL NS cVfL pVfL df F p p Mean differ -ence p p Mean differ -ence Occipit al RH 1.126 ± 0.022 1.129 ± 0.017 1.128 ± 0.026 2, 35 0.082 0.922 – – – – – Occipit al LH 1.122 ± 0.021 1.129 ± 0.019 1.122 ± 0.024 2, 35 0.43 0.654 – – – – – hOc1 1.071 ± 0.034 1.079 ± 0.019 1.071 ± 0.031 2, 35 0.367 0.696 – – – – – hOc2 0.964 ± 0.045 0.913 ± 0.27 0.991 ± 0.043 2, 35 0.771 0.47 – – – – – hOc3d 0.946 ± 0.079 0.944 ± 0.078 0.903 ± 0.073 2, 35 1.239 0.302 – – – – – hOc3v 1.042 ± 0.028 1.052 ± 0.051 1.06 ± 0.0037 2, 35 0.693 0.507 – – – – – hOc4d 0.911 ± 0.048 0.91 ± 0.106 0.839 ± 0.104 2, 35 2.664 0.084 – – – – – hOc4v 1.1 ± 0.045 1.123 ± 0.046 1.093 ± 0.052 2, 35 1.356 0.271 – – – – hOc4la 1.117 ± 0.029 1.144 ± 0.02 1.136 ± 0.025 2, 35 3.856 0.031 0.033 0.027 ± 0.01 – – – hOc4lp 1.08 ± 0.029 1.096 ± 0.03 1.095 ± 0.035 2, 35 1.242 0.301 – – – – – hOc5 0.096 ± 0.066 1.016 ± 0.036 0.974 ± 0.064 2, 35 2.835 0.072 – – – – – FG1 1.128 ± 0.025 1.158 ± 0.022 1.12 ± 0.033 2, 35 6.566 0.004 0.025 0.03 ± 0.011 – 0.005 0.038 ± 0.011 FG2 1.091 ± 0.06 1.1 ± 0.052 1.087 ± 0.062 2, 35 0.177 0.839 – – – – – FG3 1.159 ± 0.027 1.166 ± 0.026 1.15 ± 0.032 2, 35 0.935 0.402 – – – – – FG4 1.127 ± 0.008 1.136 ± 0.009 1.12 ± 0.009 2, 35 0.849 0.437 – – – – –
independent-sample t tests (Bonferroni corrected for mul-tiple comparisons) are summarized in Table 2 and in the following paragraphs.
Visual brain rs‑CoEn in visual field loss compared to normally sighted
Compared to normally sighted we found in central visual field defect/ SMD group a significant increase of rs-CoEn in areas hOc4la (p = 0.031) and FG1 (p = 0.025) (see Fig. 1b.1, Table 2 and also Supplementary Fig. 2). There was no rs-CoEn difference between peripheral visual loss/RPTV and the normally sighted.
Visual brain rs‑CoEn differences in central and peripheral visual field loss
Compared to the peripheral visual field loss/RPTV group, central visual field loss/SMD exhibited significantly higher
rs-CoEn in the area FG1 (p = 0.005) (see Fig. 1b.2, Table 2
and also Supplementary Fig. 2).
Impact of age and duration deficit on CoTks and rs‑CoEn
There was no impact of age and deficit duration on the CoTks and rs-CoEn in areas exhibiting differences between groups (for regression differences in other areas see Supple-mentary Tables 1 and 2). Nevertheless, we found an impact of age (p < 0.0001) and disease duration (p < 0.0001) on global CoTks, but no impact on the rs-CoEn.
Discussion
We assessed the impact of central and peripheral vision loss on the cortical morphology (i.e. cortical thickness, CoTks) and neural and synaptic complexity (i.e. rs-fMRI entropy, rs-CoEn). Three findings emerge from our work. First, compared to normally sighted both groups with visual field defects exhibited reduced CoTks in the dorsal region hOc3d; peripheral visual field defect group also presented reduced CoTks in early visual cortex (hOc1 and hOc2) and the ventral region hOc4V, while central visual field defect group in the dorsal region hO4d. Second, compared both to normally sighted and peripheral visual field defect groups, central visual field defect group showed increased rs-CoEn in FG1 area; also, compared with normally sighted, cen-tral visual field defect group exhibited increased rs-CoEn in hOc4la area. Finally, areas with altered CoTks had normal
rs-CoEn and conversely.
Differences in cortical thickness
Compared to normally sighted only the subjects with periph-eral visual loss showed decreased CoTks in hOc1 and hOc2, which correspond to the functional regions V1 and V2 of the early visual cortex (Amunts et al. 2000). Previous stud-ies reported a decreased CoTks in the early visual cortex for both central and peripheral visual loss (Boucard et al.
2009; Plank et al. 2011; Yu et al. 2013; Hernowo et al. 2014; Prins et al. 2016). In our study, only peripheral visual loss was associated with a thinning of the early visual cortex. This difference might be explained by the peculiarities of the retinal degeneration in retinitis pigmentosa. Retinitis pigmentosa is a pan-retinal, rod-cone degeneration and in the tunnel stage, patients exhibit not only the loss of all receptors in the peripheral retina, but also the loss of rods in central retina coupled to a more limited degeneration of cen-tral cones (translated by a reduced visual acuity, Sahel et al.
2015). Moreover, rod loss might directly impact certain pho-topic vision processes such as cone-driven, horizontal cell mediated surround inhibition (Szikra et al. 2014) or mesopic (dim-light) vision processes such as rod-cone or rod–rod gap-junction coupling presumed to help identifying dark objects moving through the visual field (Tsukamoto et al.
2001; Volgyi 2004; Ribelayga et al. 2008; Bloomfield and Völgyi 2009). SMD, on the other hand, associates a photore-ceptor loss that is solely localized to central retina (Meunier and Puech 2012). Hence, the loss of cortical thickness in V1 and V2 we report herein, suggests that retinal degeneration in retinitis pigmentosa has a greater trophic impact on early visual areas. The loss of the peripheral vision represents the loss of an extensive visual field area and affects the out-put of numerous wide-field retinal informational channels (Ölveczky et al. 2003; Roska and Werblin 2003; Hosoya et al. 2005; Münch et al. 2009; Masland 2012). Yet poorly understood these channels might play an important role in the functioning of the early visual cortex.
The reduced hOc3d CoTks in both visual field defects when compared to normally sighted, suggest a comparable contribution of central and peripheral visual field to the dorsal portion of V3 (V3d), which is canonically included in the dorsal stream (Kujovic et al. 2013). Anatomical and functional data indicate that the primarily role of V3d area is the processing kinetic information (Felleman et al. 1997; Gegenfurtner et al. 1997; Rosa and Manger 2005), the extraction of kinetic contours (Zeki 2003), and 3D form (Vanduffel 2002). Moreover, V3d has the particularity that its retinotopical map represents only the lower quad-rant of the visual field, while the upper quadquad-rant is being represented in the ventral part of V3, area V3v (hOc3v, Rottschy et al. 2007; Kujovic et al. 2013). It is possible that the spatial nature of information processing in hOc3d/ V3d is responsible for the decreased CoTks observed with
both central and peripheral visual field loss. Indeed, the build-up of an accurate referential system, essential for functions such as stereopsis (i.e. 3D perception), requires both central vision, which provides high spatial resolution and fixation, and peripheral vision, which provides wide-field sampling (Goldstein and Clahane 1966; Luria 1971; Dessing et al. 2012). In central visual loss, the physiologi-cal foveal fixation lacks and compels to fixation in the vicinity of the visual field defect, in the residual functional periphery. These eccentric fixation loci (usually multiple) are used both for detection (Duret et al. 1999) and visuo-motor coordination (Timberlake et al. 2012) and occur in different retinal positions for each eye. These peculiari-ties lead to an inadequate extraction of fixation disparipeculiari-ties (Wheatstone 1962) impairing the very mechanism of ste-reopsis. In peripheral visual field loss, foveal vision, physi-ologic fixation and visual acuity are preserved, but stere-opsis is nevertheless impaired through mechanisms such as a non-uniform drifting of the two eyes in the absence of the peripheral visual field superposition, the loss of fusion due to brief occlusions (i.e. eye-blinks, Fender and Julesz 1967) or “empty-field myopia” (i.e. accommoda-tion impairment due to increased amplitude oscillaaccommoda-tion of accommodation in the absence of peripheral clues result-ing in increased difficulty for detection, Whiteside 1957; Campbell et al. 1959). Hence, cortical thickness reduction of hOc3d CoTks in both visual field defects may account for the important contribution of central and peripheral visual fields to the functioning of this brain area.
Interestingly, compared to normally sighted, central vis-ual field loss also exhibited decreased CoTks in the dorsal area hOc4d, corresponding to the functional region V3A. This area seems to be involved in the processing of kinetic and static 3D shapes (Georgieva et al. 2009), especially contour curvature (Caplovitz and Tse 2006), stereoscopic and chromatic motion (McKeefry et al. 2010; Anzai et al.
2011), perceptual stability during eye movements (Brad-dick et al. 2001; Fischer et al. 2012), the prediction of the visual motion (Maus et al. 2010), its structural dam-age commonly resulting in simultanagnosia, namely the inability to interpret complex visual displays despite the preserved capacity to recognize single objects (Coslett and Saffran 1991). Impaired fixation and stereoscopic vision in patients with central visual loss may account for the CoTks loss in this area.
Another intriguing result was the decreased CoTks in area hOc4v in peripheral field loss, when compared to nor-mally sighted. Area hOc4, to the best of our knowledge, probably corresponds to human V4 (hV4) or at least to its ventral subdivision V4v (hV4v). The role of hV4 in colour perception is still debated (Bartolomeo et al. 2014), but its central participation in the figure-ground segmenta-tion through the integrasegmenta-tion of multiple stimulus properties
(i.e. contour, shape, texture, motion, colour, disparity) by bottom-up salience driven attentional mechanism or top-down proactive spatial or feature selection makes consen-sus (Reynolds and Desimone 2003; Qiu et al. 2007; Poort et al. 2012; Roe et al. 2012). The severely constricted vis-ual field, resulting from the loss of the peripheral visvis-ual field, may limit covert visual attention and the sensory input in area hOc4 and consequently impact its CoTks.
Differences in cortical entropy
Compared to normally sighted, central visual field loss group exhibited increased rs-CoEn in area hOc4la that likely corresponds to functionally defined LO-2 region (Larsson and Heeger 2006) involved in shape process-ing, object and face recognition, visual attention, action observation, visual tracking, spatial location discrimina-tion, mental imagery and subjective emotional picture discrimination (Malikovic et al. 2016). The increased rs-CoEn in area hOc4la/ LO-2 suggests an adaptive increase in synaptic complexity points in this area, which is crucial for shape perception, figure-ground segregation and visuo-motor coordination (Malikovic et al. 2016). Moreover, in a previous study exploring the resting state functional con-nectivity of central and peripheral V1 in the exact popula-tions explored here, we found that in central visual field loss, afferented peripheral early visual cortex exhibited increased functional connectivity with LOC compared to the corresponding region in normally sighted (Sabbah et al. 2017). Therefore, in central visual loss, the increased
rs-CoEn in LO-2 might be linked to the increased
func-tional connectivity of this area with the residually affer-ented peripheral early visual cortex.
Subjects with central visual field loss presented increased
rs-CoEn in area FG1 when compared to normally sighted
and peripheral visual field loss participants. This area, located in the posterior part of the fusiform gyrus, medial to the middle fusiform sulcus (Caspers et al. 2013; Lorenz et al. 2015) exhibits a bias for the peripheral visual field representations. More precisely, FG1 and the anteriorly situ-ated FG3 overlap with places, inanimate large objects and peripheral biased representations (Lorenz et al. 2015). This line of evidences suggests that the observed difference in
rs-CoEn may relate to an enhanced peripheral visual field
treatment in FG1 area to compensate for the central visual field loss. In accordance with this compensation hypothe-sis, peripheral early visual cortex in central visual field loss showed increased resting-state functional connectivity with fusiform gyrus compared to peripheral early visual cortex in normally sighted.
Combined cortical thickness and cortical entropy data
Interestingly, the regions with altered CoTks had normal
rs-CoEn and conversely. Limitations aside, reduced CoTks
with normal rs-CoEn may indicate a possible mixture of cell shrinkage with preserved synaptic complexity of the remaining networks. On the other hand, increased rs-CoEn might correspond to a brain plasticity effect induced by an increased visual afference of the spared visual field.
Limitations
Cytoarchitectonic areas are highly variable across sub-jects (Amunts et al. 1999). Herein, we extracted occipital cytoarchitectonic areas from an atlas based on observer-independent probabilistic mapping of ten post-mortem brains (Mohlberg et al. 2012; Zilles and Amunts 2015). To reduce the effect of inter-individual variability, CoTks and rs-CoEn were sampled only in voxels where the same cytoarchitectonic area overlaps in more than five out of ten of the post-mortem brains investigated.
Myelin density in the cortex and various technical parameters (field strength, tissue segmentation methods, smoothing, etc.) may influence the MRI measure of cortical thickness and lead to incorrect estimations (Glasser et al.
2014). These effects can be particularly deceptive in disor-ders that impact myelination (i.e. multiple sclerosis) or in physiological states exhibiting different degrees of corti-cal myelination (i.e. development or ageing, Westlye et al.
2010; Zilles and Amunts 2015). Unfortunately, we could not assess cortical myelination with T1-weighted images. Future research investigating T1 intensity may shed light on that matter (Turner et al. 2008; Stüber et al. 2014).
Resting-state fMRI signal is notoriously affected by motion (Van Dijk et al. 2012). Increased movements would virtually increase measures of entropy. To reduce this effect, we regressed out the motion-related signal from the fMRI data before the calculation of entropy. In this way, we maxim-ised the likelihood that the entropy measures reflect the spon-taneous hemodynamic fluctuations related to brain activity.
We noted an overall effect of age and in patient groups also of disease duration on brain CoTks, but not on the CoEn. However, we found no effect of age and disease duration on CoTks in areas exhibiting differences between groups. The lack of effect of age and disease duration on the CoTks of the studied cytoarcitectonic areas might be due to limited size of our studied groups. In addition, the absent impact of age and disease duration on CoEn might reflect the plastic changes resulting in a preserved synaptic complexity.
Conclusion
Overall, central and peripheral visual loss induced com-plex structural changes unpredicted by the canonical seg-regation central vision—ventral visual field, peripheral vision—dorsal visual field. We found that central visual field loss induces a thinning in dorsal stream areas hOc3d (V3d) and hOc4d (V3A) and peripheral visual field loss in early visual cortex (hOc1/V1 and hOc2/V2), dorsal stream area hOc3d (V3d) and ventral stream area hOc4v (V4). Central visual field loss also induces an increase in entropy in areas hOc4la (LO-2) and FG-1 reflecting pos-sible alternative, compensatory processing. These results offer a new and interesting insight on the effect of central and peripheral visual field deafferentation and also invite to revisit the canonical concepts of “ventral” and “dorsal” stream. Moreover, these data suggest complex adaptive changes that should be considered in the development of new visually rehabilitation strategies, sensory substitution devices or visual restitution attempts.
Acknowledgements We would like to thank the team of the
“Cen-tre d’investigation clinique” of the “Cen“Cen-tre Hospitalier National d’Ophtalmologie des Quinze-Vingts”, particularly Saddek Mohand-Saïd MD and Céline Devisme PhD for their invaluable help in patients’ recruitment and the members of “Forschungszentrum Jülich GmbH” for providing us with the cytoarchitectonic maps of the occipital lobe.
Funding The research leading to these results received funding from the programs: “Jeune Chercheuses et Jeunes Chercheurs” ANR-13-JSV4-0001-01, “Investissements d’avenir” ANR-10-IAIHU-06, “LABEX” and “Humanis”.
Compliance with ethical standards
Conflict of interest There is no conflict of interest to declare for any
author excepting José-Alain Sahel, consultant for Pixium Vision, Gen-Sight Biologics, Sanofi-Fovea, and Genesignal. However, this had no influence on the results or discussion reported in this paper.
Open Access This article is distributed under the terms of the Crea-tive Commons Attribution 4.0 International License (http://creat iveco mmons .org/licen ses/by/4.0/), which permits unrestricted use, distribu-tion, and reproduction in any medium, provided you give appropriate credit to the original author(s) and the source, provide a link to the Creative Commons license, and indicate if changes were made.
References
Amunts K, Schleicher A, Bürgel U et al (1999) Broca’s region revisited: cytoarchitecture and intersubject vari-ability. J Comp Neurol 412:319–341. 10.1002/(SICI)1096-9861(19990920)412:2<319::AID-CNE10>3.0.CO;2-7 Amunts K, Malikovic A, Mohlberg H et al (2000) Brodmann’s areas 17
and 18 brought into stereotaxic space—where and how variable? Neuroimage 11:66–84. https ://doi.org/10.1006/nimg.1999.0516
Amunts K, Schleicher A, Zilles K (2007) Cytoarchitecture of the cere-bral cortex—more than localization. Neuroimage 37:1061–1065.
https ://doi.org/10.1016/j.neuro image .2007.02.037
Anzai A, Chowdhury SA, DeAngelis GC (2011) Coding of ste-reoscopic depth information in visual areas V3 and V3A. J Neurosci 31:10270–10282. https ://doi.org/10.1523/JNEUR OSCI.5956-10.2011
Authié CN, Berthoz A, Sahel J-A, Safran AB (2017) Adaptive gaze strategies for locomotion with constricted visual field. Front Hum Neurosci 11:387. https ://doi.org/10.3389/fnhum .2017.00387
Avants B, Duda JT, Zhang H, Gee JC (2007) Multivariate normaliza-tion with symmetric diffeomorphisms for multivariate studies. In: Medical image computing and computer-assisted interven-tion—MICCAI 2007. Springer, Berlin Heidelberg, pp 359–366 Avants BB, Tustison NJ, Song G et al (2011) A reproducible
evalua-tion of ANTs similarity metric performance in brain image reg-istration. Neuroimage 54:2033–2044. https ://doi.org/10.1016/j. neuro image .2010.09.025
Bartolomeo P, Bachoud-Lévi A-C, Thiebaut de Schotten M (2014) The anatomy of cerebral achromatopsia: a reappraisal and com-parison of two case reports. Cortex 56:138–144. https ://doi. org/10.1016/j.corte x.2013.01.013
Berencsi A, Ishihara M, Imanaka K (2005) The functional role of central and peripheral vision in the control of posture. Hum Mov Sci 24:689–709. https ://doi.org/10.1016/j.humov .2005.10.014
Bloomfield SA, Völgyi B (2009) The diverse functional roles and regulation of neuronal gap junctions in the retina. Nat Rev Neurosci 10:495–506. https ://doi.org/10.1038/nrn26 36
Boucard CC, Hernowo AT, Maguire RP et al (2009) Changes in cortical grey matter density associated with long-standing retinal visual field defects. Brain 132:1898–1906. https ://doi. org/10.1093/brain /awp11 9
Boucart M, Naili F, Despretz P et al (2010) Implicit and explicit object recognition at very large visual eccentricities: no improvement after loss of central vision. Vis cogn 18:839–858.
https ://doi.org/10.1080/13506 28090 32878 45
Braddick OJ, O’Brien JMD, Wattam-Bell J et al (2001) Brain areas sensitive to coherent visual motion. Perception 30:61–72. https ://doi.org/10.1068/p3048
Burge WK, Griffis JC, Nenert R et al (2016) Cortical thickness in human V1 associated with central vision loss. Sci Rep 6:23268.
https ://doi.org/10.1038/srep2 3268
Campbell FW, Robson JG, Westheimer G (1959) Fluctuations of accommodation under steady viewing conditions. J Physiol 145:579–594
Caplovitz GP, Tse PU (2006) V3A processes contour curvature as a trackable feature for the perception of rotational motion. Cereb Cortex 17:1179–1189. https ://doi.org/10.1093/cerco r/bhl02 9
Caspers J, Zilles K, Eickhoff SB et al (2013) Cytoarchitectonical analysis and probabilistic mapping of two extrastriate areas of the human posterior fusiform gyrus. Brain Struct Funct 218:511–526. https ://doi.org/10.1007/s0042 9-012-0411-8
Chen WW, Wang N, Cai S et al (2013) Structural brain abnormalities in patients with primary open-angle glaucoma: a study with 3T MR imaging. Invest Ophthalmol Vis Sci 54:545–554. https :// doi.org/10.1167/iovs.12-9893
Cheung CMG, Wong TY (2014) Is age-related macular degeneration a manifestation of systemic disease? New prospects for early intervention and treatment. J Intern Med 276:140–153. https ://doi.org/10.1111/joim.12227
Coslett HB, Saffran E (1991) Simultanagnosia. To see but not two see. Brain 114 (Pt 4:1523–1545. https ://doi.org/10.1093/brain /114.4.1523
Das SR, Avants BB, Grossman M, Gee JC (2009) Registration based cortical thickness measurement. Neuroimage 45:867–879.
https ://doi.org/10.1016/j.neuro image .2008.12.016
Dessing JC, Rey FP, Beek PJ (2012) Gaze fixation improves the stability of expert juggling. Exp brain Res 216:635–644. https ://doi.org/10.1007/s0022 1-011-2967-6
Donders FC (1857) Beiträge zur pathologischen Anatomie des Auges. Albr von Graefes Arch für Ophthalmol 3:139–165.
https ://doi.org/10.1007/BF027 20685
Duret F, Issenhuth M, Safran AB (1999) Combined use of several preferred retinal loci in patients with macular disorders when reading single words. Vision Res 39:873–879. https ://doi. org/10.1016/S0042 -6989(98)00179 -5
Felleman DJ, Burkhalter A, Van Essen DC (1997) Cortical con-nections of areas V3 and VP of macaque monkey extrastriate visual cortex. J Comp Neurol 379:21–47. 10.1002/(SICI)1096-9861(19970303)379:1<21::AID-CNE3>3.0.CO;2-K Fender D, Julesz B (1967) Extension of Panum’s fusional area in
bin-ocularly stabilized vision. J Opt Soc Am 57:819–830. https ://doi. org/10.1364/JOSA.57.00081 9
Ferreira S, Pereira AC, Quendera B et al (2017) Primary visual cortical remapping in patients with inherited peripheral retinal degen-eration. NeuroImage Clin 13:428–438. https ://doi.org/10.1016/j. nicl.2016.12.013
Fischer E, Bülthoff HH, Logothetis NK, Bartels A (2012) Human areas V3A and V6 compensate for self-induced planar visual motion. Neuron 73:1228–1240. https ://doi.org/10.1016/j.neuro n.2012.01.022
Fortenbaugh FC, Hicks JC, Hao L, Turano KA (2007) Losing sight of the bigger picture: peripheral field loss compresses repre-sentations of space. Vision Res 47:2506–2520. https ://doi. org/10.1016/j.visre s.2007.06.012
Foulon C, Cerliani L, Kinkingnehun S et al (2018) Advanced lesion symptom mapping analyses and implementation as BCBtoolkit. Gigascience. https ://doi.org/10.1101/13331 4
Gattass R, Nascimento-Silva S, Soares JGM et al (2005) Cortical visual areas in monkeys: location, topography, connections, columns, plasticity and cortical dynamics. Philos Trans R Soc B Biol Sci 360:709–731. https ://doi.org/10.1098/rstb.2005.1629
Gegenfurtner KR, Kiper DC, Levitt JB (1997) Functional properties of neurons in macaque area V3. J Neurophysiol 77:1906–1923 Georgieva S, Peeters R, Kolster H et al (2009) The processing of
three-dimensional shape from disparity in the human brain. J Neurosci 29:727–742. https ://doi.org/10.1523/JNEUR OSCI.4753-08.2009
Glasser MF, Goyal MS, Preuss TM et al (2014) Trends and proper-ties of human cerebral cortex: correlations with cortical myelin content. Neuroimage 93:165–175. https ://doi.org/10.1016/j.neuro image .2013.03.060
Goldstein JH, Clahane AC (1966) The role of the periphery in bin-ocular vision. Am J Ophthalmol 62:702–706. https ://doi. org/10.1016/0002-9394(66)92198 -2
Hernowo AT, Prins D, Baseler H et al (2014) Morphometric analyses of the visual pathways in macular degeneration. Cortex 56:99– 110. https ://doi.org/10.1016/j.corte x.2013.01.003
Hosoya T, Baccus SA, Meister M (2005) Dynamic predictive coding by the retina. Nature 436:71–77. https ://doi.org/10.1038/natur e0368 9
Klein A, Andersson J, Ardekani BA et al (2009) Evaluation of 14 nonlinear deformation algorithms applied to human brain MRI registration. Neuroimage 46:786–802. https ://doi.org/10.1016/j. neuro image .2008.12.037
Kujovic M, Zilles K, Malikovic A et al (2013) Cytoarchitectonic map-ping of the human dorsal extrastriate cortex. Brain Struct Funct 218:157–172. https ://doi.org/10.1007/s0042 9-012-0390-9
Larsson J, Heeger DJ (2006) Two retinotopic visual areas in human lateral occipital cortex. J Neurosci 26:13128–13142. https ://doi. org/10.1523/JNEUR OSCI.1657-06.2006
Levene H (1960) Robust tests for equality of variances. In: Olkin I, Ghurye SG, Hoeffding W et al (eds) Contributions to probabil-ity and statistics: essays in honor of harold hotelling. Stanford University Press, Stanford, pp 278–292
Lorenz S, Weiner KS, Caspers J et al (2015) Two new cytoarchitec-tonic areas on the human mid-fusiform gyrus. Cereb Cortex BHV 225:1–13. https ://doi.org/10.1093/cerco r/bhv22 5
Luria SM (1971) Duction, stereoacuity and field of view.pdf. Optom Vis Sci 48:728–735
Malikovic A, Amunts K, Schleicher A et al (2007) Cytoarchitectonic analysis of the human extrastriate cortex in the region of V5/ MT+: a probabilistic, stereotaxic map of area hOc5. Cereb Cor-tex 17:562–574. https ://doi.org/10.1093/cerco r/bhj18 1
Malikovic A, Amunts K, Schleicher A et al (2016) Cytoarchitecture of the human lateral occipital cortex: mapping of two extrastri-ate areas hOc4la and hOc4lp. Brain Struct Funct 221:1877– 1897. https ://doi.org/10.1007/s0042 9-015-1009-8
Masland RH (2012) Another blue neuron in the retina. Nat Neurosci 15:930–931. https ://doi.org/10.1038/nn.3146
Maus GW, Weigelt S, Nijhawan R, Muckli L (2010) Does area V3A predict positions of moving. Objects? Front Psychol 1:1–11.
https ://doi.org/10.3389/fpsyg .2010.00186
McKeefry DJ, Burton MP, Morland AB (2010) The contribu-tion of human cortical area V3A to the percepcontribu-tion of chromatic motion: a transcranial magnetic stimulation study. Eur J Neurosci 31:575–584. https ://doi.org/10.111 1/j.1460-9568.2010.07095 .x
McKinnon SJ (2003) Glaucoma: ocular Alzheimer’s disease? Front Biosci 8:s1140–s1156
Meunier I, Puech B (2012) Maladie de Stargardt (Stargardt dis-ease). In: Cohen SY, Gaudric A (eds) Rétine. Lavoisier, Paris, pp 26–48
Mohlberg H, Eickhoff SB, Schleicher A et al (2012) A new processing pipeline and release of cytoarchitectonic probabilistic maps— JuBrain. In: OHBM. Peking
Münch T, da Silveira RA, Siegert S et al (2009) Approach sensitivity in the retina processed by a multifunctional neural circuit. Nat Neurosci 12:1308–1316. https ://doi.org/10.1038/nn.2389
Ölveczky BP, Baccus SA, Meister M (2003) Segregation of object and background motion in the retina. Nature 423:401–408. https :// doi.org/10.1038/natur e0165 2
Pham TQ, Kifley A, Mitchell P, Wang JJ (2006) Relation of age-related macular degeneration and cognitive impairment in an older popu-lation. Gerontology 52:353–358. https ://doi.org/10.1159/00009 4984
Plank T, Frolo J, Brandl-Rühle S et al (2011) Gray matter alterations in visual cortex of patients with loss of central vision due to hereditary retinal dystrophies. Neuroimage 56:1556–1565. https ://doi.org/10.1016/j.neuro image .2011.02.055
Poort J, Raudies F, Wannig A et al (2012) The role of attention in figure-ground segregation in areas V1 and V4 of the visual cortex. Neuron 75:143–156. https ://doi.org/10.1016/j.neuro n.2012.04.032
Power JD, Barnes KA, Snyder AZ et al (2012) Spurious but system-atic correlations in functional connectivity MRI networks arise from subject motion. Neuroimage 59:2142–2154. https ://doi. org/10.1016/j.neuro image .2011.10.018
Prins D, Plank T, Baseler HA et al (2016) Surface-based analyses of anatomical properties of the visual cortex in macular degen-eration. PLoS One 11:e0146684. https ://doi.org/10.1371/journ al.pone.01466 84
Pruim RHR, Mennes M, Buitelaar JK, Beckmann CF (2015) Evalu-ation of ICA-AROMA and alternative strategies for motion
artifact removal in resting state fMRI. Neuroimage 112:278–287.
https ://doi.org/10.1016/j.neuro image .2015.02.063
Qiu FT, Sugihara T, von der Heydt R (2007) Figure-ground mecha-nisms provide structure for selective attention. Nat Neurosci 10:1492–1499. https ://doi.org/10.1038/nn198 9
Reynolds JH, Desimone R (2003) Interacting roles of attention and vis-ual salience in V4. Neuron 37:853–863. https ://doi.org/10.1016/ S0896 -6273(03)00097 -7
Ribelayga C, Cao Y, Mangel SC (2008) The circadian clock in the retina controls rod-cone coupling. Neuron 59:790–801. https :// doi.org/10.1016/j.neuro n.2008.07.017
Roe AW, Chelazzi L, Connor CE et al (2012) Toward a unified theory of visual area V4. Neuron 74:12–29. https ://doi.org/10.1016/j. neuro n.2012.03.011
Rosa MGP, Manger PR (2005) Clarifying homologies in the mam-malian cerebral cortex: the case of the third visual area (V3). Clin Exp Pharmacol Physiol 32:327–339. https ://doi.org/10.111 1/j.1440-1681.2005.04192 .x
Rosenke M, Weiner KS, Barnett MA et al (2017) A cross-vali-dated cytoarchitectonic atlas of the human ventral visual stream. Neuroimage. https ://doi.org/10.1016/j.neuro image .2017.02.040
Roska B, Werblin F (2003) Rapid global shifts in natural scenes block spiking in specific ganglion cell types. Nat Neurosci 6:600–608.
https ://doi.org/10.1038/nn106 1
Rottschy C, Eickhoff SB, Schleicher A et al (2007) Ventral visual cor-tex in humans: cytoarchitectonic mapping of two extrastriate areas. Hum Brain Mapp 28:1045–1059. https ://doi.org/10.1002/ hbm.20348
Sabbah N, Sanda N, Authié CN et al (2017) Reorganization of early visual cortex functional connectivity following selective peripheral and central visual loss. Sci Rep 7:1–19. https ://doi. org/10.1038/srep4 3223
Safran AB, Achard O, Duret F, Landis T (1999) The “thin man” phe-nomenon: a sign of cortical plasticity following inferior homony-mous paracentral scotomas. Br J Ophthalmol 83:137–142. https ://doi.org/10.1136/bjo.83.2.137
Sahel J-A, Marazova K, Audo I (2015) Clinical characteristics and current therapies for inherited retinal degenerations. Cold Spring Harb Perspect Med 5:a017111. https ://doi.org/10.1101/cshpe rspec t.a0171 11
Salimi-Khorshidi G, Douaud G, Beckmann CF et al (2014) Automatic denoising of functional MRI data: combining independent com-ponent analysis and hierarchical fusion of classifiers. Neuroimage 90:449–468. https ://doi.org/10.1016/j.neuro image .2013.11.046
Shapiro SS, Wilk MB (1965) An analysis of variance test for nor-mality. Biometrika 52:591–611. https ://doi.org/10.1093/biome t/52.3-4.591
Sokunbi MO, Staff RT, Waiter GD et al (2011) Inter-individual dif-ferences in fMRI entropy measurements in old age. IEEE Trans Biomed Eng 58:3206–3214. https ://doi.org/10.1109/ TBME.2011.21647 93
Sokunbi MO, Fung W, Sawlani V et al (2013) Resting state fMRI entropy probes complexity of brain activity in adults with ADHD. Psychiatry Res Neuroimaging 214:341–348. https ://doi. org/10.1016/j.pscyc hresn s.2013.10.001
Stargardt K (1909) Über familiäre, progressive Degeneration in der Maculagegend des Auges. Albr von Graefes Arch für Ophthalmol 71:534–550. https ://doi.org/10.1007/BF019 61301
Stüber C, Morawski M, Schäfer A et al (2014) Myelin and iron concen-tration in the human brain: a quantitative study of MRI contrast. Neuroimage 93:95–106. https ://doi.org/10.1016/j.neuro image .2014.02.026
Szikra T, Trenholm S, Drinnenberg A et al (2014) Rods in daylight act as relay cells for cone-driven horizontal cell-mediated surround
inhibition. Nat Neurosci 17:1728–1735. https ://doi.org/10.1038/ nn.3852
Thiebaut de Schotten M, Urbanski M, Batrancourt B et al (2016) Rostro-caudal architecture of the frontal lobes in humans. Cereb Cortex. https ://doi.org/10.1093/cerco r/bhw21 5
Timberlake GT, Omoscharka E, Grose SA, Bothwell R (2012) Pre-ferred retinal locus—hand coordination in a maze-tracing task. Investig Opthalmol Vis Sci 53:1810. https ://doi.org/10.1167/ iovs.11-9282
Tononi G (1998) Complexity and coherency: integrating information in the brain. Trends Cogn Sci 2:474–484. https ://doi.org/10.1016/ S1364 -6613(98)01259 -5
Tsukamoto Y, Morigiwa K, Ueda M, Sterling P (2001) Microcircuits for night vision in mouse retina. J Neurosci 21:8616–8623 Turano K, Geruschat DR, Stahl JW, Massof RW (1999) Perceived
visual ability for independent mobility in persons with retinitis pigmentosa. Invest Ophthalmol Vis Sci 40:865–877
Turano KA, Massof RW, Quigley HA (2002) A self-assessment instrument designed for measuring independent mobility in RP patients: generalizability to glaucoma patients. Invest Ophthal-mol Vis Sci 43:2874–2881
Turner R, Oros-Peusquens AM, Romanzetti S et al (2008) Optimised in vivo visualisation of cortical structures in the human brain at 3 T using IR-TSE. Magn Reson Imaging 26:935–942. https ://doi. org/10.1016/j.mri.2008.01.043
Tustison NJ, Avants BB (2013) Explicit B-spline regularization in dif-feomorphic image registration. Front Neuroinform 7:39. https :// doi.org/10.3389/fninf .2013.00039
Tustison NJ, Cook PA, Klein A et al (2014) Large-scale evaluation of ANTs and FreeSurfer cortical thickness measurements. Neuroimage 99:166–179. https ://doi.org/10.1016/j.neuro image .2014.05.044
Ungerleider LG, Desimone R (1986) Projections to the superior tem-poral sulcus from the central and peripheral field representa-tions of V1 and V2. J Comp Neurol 248:147–163. https ://doi. org/10.1002/cne.90248 0202
Van Dijk KRA, Sabuncu MR, Buckner RL (2012) The influence of head motion on intrinsic functional connectivity MRI. Neu-roimage 59:431–438. https ://doi.org/10.1016/j.neuro image .2011.07.044
Vanduffel W (2002) Extracting 3D from motion: differences in human and monkey intraparietal cortex. Science 298:413–415. https :// doi.org/10.1126/scien ce.10735 74
Volgyi B (2004) Convergence and segregation of the multiple rod path-ways in mammalian retina. J Neurosci 24:11182–11192. https :// doi.org/10.1523/JNEUR OSCI.3096-04.2004
Wagstyl K, Ronan L, Goodyer IM, Fletcher PC (2015) Cortical thick-ness gradients in structural hierarchies. Neuroimage 111:241– 250. https ://doi.org/10.1016/j.neuro image .2015.02.036
Westlye LT, Walhovd KB, Dale AM et al (2010) Differentiating matu-rational and aging-related changes of the cerebral cortex by use of thickness and signal intensity. Neuroimage 52:172–185. https ://doi.org/10.1016/j.neuro image .2010.03.056
Wheatstone C (1962) On some remarkable and hitherto unobserved phenomena of binocular vision. Optom Wkly 53:2311–2315 Whiteside TCD (1957) Effect of empty-field myopia upon the
mini-mum visual angle for a distant target. In: The problems of vision in flight at high altitude. Butterworths Scientific, London, pp 105–112
Wittich W, Faubert J, Watanabe DH et al (2011) Spatial judgments in patients with retinitis pigmentosa. Vision Res 51:165–173. https ://doi.org/10.1016/j.visre s.2010.11.003
Woo SJ, Park KH, Ahn J et al (2012) Cognitive impairment in age-related macular degeneration and geographic atrophy. Oph-thalmology 119:2094–2101. https ://doi.org/10.1016/j.ophth a.2012.04.026
Yao Y, Lu WL, Xu B et al (2013) The increase of the functional entropy of the human brain with age. Sci Rep 3:1–8. https ://doi. org/10.1038/srep0 2853
Yu L, Xie B, Yin X et al (2013) Reduced cortical thickness in pri-mary open-angle glaucoma and its relationship to the retinal nerve fiber layer thickness. PLoS One 8:e73208. https ://doi. org/10.1371/journ al.pone.00732 08
Zeki S (2003) The processing of kinetic contours in the brain. Cereb Cortex 13:189–202. https ://doi.org/10.1093/cerco r/13.2.189
Zilles K, Amunts K (2010) Centenary of Brodmann’s map—conception and fate. Nat Rev Neurosci 11:139–145. https ://doi.org/10.1038/ nrn27 76
Zilles K, Amunts K (2015) Anatomical basis for functional speciali-sation. In: Uludag K, Ugurbil K, Berliner L (eds) fMRI: from nuclear spins to brain functions. Springer, New York, pp 27–66