HAL Id: hal-02077898
https://hal.archives-ouvertes.fr/hal-02077898
Submitted on 24 Mar 2019
HAL is a multi-disciplinary open access
archive for the deposit and dissemination of
sci-entific research documents, whether they are
pub-lished or not. The documents may come from
teaching and research institutions in France or
abroad, or from public or private research centers.
L’archive ouverte pluridisciplinaire HAL, est
destinée au dépôt et à la diffusion de documents
scientifiques de niveau recherche, publiés ou non,
émanant des établissements d’enseignement et de
recherche français ou étrangers, des laboratoires
publics ou privés.
Can microsolvation effects be estimated from vacuum
computations? A case-study of alcohol decomposition at
the H 2 O/Pt(111) interface
Benjamin Schweitzer, Stephan Steinmann, Carine Michel
To cite this version:
Benjamin Schweitzer, Stephan Steinmann, Carine Michel. Can microsolvation effects be estimated
from vacuum computations? A case-study of alcohol decomposition at the H 2 O/Pt(111)
inter-face. Physical Chemistry Chemical Physics, Royal Society of Chemistry, 2019, 21 (10), pp.5368-5377.
�10.1039/C8CP06331A�. �hal-02077898�
Jour
nal
Name
Can microsolvation effects be estimated from vacuum
computations? A case-study of alcohol
decomposi-tion at the H
2
O/Pt(111) interface
†
Benjamin Schweitzer,aStephan N. Steinmann,aand Carine Michela∗
Converting biomass into sustainable chemicals and energy feedstocks requires innovative het-erogeneous catalysts able to efficiently work in aqueous conditions. Computational chemistry is a key asset in the design of these novel catalysts, but it has to face two challenges: the large reaction networks and the potential role of hydration. They can be addressed using scaling re-lations such as Brønsted-Evans-Polanyi (BEP) and solvation models, respectively. In this study, we show that typical reaction and activation energies of alcohol decomposition on Pt(111) are not strongly modified by the inclusion of the water solvent as a continuum model. In contrast, adding a single water molecule strongly favors O-H and C-OH scission while it prevents C-O and to a lesser extent C-C scissions. The resulting BEP relationships partially reflect these changes in-duced by the solvent. Predicting Pt-catalyzed alcohol decomposition in water thus should account for the influence of the solvent on thermodynamics and kinetics. In addition, we found that the reaction energy obtained in presence of an explicit water molecule scales with the ones obtained in vacuum. Hence, we reveal that vacuum computations in combination with corrections based on our linear regressions are able to capture the important H-bonding effect.
1
Introduction
The necessity for sustainable chemical and energy ressources urges the scientific community to develop renewable processes. One of the many trails is the lignocellulosic biomass conversion, for energy and chemicals.1–3 The cellulosic fraction that can be
extracted contains mainly cellulose and hemicellulose at different relative amounts depending on the source material.4These sug-ars and polyols cannot easily be processed in gas phase but are water soluble. Thus, their valorisation necessitates the develop-ment of novel heterogeneous catalysts, active and stable in water, sustained by an improved knowledge of the reactivity of alcohol at the water/catalyst interface.
Density functional theory (DFT) has proven itself relevant to bring understanding in a variety of domains,5including photoin-duced phenomenons,6 bio-systems,7 and our field of interest,
heterogeneous catalysis,8at reasonable computational cost. DFT can now provide accurate energies of large systems,9and adsorp-tion energies on metal surfaces are in good agreement with exper-imental data when using state-of-the-art functionals.10,11
Cou-aUniv Lyon, Ens de Lyon, CNRS UMR 5182, Université Claude Bernard Lyon 1,
Labo-ratoire de Chimie, F69342, Lyon, France. E-mail: [email protected]
† Electronic Supplementary Information (ESI) available: [details of any supplemen-tary information available should be included here]. See DOI: 10.1039/b000000x/
pled with kinetic simulations, it can help designing efficient metal supported catalysts.12Modeling realistic heterogeneous catalysis
in liquid water remains highly challenging13 since it faces two main issues: how to take into account the hydration? how to identify optimal reaction pathways among extensive and complex reaction networks?
Several approaches can be used to investigate the impact of the water solvent at the metal/water interface as reviewed recently.14
A brute force approach consists in including a full description of the liquid water. While this approach is more and more feasi-ble when considering oxides such as silica15or alumina,16,17 it is still too costly to be systematically implemented in the case of metallic systems,18–20 and liquid water/metal interfaces are
typically modeled using ice-layers.21 Therefore, improved force fields22and approximate QM/MM schemes are being actively
de-veloped.23,24 A much cheaper approach is to utilize a polariz-able continuum model (PCM).25–32 It has been used recently to investigate hydrodeoxygenation of propanoic acid33and methyl
propionate34on Pd catalysts or the reforming of ethylene glycol on Pt35and for modelling electrocatalytic reactions.36However,
it is well-known that not all the effects of H-bonding can be de-scribed with a continuum solvent.25,37An elegant way to palliate this shortcoming is to explicitly introduce a few selected water molecules as shown not only in homogeneous phases25,38,39but
also on metal/water interfaces.40–42 For instance, on metal
sur-faces, the OH scission in alcohol is rather sensitive to H-bonding while the CH scission is not.41–44 Similarly, one could expect a larger impact on C-O scission than on the C-C one, but this has not been investigated yet in details with an explicit inclusion of water molecules.
A reasonable way of dealing with large and complex reac-tion networks in silico is to follow a multiscale approach.45,46 Starting with density functional theory (DFT) on smaller reac-tions networks, one can build linear scaling relareac-tionships and group additivity schemes for estimating reaction energies,47–49 and Brønsted-Evans-Polanyi (BEP) relationships for estimating re-action barriers.50–52Together, these fast approximations allow to perform micro-kinetic simulations for extended reaction networks to identify the most important pathways.53
In the quest of a universal BEP relationship to describe bond scissions at transition-metal surfaces,54–58several variants of the
BEP relationships have been proposed over the last decade.59–61 We have recently shown that the original formulation,62,63 that simply relates the activation energy with the reaction energy of the elementary step, performs very well to describe the C-H and O-H scissions in alcohols at metallic surfaces.61 However, very
few works focused on the influence of the solvent on these re-lationships for bond scission at metallic surfaces. We recently investigated the impact of a continuum water model on group additivity schemes49and the explicit inclusion of water on C-H and O-H bonds scissions on various metallic surfaces.43,44,64
In this study, we will address these two issues focusing on alco-hol decomposition catalyzed by a Pt catalyst immersed in water. This choice is motivated by the work of Dumesic and co-workers that have identified Pt as a reasonable catalyst for aqueous phase reformation of mono and polyols such as sorbitol or glycerol.65To
assess the role of the solvent model, we systematically compare the continuum approach (PCM) with the combination of PCM and micro-solvation, that is called cluster-continuum model (CCM),38
on a set of typical scissions in alcohols (over 40 reactions). The corresponding BEP relations are established and their sensitiv-ity to the solvent model is discussed. Last, we demonstrate that the reaction energy of the elementary steps under consideration scales with the ones obtained in vacuum or PCM. As a result, the BEP established here including the influence of the solvent can be used with reaction energies computed in vacuum, considerably speeding up the exploration of extensive reaction networks.
2
Computational methods
2.1 Periodic DFT
Restricted periodic density functional theory (DFT) computa-tions were performed using the Vienna Ab-initio Simulation Pack-age,66–69VASP 5.3.5. The ion-electron interactions are described
using the projector augmented wave (PAW) method.70,71 The
electronic structure is described within the generalized gradient approximation (GGA), using the PBE exchange correlation func-tional,72,73 with a plane wave basis set cut off at 400 eV.
Dis-persion interactions are included with the recently implemented
dDsC dispersion correction, that computes electronic structure dependent dispersion coefficients74 and couples the dispersion correction to the density functional via a bond-index based damp-ing function.75 This scheme has been shown to perform excel-lently for adsorption energies on Pt(111).10 Integration of the Brillouin zone is performed with a Monkhorst-Pack mesh76 of
3x3x1 k-points for surface species, and the gamma point for gaseous species. Convergence criteria are set to 10−6 eV for the electronics and 0.02 eV Å−1 for the forces. Dipole corrections were applied when a polarizable continuum solvent model was used, in order to avoid an overestimation of dipolar interaction between the solvent model and the electronic system.
The platinum surface is modeled using a p(3x3) cell of a 4 lay-ers slab, with 9 laylay-ers of void. The optimal bulk position was obtained with a Pt-Pt distance of 2.80 Å , which is used as a con-straint for the two bottom layers of the slab. Gaseous species are computed in a cubic box of 20 Å in length. To save computational time, the reported energies do not include zero point energy cor-rection.
2.2 Continuum solvent model
Solvation effects are taken into account using a Polarizable Continuum Model (PCM) available for VASP as the VASPSol pack-age.29,30This allows to compute a solvation free energy as in eq 1.
∆GPCMinter = ∆Gelec+ ∆Gcavitation (1)
where ∆GPCM
inter represents the interaction energy between the
con-tinuum solvent and the solute, which is composed of the electro-static interaction ∆Gelecand the non-electrostatic term ∆Gcavitation
which depends on the area of the cavity and captures an average of positive and negative contributions (Pauli repulsion and dis-persion interactions). This second term is often called cavitation energy and was set to 0 for our study to increase computational efficiency (see ref 49 for a discussion of the small effect of the cavitation energy). Therefore, the solvent model only assess di-electric interactions. We used default values for the empirical parameters and dielectric constant, which are representative of water.
2.3 Transition states
The transition states were optimized using the same level of theory, with either a quasi Newton algorithm when the structures were close enough to the saddle point, or the dimer method77. Each transition state is confirmed by a normal mode analysis showing a unique imaginary frequency following the expected displacement mode.
2.4 BEP relations
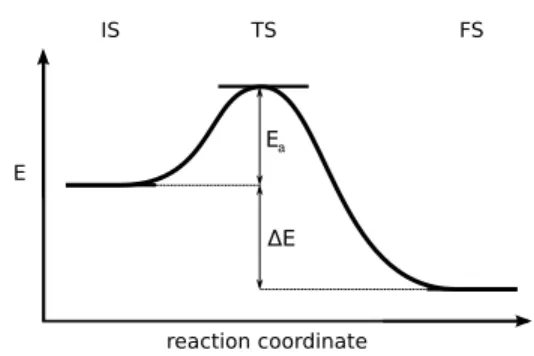
Fig. 1 Definition of the reaction energy and the activation energy
Brønsted-Evans-Polanyi50–52(BEP) relations consist in linearly correlating a reaction energy and its activation energy. The criti-cal point is to define the proper reaction set, which should be gen-eral enough, but without loosing too much system specificity. For instance, we could not establish reliable BEP relationships when using a large set of hydrogenation or C-C bond formation reac-tions of hydrocarbons on Pd78. We define the BEP relations as follows:
Ea= α∆E + β (2)
with α and β as the fitting parameters, Eathe activation energy
and ∆E the energy difference between the final state (FS) and the initial state (IS) (see Figure 1):
∆E = EFS− EIS (3)
We will consider energies as E = EDFT+ ∆GsolvPCMfor calculations
including PCM solvation.
2.5 Set of reactions
Following our previous study,4411 typical C-H and the O-H scis-sions reactions are investigated. In this set, all C-H are in α posi-tion to a hydroxyl or alkoxy group. 17 reacposi-tions from the ethanol reforming network were considered for the C-C scissions and 15 for the C-O.79All C-C bonds belong to a fragment with an oxygen atom. In the Cluster Continuum Model (CCM), a water molecule has been added. Starting from the PCM optimized structure, sev-eral configurations have been tested where this water molecule is H-bonded with the molecular fragment and is chemisorbed on a neighbor Pt (top site) through its lone pair. A detailed list of the reactions can be found in supplementary materials together with the corresponding energies and structures.
3
Results and discussion
Reaction and activation energies of 43 typical alcohol decomposi-tion steps on Pt(111) were computed to compare two models of solvation: polarizable continuum model (PCM) and polarizable continuum model supplemented with the explicit inclusion of a water molecule in a Cluster Continuum Model (CCM). To assess the impact of solvation on quantities of interests such as the reac-tion energy ∆E and the activareac-tion energy Ea, we have introduced
the solvation enhancement49Λsol. For instance, Λsol∆E(PCM)
repre-sents the effect of the inclusion of the PCM on the reaction energy and is defined as:
Λsol∆E(PCM) = ∆EPCM− ∆Evacuum (4)
A negative value of Λsol
∆E(PCM)means that the reaction is favored
by the PCM, and a positive the opposite.
Before comparing these two solvation models and their impact on BEP relationships, we have taken advantage of this study to analyse the impact of dispersion corrections on BEP relationships.
3.1 Dispersion effects
Since most of the BEP relationships provided in the literature were obtained using GGA energies that were not corrected for dispersion interactions, we have analyzed the effect of the inclu-sion of the dDsC disperinclu-sion correction on the reaction and acti-vation energies and on the resulting BEP relationships. Detailed values are available in the SI. The dispersion correction increases the reaction energies for C-C and C-O scissions by a mean of 0.05 eV and 0.03 eV respectively, while the reaction barriers are hardly affected. The impact is similar on reaction energies and barriers for C-Hα with a mean of -0.03 eV for the reaction energies and
-0.04 eV for the activation energies. As a consequence, the cor-responding BEP relationships are barely affected (see Table S1) by the inclusion of dispersion effects. For O-H scissions, reaction energies are slightly more modified than barriers as illustrated by the O-H cleavage of CH3C(OH)CH3 to CH3C(O)CH3, Figure 2, where the reaction barrier only decreases from 0.82 to 0.81 eV, while the reaction energy goes up from -0.02 to 0.14 eV. In this extreme case, the reactant is adsorbed through an sp3 α carbon, bringing the methyl groups close to the surface, which is stabi-lized upon inclusion of the dispersion. After the reaction, the steric hindrance does not allow the C=O bond to be chemisorbed in a π configuration. Therefore, the product is adsorbed by the oxygen lone pairs, with the methyl groups at a longer distance from the surface, reducing the dispersion interaction with the sur-face. All in all, the reaction becomes endothermic (∆E = 0.14 eV) upon the inclusion of a dispersion correction while it is slightly exothermic (∆E = −0.02 eV) without it. However, the impact of the dispersion correction on reaction and activation energies is limited on average and the corresponding BEP relationships are barely affected as shown in Table S1.
Fig. 2 Structures of CH3C(OH)CH3 and CH3C(O)CH3 adsorbed on
eV d) CC CH OH C-OH C-O 1.00 0.75 0.50 0.25 0.00 0.25 0.50 0.75 1.00 eV c) CC CH OH C-OH C-O 1.00 0.75 0.50 0.25 0.00 0.25 0.50 0.75 1.00 ΔE
Λ
sol avacuum CCM ΔEΛ
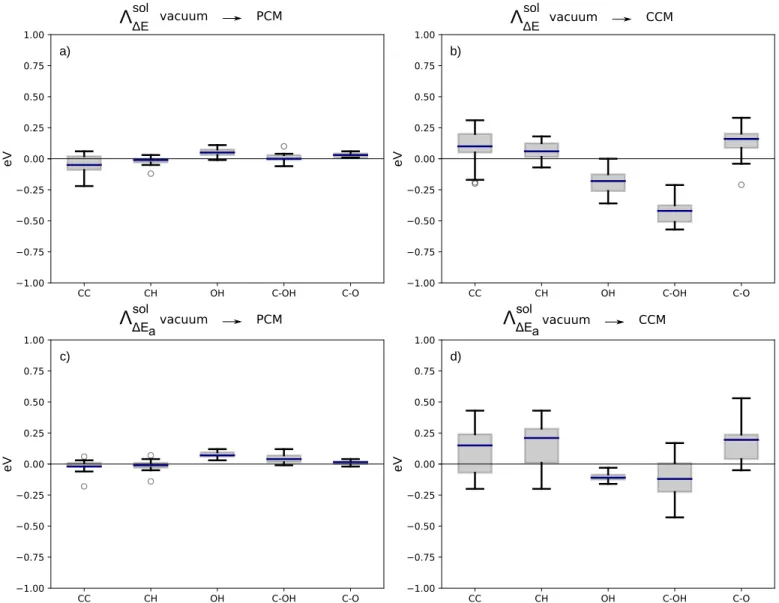
sol avacuum PCM CCM vacuum eV b) eV a) CC CH OH C-OH C-O 1.00 0.75 0.50 0.25 0.00 0.25 0.50 0.75 1.00 PCM vacuum CC CH OH C-OH C-O 1.00 0.75 0.50 0.25 0.00 0.25 0.50 0.75 1.00Fig. 3 Solvation enhancement for reaction and activation energies of C-C, C-H, O-H and C-O scissions, the later being separated in two subsets
(C-OH & C-O). a) Solvation enhancement on reaction energies using PCM ; b) Solvation enhancement on reaction energies using CCM; c) Solvation enhancement on activation energies using PCM; d) Solvation enhancement on activation energies using CCM. The boxes represent the first and the third quartiles of the data distribution, the blue band is the median (second quartile) and the whiskers are the minimum and the maximum, outliers are represented as individual points.
3.2 Polarisable Continuum Model (PCM)
To assess the influence of the water PCM on the reaction energies and activation energies in alcohol decomposition, Λsol
∆E(PCM)and
ΛsolE
a(PCM)were collected for the entire set of elementary steps.
Their distribution are represented as box plots in Figure 3, sepa-rating the various types of bonds under consideration: C-H, O-H, C-C and C-O(H). For the sake of consistency with the rest of the discussion, the C-O(H) set was split into two subsets (C-O and C-OH), but this is clearly not necessary at this stage as shown by the similarity of the box plots. To start, it is worth noting that the values of Λsol(PCM)span a limited range of energy, with the
largest value obtained for a C-C scission at Λsol
∆E(PCM)=-0.22 eV
(CH3-COH scission). This is in the range of what has been found
in previous studies.14,32,37,49
When considering more specifically the O-H scission, the PCM water solvent shifts up the reaction barriers and the reaction
en-ergies by an average of 0.05 eV. This can be explained by the high affinity of O-H groups for the PCM solvent: the system is loosing a well solvated group by breaking this bond weakening the so-lute/solvent interaction along the reaction.49Conversely, the C-Hα bond dissociation generally induces only small modification
of the orientation of the hydroxyl group. As a consequence, the hydration energy does not vary much and Λsol is almost zero for
most C-H scissions.
While the activation energy of C-C dissociation is generally not affected, the reaction energy is more exothermic for most reactions upon the inclusion of the water solvent as a PCM (Λsol
∆E(PCM)<0). That the PCM favors C-C cleavage can be
ra-tionalized bearing in mind that all our C-C reactions involve an oxygen atom attached at one of the carbon atom. Hence, break-ing the reactant can lead to products with an oxygenated group pointing towards the solvent and therefore enhancing the
action with the implicit model through dipole/continuum inter-action.49Conversely, the dissociation of the C-O(H) bond is gen-erally slightly slowed down by the PCM hydration ((Λsol
∆Ea(PCM)
> 0) and the corresponding reaction energies are more endother-mic.
3.3 Cluster Continuum Model (CCM)
A clear limitation of the PCM is the correct description of H-bonding between the solvent and the solute. To circumvent this issue, the cluster continuum model (CCM) includes one or a few water molecules, H-bonded to the solute, to capture this contri-bution to the solvation energy (or its variation). Here, we have chosen to systematically add a water molecule to adsorbates with an oxygen atom. When possible, the water molecule was placed as to form an H-bond with the adsorbed organic fragment and on atop sites, so that the oxygen lone-pair optimally interacts with the Pt surface, which can lead to significant geometric distortions. In Figure 3, the Λsol box plots obtained for CCM are shown
to-gether with the ones obtained with PCM. Clearly, the addition of a water molecule influences the reaction and activation energies of alcohol decomposition much more than the PCM.
Let us focus first on a typical case. The largest solvent effect is found for the activation energy of the C-O scission in CH3CH2−O (Λsol
Ea=0.53 eV). Figure 4 shows the reaction energy profile for
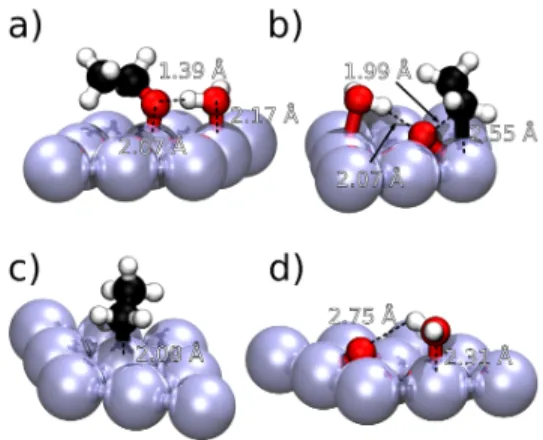
the C–O scission, illustrating that the PCM only leads to a global stabilization of ∼0.1 eV compared to vacuum. CCM, however, stabilizes the initial state more than the final state (difference of ∼0.2 eV), while it leaves the TS almost unaffected, increas-ing the activation energy. The correspondincreas-ing geometries in vac-uum and using CCM are depicted in Figure 5 and 6 respectively. CH3CH2O in presence of an explicit water molecule illustrates the typical case where the adsorbate is the H-bond acceptor. The O lone pair of CH3CH2O interacts indeed strongly with the hydro-gen of the chemisorbed water in a very short H-bond (1.39 Å), with a concomitant increase of the Pt-O bond (from 1.99 Å in vacuum to 2.07 Å in CCM). This cumulation of water chemisorp-tion and H-bonding has a strong synergy as already detailed in similar cases80, which explains the strong stabilization of the
ini-tial state seen in Figure 4. In the transition state, the H-bonding is almost lost (2.07 Å) and water does not interact anymore in an ideal configuration with Pt(111), explaining the little stabiliza-tion observed from vacuum to CCM in Figure 4 and the strong ΛsolEa of 0.53 eV. In the final state, water is chemisorbed in a neigh-boring position, with no specific interaction with the chemisorbed oxygen. The gain in energy compared with vacuum or PCM corre-sponds to the chemisorption of water with no extra-stabilization of the chemisorbed oxygen. Thus, the reaction energy becomes endothermic (+0.24 eV) and Λsol
∆E=0.33 eV.
After having discussed the most affected case, we now turn to the general trends that can be deduced from Figure 3. The contrasting behavior of Λsol(CCM)for the C-OH and C-O scissions
leads us to separate them into two subsets. The C-OH gathers the cases where the oxygen is involved in an hydroxyl group while the C-O set collects the other fragments.
While the C-O scissions are clearly hindered with Λsol ∆E(CCM) 0.00 -0.08 -0.77 1.37 1.27 1.13 -0.09 -0.16 -0.53 E (eV)
Fig. 4 Reaction pathway for the C-O scission of CH3CH2−O to CH3CH2
and O in vacuum in black, in PCM in red and in CCM in blue. The ref-erence is the pristine slab, the chemisorbed initial state and an isolate water molecule, all in vacuum. Corresponding structures are shown in Figure 5 and Figure 6
Fig. 5 Vacuum optimized structures a) Initial state CH3CHO b) Transition state CH3CH2−O c) Final state CH3CH2d) Final state O
Fig. 6 CCM optimized structures a) Initial state CH3CH2O b) Transition
and Λsol
Ea(CCM) being strongly positive (0.12 eV and 0.18 eV
on average respectively), the C-OH scissions are facilitated by the explicit presence of a H-bonded molecule, with an average Λsol∆E(CCM)of -0.43 eV. This opposite effect of the micro-solvation can be traced back to the solvation of the resulting OH fragment (C-OH set) vs. atomic O (C-O set) that are generated from the bond breaking. OH-H2O exhibits a very stabilizing interaction (-0.72 eV gain in energy) to be compared with the adsorption of water from bulk PCM to Pt/water interface (-0.35 eV). Conversely, the atomic O fragment has no interaction with the added water molecule since the explicit description of water leads to a gain of only -0.37 eV.
For C-Hα scissions, the average ΛsolEa(CCM)and Λ
sol
∆E(CCM) of
0.07 and 0.16, respectively, indicate that the inclusion of a water molecule to solvate the hydroxyl or the oxygen group, hampers this bond breaking process. As already discussed in previous stud-ies,43,44,64this effect can be related to a stronger constraint on
the fragment, limiting the access to the ideal geometry to break the C-H bond when it is in α position to a hydroxyl group.
Splitting the C-C bond responds very similarly to the inclusion of an explicit water molecule as the C-Hα scissions. Especially
on Λsol
∆E(CCM) the larger distance between the whiskers of the
box plot evidence that the variability is larger than for the other sets. This can be rationalized by the competition between the geometric constraints, in analogy to breaking the C-Hα and an
electronic stabilization of the oxygenated fragments by CCM. Last, the O-H rupture was slightly but clearly disfavored by PCM compared with the situation in gas phase. With the in-clusion of a water molecule that is H-bonded to this hydroxyl group, the situation drastically changes, with reaction energies and activations energies that are noticeably more favorable (av-erage Λsol
Ea(CCM)and Λ
sol
∆E(CCM)of -0.21 and -0.11 respectively),
in line with previous studies.42–44,64
3.4 BEP relations
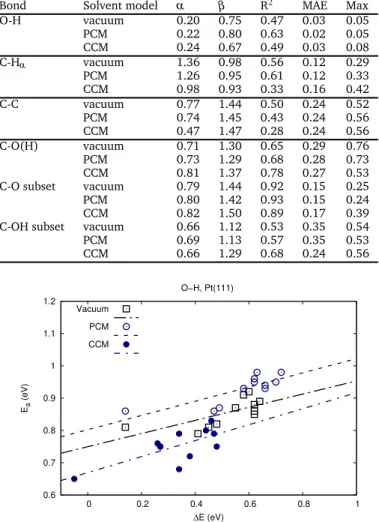
We now turn to the important question of the impact on the BEP relationships of the observed modifications in bond scissions in-duced by the solvent model. The regression parameters of the BEP relations are collected in Table 1. We will mainly base our discussion on the mean average error (MAE) and maximal error (MAX). R2is not always the most suitable figure of merit for the
prediction using BEP relations. For instance, for early transition states such as O-H scissions, the activation energy does not de-pend much on the reaction energy (low α). As a consequence, the activation energy is rather a constant than a function of the reaction energy, which results in a low R2. Nevertheless, the
pre-diction of the activation energies is particularly simple, since it is a constant (β ).
To start with, let us consider the O-H bond scission. Figure 7 gathers the BEP relationships in vacuum, PCM and CCM. The three lines are almost parallel and clearly separated. The corre-sponding equations are provided in Table 1. The apparent large scattering of the data is due to the fact that the deviations from the linear model (MAX of ∼0.05 eV) is of the order of magni-tude as the range of activation energies (∼0.1 eV). As expected
based on the previous discussion, the line matching the PCM data is above the vacuum one, while the line matching the CCM is be-low. However, this behavior is not general. Despite the increase in the activation and reaction energies observed for C-Hαbond
scis-sions with CCM (Figure 3), the BEP is only slightly tilted, but not significantly shifted compared to vacuum or PCM (Figure 8). Pro-vided the dispersion of the data especially in the low activation energy region, the three lines can even be considered identical. In other words, both solvent models on average influence the reac-tion and the activareac-tion energy of a C-Hα to the same extent. The
same conclusion can be drawn regarding the other dissociations as shown in Figure S3 and Figure S4. Nevertheless, since the ther-modynamics can still be influenced by the solvation model, this does not imply that solvation can be ignored for these reactions, as indicated earlier (Figure 3).
The O-H scission BEP shows the best quality (see Table 1), whatever the environment taken into consideration (vacuum, PCM, CCM). The mean absolute error (MAE) is lower than 0.03 eV and the maximal error (MAX) is under 0.1 eV. The slope α is lower than 0.5, indicating that the O-H rupture is an early pro-cess, with a transition state that is closer to the initial state than the final state. Hence, for these steps, the stability of the product does not significantly influence the catalytic activity. The C-H dis-sociation shows a larger scattering of the data (Figure 8), increas-ing the MAE and the MAX (> 0.1 eV and >0.3 eV respectively). The steps with a low activation energy are liable for those large er-rors. They correspond to the C-Hαscission in alkoxy species, e.g.,
ethoxy, CH3CH2O. Since the formation of these alkoxy species on Pt is rather unfavorable, accurately describing their decompo-sition through fast C-H scission is not critical in a micro-kinetic modeling. Removing these species leads to a BEP relation with a clearly improved correlation and a MAE lower than 0.1 eV (Figure S1), a relation that could be used to predict the C-H scission in alcohols with a good accuracy while activation of the C-H scission in alkoxy could be assigned a low activation barrier.
The regressions for C-O dissociations are overall of lower qual-ity compared with the ons for O-H or C-H. With a MAE of around 0.30 eV and MAX higher than 0.75 eV, it shows a larger intrin-sic uncertainty. However, the relative error is still around 20% since the average activation energy is around 1.9 eV for the scis-sion of C-O bonds while it is around 0.7 eV for ones of O-H and C-H bonds. Similarly, the correlation coefficient is in the same ballpark as for the other BEPs. Since the C-O scission exhibited contrasted sensitivity to CCM depending on the oxygen fragment generated (OH or atomic O, see Figure 3), two separate regres-sions were performed for the C-OH and C-O subset (see defini-tion earlier). They are represented in Figure S4. The quality is noticeably improved for the C-O subset compared with the origi-nal C-O(H) set that includes also the C-OH (MAE around 0.15 eV and MAX lower than 0.5 eV, see Table 1). Yet, the C-OH scissions are still widely dispersed and show a greater sensitivity to the in-clusion of an explicit H-bonded molecule. Last, the C-C scissions exhibit a regression quality similar to C-O, with an average error of ∼0.25 eV and a maximal error ∼0.55 eV on the prediction of activation barriers that range from 0.4 eV to 2 eV. The quality of the BEP relation is the same for the vacuum, PCM and CCM.
Table 1 BEP regression parameters using the data obtained in vacuum,
PCM and CCM separately: α, the slope ; β , the intercept in eV ; Mean Absolute Error (MAE, eV) ; Maximal error (Max, eV).
Bond Solvent model α β R2 MAE Max O-H vacuum 0.20 0.75 0.47 0.03 0.05 PCM 0.22 0.80 0.63 0.02 0.05 CCM 0.24 0.67 0.49 0.03 0.08 C-Hα vacuum 1.36 0.98 0.56 0.12 0.29 PCM 1.26 0.95 0.61 0.12 0.33 CCM 0.98 0.93 0.33 0.16 0.42 C-C vacuum 0.77 1.44 0.50 0.24 0.52 PCM 0.74 1.45 0.43 0.24 0.56 CCM 0.47 1.47 0.28 0.24 0.56 C-O(H) vacuum 0.71 1.30 0.65 0.29 0.76 PCM 0.73 1.29 0.68 0.28 0.73 CCM 0.81 1.37 0.78 0.27 0.53 C-O subset vacuum 0.79 1.44 0.92 0.15 0.25 PCM 0.80 1.42 0.93 0.15 0.24 CCM 0.82 1.50 0.89 0.17 0.39 C-OH subset vacuum 0.66 1.12 0.53 0.35 0.54 PCM 0.69 1.13 0.57 0.35 0.53 CCM 0.66 1.29 0.68 0.24 0.56 0.6 0.7 0.8 0.9 1 1.1 1.2 0 0.2 0.4 0.6 0.8 1 Ea (eV) ∆E (eV) O−H, Pt(111) Vacuum PCM CCM
Fig. 7 BEP relationships for the O-H scission in vacuum, PCM and CCM.
Here again, the quality is improved removing the fragments that contain an hydroxyl function (C-COH scission), with a decreased mean absolute error of 0.2 eV and and maximal error of 0.4 eV (see Figure S2). However, prediction of the complementary set (C-CO scission) is worse with a mean absolute error of 0.32 eV and a maximal error of 0.60 eV. Thus, we propose to keep all C-C scissions in a unique set.
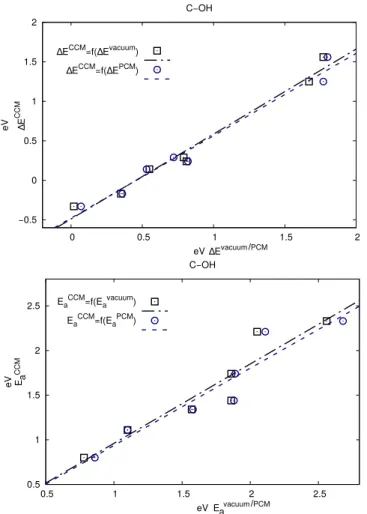
3.5 Predicting the solvation enhancement
The inclusion of the water solvent can strongly modify the pre-dicted reaction energies and activation energy, especially when using CCM. However, placing an explicit solvent molecule in-creases the computational and human burden and remains ar-bitrary to a certain extent. Thus, it would be highly desirable to predict the reaction energies and activations energies in wa-ter from the ones obtained in vacuum or at least from the ones obtained using PCM, which is much easier to set up. In Figure 9, we show that the reaction energies in water using CCM nicely correlate with the ones in vacuum or PCM for the C-OH scissions, opening the door to a simplified prediction of improved reaction
0 0.2 0.4 0.6 0.8 1 1.2 −0.8 −0.7 −0.6 −0.5 −0.4 −0.3 −0.2 −0.1 0 0.1 Ea (eV) ∆E (eV) C−H, Pt(111) Vacuum PCM CCM
Fig. 8 BEP relationships for the C-Hα scission in vacuum, PCM and
CCM.
Table 2 Regression parameters for the prediction of the CCM reaction
energy (∆ECCM) from the one obtained using vacuum (∆Evac): s, the slope
; t, the intercept in eV ; Mean Absolute Error (MAE, eV) ; Maximal error (Max, eV).
Bond s t R2 MAE Max
O-H 0.77 -0.07 0.55 0.09 0.18 C-Hα 0.95 0.05 0.72 0.06 0.14
C-C 1.03 0.09 0.86 0.12 0.29 C-O 0.88 0.20 0.96 0.09 0.32 C-OH 1.08 -0.49 0.98 0.09 0.14
energies. This behavior is typical and was found for all the other sets (see Figures S3-S14). The corresponding regressions param-eters are given in Table 2 and lead to MAE of about 0.1 eV.
This scaling relation between vacuum and CCM can be used to predict ∆ECCM. In combination with the BEPs we have
estab-lished, it can predict activation energies that include the micro-solvation effect. This approach results in an hybrid BEP that pre-dicts ∆ECCM
a from ∆Evacuum. The regression parameters of this
hybrid BEP are reported in Table 3. The quality is remarkably good, i.e., on par or better than the original BEPs of Table 1 at a minimal computational cost.
4
Conclusions
In this study, we have investigated the impact of continuum solvation model (PCM) and the explicit inclusion of a water molecule (CCM) on more than 40 typical bond scissions in al-cohols on Pt(111). While the PCM has a limited impact on the activation and reaction energies, the CCM strongly favors O-H and OH scissions while it prevents O and to a lesser extent
C-Table 3 Hybrid BEP (ECCM
a = αH.∆Evac+ βH) regression parameters: αH,
the slope ; βH, the intercept in eV ; Mean Absolute Error (MAE, eV) ;
Maximal error (Max, eV)
Bond αH βH R2 MAE Max
O-H 0.18 0.66 0.38 0.03 0.07 C-Hα 1.34 1.13 0.50 0.13 0.36
C-C 0.64 1.53 0.42 0.21 0.54 C-O 0.71 1.68 0.82 0.21 0.39 C-OH 0.73 0.95 0.71 0.23 0.53
−0.5 0 0.5 1 1.5 2 0 0.5 1 1.5 2 eV eV C−OH
∆ECCM=f(∆Evacuum)
∆ECCM=f(∆EPCM) 0.5 1 1.5 2 2.5 0.5 1 1.5 2 2.5 eV eV C−OH EaCCM=f(Eavacuum) EaCCM=f(EaPCM) ∆E CCM CCM PCM ∆Evacuum/ PCM vacuum/ E a Ea
Fig. 9 Activation and reaction energies of the C-OH subset obtained
with the CCM model in function of the activation and reaction energies obtained in vacuum (squares) and activation and reaction energies ob-tained in PCM (dots) and the corresponding regression lines. The re-gression parameters are reported in Table 2
C and C-Hα. In other words, the presence of water may strongly
modify the reaction paths followed during alcohol decomposition at the Pt(111)/water interface compared with the Pt(111)/gas interface. Noticeably, the slight effects induced by the PCM are opposite to those obtained with CCM, suggesting that the im-plicit solvation model is not adapted to capture the effect of an H-bonding water molecule. The impact of the solvent can also be seen in the resulting BEP relationships. For instance we obtained three parallel lines for the O-H scission in vacuum, PCM and CCM. The quality of these BEP relationships is not strongly affected by the inclusion of the solvent, whatever the model. Somewhat sur-prisingly, the reaction energy at the CCM level can be estimated through a linear regression based on vacuum DFT values. Hence, vacuum computations in combination with simple corrections are able to capture the important H-bonding effect. This lead us to propose a hybrid approach were reaction energies of interest can be easily evaluated at the Pt(111)/vacuum interface, then extrap-olated at the CCM level and used in a hybrid BEP that relates the activation energy at the Pt(111)/water interface and the reaction energy at the Pt(111)/vacuum interface. The quality of the later is on par and sometimes even better than the BEP relationships obtained at the CCM level. This is a promising strategy to improve the quality of the prediction of activation and reaction energies of extensive reaction networks such as in the aqueous phase reform-ing of alcohols.
5
Acknowledgements
The authors would like to acknowledge for the computational ressources granted by GENCI as allocation A0030810119 on Curie and Occigen clusters. The local cluster of the Pôle Scien-tifique de Modélisation Numérique (PSMN) is to also to receive to special thanks for it’s ressources. This work was funded by the Agence Nationale de la Recherche as the project MuSiC, number ANR-14-CE06-0030. The authors kindly thanks the group of D. G. Vlachos for providing the initial geometries of the C-C and C-O transition states.
References
1 B. G. Harvey, W. W. Merriman and R. L. Quintana, Chem-SusChem, 2016,9, 1814–1819.
2 E. L. Kunkes, D. A. Simonetti, R. M. West, J. C. Serrano-Ruiz, C. A. Gärtner and J. A. Dumesic, Science, 2008,322, 417–421.
3 M. J. Climent, A. Corma and S. Iborra, Green Chem., 2014,
16, 516–547.
4 J. K. Saini, R. Saini and L. Tewari, 3 Biotech, 2015,5, 337–
353.
5 W. Koch and M. C. Holthausen, A chemist’s guide to density functional theory, Wiley-VCH, 2002.
6 A. Petrone, D. B. Lingerfelt, D. B. Williams-Young and X. Li, The Journal of Physical Chemistry Letters, 2016,7, 4501–4508.
7 A. Francés-Monerris, H. Gattuso, D. Roca-Sanjuán, I. Tuñón, M. Marazzi, E. Dumont and A. Monari, Chem. Sci., 2018, 9,
7902–7911.
8 J. K. Nørskov, F. Abild-Pedersen, F. Studt and T. Bligaard, Pro-ceedings of the National Academy of Sciences, 2011,108, 937–
943.
9 R. Johnson, Erin, Density Functionals, Springer, 2015. 10 S. Gautier, S. N. Steinmann, C. Michel, P. Fleurat-Lessard and
P. Sautet, Phys. Chem. Chem. Phys., 2015,17, 28921–28930.
11 W. Lew, M. C. Crowe, C. T. Campbell, J. Carrasco and A. Michaelides, The Journal of Physical Chemistry C, 2011,
115, 23008–23012.
12 J. M. Norksøv, T. Bligaard, J. Rossmeisl and C. H. Christensen, Nature Chem., 2009,1, 37–46.
13 R. Réocreux and C. Michel, Curr. Opin. Green Sus. Chem., 2018,10, 51–59.
14 M. Saleheen and A. Heyden, ACS Catal., 2018,8, 2188–2194.
15 M. Pfeiffer-Laplaud and M.-P. Gaigeot, J. Phys. Chem. C, 2016,
120, 14034–14047.
16 B. F. Ngouana-Wakou, P. Cornette, M. C. Valero, D. Costa and P. Raybaud, J. Phys. Chem. C, 2017,121, 10351–10363.
17 R. Réocreux, T. Jiang, M. Iannuzzi, C. Michel and P. Sautet, ACS Applied Nano Materials, 2018,1, 191–199.
18 J. Liu, X.-M. Cao and P. Hu, Phys. Chem. Chem. Phys., 2014,
16, 4176–4185.
19 L. Bellarosa, R. Garcia-Muelas, G. Revilla-Lopez and N. Lopez, ACS Cent. Sci., 2016,2, 109–116.
20 R. F. de Morais, T. Kerber, F. Calle-Vallejo, P. Sautet and D. Lof-freda, Small, 2016,12, 5312–5319.
21 S. K. Desai, V. Pallassana and M. Neurock, J. Phys. Chem. B,
2001,105, 9171–9182.
22 S. N. Steinmann, R. Ferreira de Morais, A. W. Götz, P. Fleurat-Lessard, M. Iannuzzi, P. Sautet and C. Michel, J. Chem. Theory Comput., 2018,14, 3238–3251.
23 M. Faheem and A. Heyden, J Chem Theory Comput, 2014,10,
3354–3368.
24 S. N. Steinmann, P. Sautet and C. Michel, Phys. Chem. Chem. Phys., 2016,18, 31850–31861.
25 C. J. Cramer and D. G. Truhlar, Chem. Rev., 1999,99, 2161–
2200.
26 J. Tomasi, B. Mennucci and R. Cammi, Chem. Rev., 2005,105,
2999–3094.
27 M. Cossi, N. Rega, G. Scalmani and V. Barone, Journal of Com-putational Chemistry, 2003,24, 669–681.
28 A. Klamt and G. Schüürmann, J. Chem. Soc., Perkin Trans. 2, 1993, 799–805.
29 K. Mathew, R. Sundararaman, K. Letchworth-Weaver, T. A. Arias and R. G. Hennig, J. Chem. Phys., 2014,140, 084106.
30 M. Fishman, H. L. Zhuang, K. Mathew, W. Dirschka and R. G. Hennig, Phys. Rev. B, 2013,87, 245402.
31 M. Faheem, S. Suthirakun and A. Heyden, J. Phys. Chem. C,
2012,116, 22458–22462.
32 M. Garcia-Rates and N. Lopez, J. Chem. Theory Comput.,
2016,12, 1331–1341.
33 S. Behtash, J. Lu, O. Mamun, C. T. Williams, J. R. Monnier and A. Heyden, J. Phys. Chem. C, 2016,120, 2724–2736.
34 S. Behtash, J. Lu, E. Walker, O. Mamun and A. Heyden, J. Catal., 2016,333, 171–183.
35 M. Faheem, M. Saleheen, J. Lu and A. Heyden, Catal. Sci. Technol., 2016,6, 8242–8256.
36 S. N. Steinmann, C. Michel, R. Schwiedernoch, M. Wu and P. Sautet, J. Catal, 2016,343, 240.
37 S. K. Iyemperumal and N. A. Deskins, ChemPhysChem, 2017,
18, 2171–2190.
38 J. R. Pliego and J. M. Riveros, J. Phys. Chem. A, 2001,105,
7241–7247.
39 R. B. Sunoj and M. Anand, Phys. Chem. Chem. Phys., 2012,
14, 12715–12736.
40 D. D. Hibbitts, B. T. Loveless, M. Neurock and E. Iglesia, Angew. Chem. Int. Ed., 2013,52, 12273–12278.
41 C. Michel, J. Zaffran, A. M. Ruppert, J. Matras-Michalska, M. Jedrzejczyk, J. Grams and P. Sautet, Chem. Commun.,
2014,50, 12450–12453.
42 M. Garcia-Rates, R. Garcia-Muelas and N. Lopez, J. Phys. Chem. C, 2017,121, 13803–13809.
43 C. Michel, F. Auneau, F. Delbecq and P. Sautet, ACS Catal., 2011,1, 1430–1440.
44 J. Zaffran, C. Michel, F. Delbecq and P. Sautet, Catal. Sci. Tech-nol., 2016,6, 6615–6624.
45 S. Raimondeau and D. Vlachos, Chemical Engineering Journal, 2002,90, 3–23.
46 M. Salciccioli, M. Stamatakis, S. Caratzoulas and D. G. Vla-chos, Chem. Eng. Sci., 2011,66, 4319–4355.
47 M. M. Montemore and J. W. Medlin, Catal. Sci. Technol., 2014,
4, 3748–3761.
48 V. Vorotnikov, S. Wang and D. G. Vlachos, Industrial & Engi-neering Chemistry Research, 2014,53, 11929–11938.
49 G. H. Gu, B. Schweitzer, C. Michel, S. N. Steinmann, P. Sautet and D. G. Vlachos, J. Phys. Chem. C, 2017,121, 21510–21519.
50 R. P. Bell, Proceedings of the Royal Society of London A: Math-ematical, Physical and Engineering Sciences, 1936,154, 414–
429.
51 J. N. Bronsted, Chem. Rev., 1928,5, 231–338.
52 M. G. Evans and M. Polanyi, Trans. Faraday Soc., 1937,33,
448–452.
53 S. Rangarajan, R. R. O. Brydon, A. Bhan and P. Daoutidis, Green Chem., 2014,16, 813–823.
54 T. Bligaard, J. Nørskov, S. Dahl, J. Matthiesen, C. Christensen and J. Sehested, J. Catal., 2004,224, 206 – 217.
55 P. Ferrin, D. Simonetti, S. Kandoi, E. Kunkes, J. A. Dumesic, J. K. Nørskov and M. Mavrikakis, J. Am. Chem. Soc., 2009,
131, 5809–5815.
56 S. Wang, V. Petzold, V. Tripkovic, J. Kleis, J. G. Howalt, E. Sku-lason, E. M. Fernandez, B. Hvolak, G. Jones, A. Toftelund, H. Falsig, M. Bjorketun, F. Studt, F. Abild-Pedersen, J. Ross-meisl, J. K. Norskov and T. Bligaard, Phys. Chem. Chem. Phys.,
2011,13, 20760–20765.
57 R. García-Muelas, Q. Li and N. López, ACS Catal., 2015, 5,
1027–1036.
58 J. E. Sutton and D. G. Vlachos, Industrial & Engineering Chem-istry Research, 2015,54, 4213–4225.
Int. Ed., 2009,48, 8978–8980.
60 S. Wang, V. Vorotnikov, J. E. Sutton and D. G. Vlachos, ACS Catalysis, 2014,4, 604–612.
61 J. Zaffran, C. Michel, F. Delbecq and P. Sautet, The Journal of Physical Chemistry C, 2015,119, 12988–12998.
62 Z.-P. Liu and P. Hu, The Journal of Chemical Physics, 2001,
115, 4977–4980.
63 A. Michaelides, Z.-P. Liu, C. J. Zhang, A. Alavi, D. A. King and P. Hu, Journal of the American Chemical Society, 2003,125,
3704–3705.
64 J. Zaffran, C. Michel, F. Auneau, F. Delbecq and P. Sautet, ACS Catal., 2014,4, 464–468.
65 R. D. Cortright, R. R. Davda and J. A. Dumesic, Nature, 2002,
418, 964–967.
66 G. Kresse and J. Hafner, Phys. Rev. B, 1993,47, 558–561.
67 G. Kresse and J. Hafner, Phys. Rev. B, 1994,49, 14251–14269.
68 G. Kresse and J. Furthmüller, Computational Materials Science, 1996,6, 15 – 50.
69 G. Kresse and J. Furthmüller, Phys. Rev. B, 1996,54, 11169–
11186.
70 P. E. Blöchl, Phys. Rev. B, 1994,50, 17953–17979.
71 G. Kresse and D. Joubert, Phys. Rev. B, 1999,59, 1758–1775.
72 J. P. Perdew, K. Burke and M. Ernzerhof, Phys. Rev. Lett., 1996,
77, 3865–3868.
73 J. P. Perdew, K. Burke and M. Ernzerhof, Phys. Rev. Lett., 1997,
78, 1396–1396.
74 S. N. Steinmann and C. Corminboeuf, J. Chem. Phys., 2011,
134, 044117.
75 S. N. Steinmann and C. Corminboeuf, J. Chem. Theory Com-put., 2011,7, 3567–3577.
76 H. J. Monkhorst and J. D. Pack, Phys. Rev. B, 1976,13, 5188–
5192.
77 G. Henkelman and H. Jónsson, The Journal of Chemical Physics, 1999,111, 7010–7022.
78 E. Vignola, S. N. Steinmann, A. Al Farra, B. D. Vandegehuchte, D. Curulla and P. Sautet, ACS Catal., 2018,8, 1662–1671.
79 J. E. Sutton and D. G. Vlachos, ACS Catal., 2012,2, 1624–
1634.
80 C. Michel, F. Goeltl and P. Sautet, Phys. Chem. Chem. Phys.,