HAL Id: insu-00442828
https://hal-insu.archives-ouvertes.fr/insu-00442828
Submitted on 2 Nov 2011
HAL is a multi-disciplinary open access archive for the deposit and dissemination of sci-entific research documents, whether they are pub-lished or not. The documents may come from teaching and research institutions in France or abroad, or from public or private research centers.
L’archive ouverte pluridisciplinaire HAL, est destinée au dépôt et à la diffusion de documents scientifiques de niveau recherche, publiés ou non, émanant des établissements d’enseignement et de recherche français ou étrangers, des laboratoires publics ou privés.
Experimental constraints on the crystallization of
natrocarbonatitic lava flows
Hannes B. Mattsson, Luca Caricchi
To cite this version:
Hannes B. Mattsson, Luca Caricchi. Experimental constraints on the crystallization of natrocar-bonatitic lava flows. Bulletin of Volcanology / Bull Volcanic Eruptions, 2009, 71, pp.1179-1193. �10.1007/s00445-009-0288-4�. �insu-00442828�
Experimental constraints on the crystallization of natrocarbonatitic lava flows Hannes B. Mattsson1 and Luca Caricchi1, 2
(1) Institute for Mineralogy and Petrology, Swiss Federal Institute of Technology (ETH Zürich), Clausiusstrasse 25, 8092 Zürich, Switzerland
(2) CNRS-Orleans, UMR 6113 CNRS—Universite d’Orleans, 1A rue de la Ferollerie, 45071 Orleans Cedex, France
Abstract
Natrocarbonatitic magmas are characterized by their extremely low viscosities and fast elemental diffusion, and as a consequence of this, their chemistry and crystallinity can change significantly during residence in shallow reservoirs or even due to cooling during lava flow emplacement. Here, we present the results of a series of crystallization experiments conducted at 1-atm confining pressure and in a temperature range between 630°C and 300°C. The
experiments were set up to characterize the chemistry and growth processes of the phenocryst phases present in natrocarbonatites. The results are applicable to (1) processes occurring during residence in shallow magma reservoirs and/or (2) during lava flow emplacement. We show that during crystallization of natrocarbonatites at atmospheric pressure, gregoryite is the first mineral to crystallize at 630°C, followed by nyerereite at 595°C. Crystal size
distributions of the gregoryites show that the crystals grow rapidly by textural coarsening (i.e., Ostwald ripening). As the crystallization is a continuous process at this pressure, the
composition of the residual melt changes in response to the crystallization. However, the experiments also show that individual crystals completely reequilibrate with the changes in melt composition in as little time as <11 min. We therefore conclude that crystallization and diffusion are extremely fast processes in the natrocarbonatitic system and that the measured chemical variations in phenocrysts from Oldoinyo Lengai can be explained by different cooling histories. Finally, we model the rheological control on the emplacement of highly crystallized natrocarbonatitic lavas at Oldoinyo Lengai.
Keywords Natrocarbonatite - Oldoinyo Lengai - Crystal size distributions - Textural coarsening - Cooling - Rheology
Introduction
Between the years 1983 and 2007, natrocarbonatitic lava flows were almost continuously erupted from the summit crater of the Oldoinyo Lengai volcano in northern Tanzania. Typically, the volumes of individual lava flows are small (e.g., a few tens to a few hundred m3) with some significant exceptions such as the 1993 Chaos Crags flow (1.5 × 10⁵ m3; Dawson et al. 1994) and the March–April 2006 lavas (9.2 × 10⁵ m3; Kervyn et al. 2008). The crystal content of the lavas shows a large variation, ranging from nearly aphyric in filter-pressed material originating from fractures in more voluminous flows (0 vol.% phenocrysts and 16% microphenocrysts; Dawson et al. 1990), to more than 85 vol.% phenocrysts in the June 1993 and March–April 2006 eruptions (Dawson et al. 1994; Mattsson and Vuorinen
2009). Such a large variation in crystal content will undoubtedly affect the rheology and
emplacement dynamics of the lava flows (cf. Norton and Pinkerton 1997).
Laboratory-based measurements of the apparent viscosities (using a rotating viscometer) range from 0.15 to 85 Pa s, with the highest viscosities measured in crystal-rich samples (up
to 62 vol.% crystals; Norton and Pinkerton 1997). Similar values have also been documented in the field using a rotating vane viscometer (0.3 to 120 Pa s; Dawson et al. 1990; Pinkerton et al. 1995). However, there is one exception that stands out from this generally low viscosity of natrocarbonatitic lavas: the clinkery, aa-type, Chaos Crags lava flow that was erupted in 1993, for which the viscosity was estimated using the Jeffreys equation to be comparable to that of rhyolitic magmas (e.g., 107–108 Pa s; Dawson et al. 1994). It is difficult to reconcile rapid emplacement of crystal-rich lavas with an estimated viscosity that are five to six orders of magnitude higher than ever measured in the field and/or in laboratory experiments (Dawson et al. 1995b; Pinkerton et al. 1995; Norton and Pinkerton 1997). However, the extremely low melt viscosities and high diffusion rates that characterize natrocarbonatitic magmas (Gaillard et al. 2008) could favor rapid crystallization during emplacement of lava flows (e.g., the crystal content of a solidified lava flow is not identical to the crystal content during emplacement). Previous experimental studies focused on the crystallization of
natrocarbonatitic magmas have been conducted at 100 and 20 MPa confining pressure
(Cooper et al. 1975; Petibon et al. 1998). However, rapid magma drainage and formation of a pit crater at Oldoinyo Lengai following the March–April 2006 eruption shows that a
significant volume of natrocarbonatitic magma has been stored at shallow levels beneath the hornitos inside the summit crater (i.e., the collapse exposed a network of several small interconnected magma reservoirs located at 0–40 m depth; Kervyn et al. 2008). Therefore, experiments conducted at atmospheric pressures are essential in order to understand the origin and evolution of natrocarbonatitic magmas at Oldoinyo Lengai.
In this study, we quantify the effect of cooling at different rates on the crystallization of natrocarbonatitic magmas at atmospheric pressure using experimentally generated crystal-size distributions in combination with mineral chemistry. In addition to this, we also investigate the effect of quenching at different temperatures on the growth and composition of the main phenocryst phases. The results provide insights into the crystallization process during ascent, shallow storage, and emplacement of natrocarbonatitic magmas/lavas. Finally, we estimate the effects of crystallization on the rheology of natrocarbonatitic lava flows. We will show that the processes of crystallization and elemental diffusion in natrocarbonatitic magmas are very rapid and that our experimental results can explain the compositional variation measured in Oldoinyo Lengai lavas by different cooling histories.
Petrography of natrocarbonatitic lavas
The petrography of natrocarbonatitic lavas has been well described in literature (Gittins and McKie 1980; Keller and Krafft 1990; Peterson 1990; Dawson et al. 1995a; Mitchell 1997,
2006). The lavas are generally crystal rich (30–85 vol.%; Dawson et al. 1990, 1994; Mattsson
and Vuorinen 2009), although near-aphyric varieties also occur (Dawson et al. 1995b). The main phenocryst phases in the lavas are the alkali carbonates nyerereite and gregoryite (Na2Ca[CO3]2 and [Na,Ca x ,K]2 − x CO3 respectively; McKie and Frankis 1977; Zaitsev et al.
2008). The groundmass is predominantly composed of variable amounts of sylvite, fluorite,
gregoryite, and alabandite (Peterson 1990; Mitchell 1997, 2006).
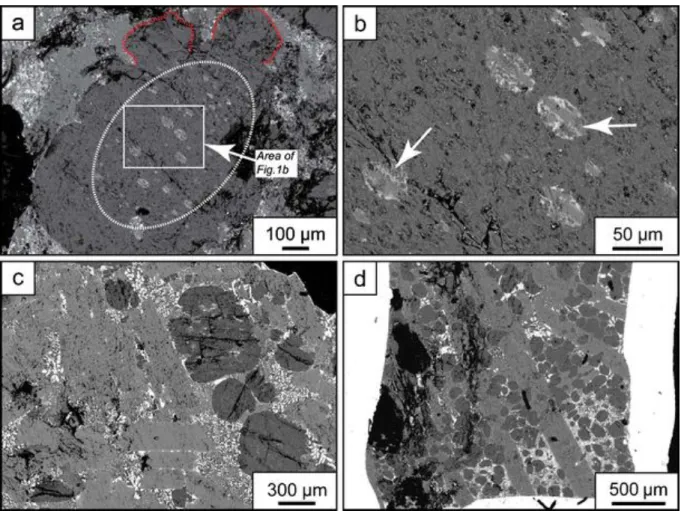
Gregoryite occurs either as well-rounded to oval single crystals, or as bulbous flower-shaped crystal aggregates (Fig. 1 a). The gregoryite crystals frequently contain an inner zone rich in various types of inclusions and an outer rim free of inclusions. In lava samples collected in June 2007, the inclusions form nearly concentric rings in the mineral and consist primarily of nyerereite and sylvite together with minor gregoryite (Fig. 1a, b). This mineral assemblage is similar to other inclusions observed in gregoryite crystals (Mitchell 2006). The outer rims of
the gregoryites are generally more sodium rich compared to the cores (Peterson 1990; Zaitsev et al. 2008).
Fig. 1 Backscattered electron images of natrocarbonatites. a Bulbous irregularly shaped gregoryite crystal with an ellipsoidal inclusion-rich core and inclusion-free rims. b Magnification of a showing that the inclusions are predominantly composed of nyerereite laths (indicated by arrows) together with minor sylvite, fluorite, and gregoryite. c Typical texture of a small pahoehoe lava flow with phenocrysts of gregoryite (round) and nyerereite (lath shaped). d Typical texture produced in the experimental charges at slow cooling rates. Note that the dominating phenocryst phases and the texture of the groundmass between natural and experimental sample are in good agreement, although the crystal sizes differ
Nyerereite crystals form euhedral to subhedral laths, which commonly do not contain any inclusions. The orientations of laths are often subparallel to the direction of flow. Overall, the textures of both the phenocryst phases and the groundmass in natural lava samples from Oldoinyo Lengai (Fig. 1c) are very similar to those produced experimentally (Fig. 1d), although the absolute sizes of the phenocrysts differ.
Materials and methods
Experimental starting material and setup
As starting material for the crystallization experiments, we used a large natural sample
collected from the active lava lake of Oldoinyo Lengai in June 2007. The sample was crushed and ground in an agate mortar, until a homogeneous fine-grained (10–15 μm size) powder was produced.
The starting material (~0.2 g/experimental run) was loaded in Ag70Pd30 capsules with a 4-mm
internal diameter. The capsules were tightly closed, but not welded, in order to reproduce the conditions of emplacement of lavas at the surface. The experimental charges were inserted in a vertical furnace equipped with a fast quench device. The temperature was controlled
automatically in all the experiments using a B-type thermocouple placed at the top end of the capsules. All experiments were terminated by activating the quench device, which drops the sample from the hot zone into water. After quenching, the capsules were immediately removed from the water to prevent alteration of the experimental charges. No water was entering the capsules during the quench procedure.
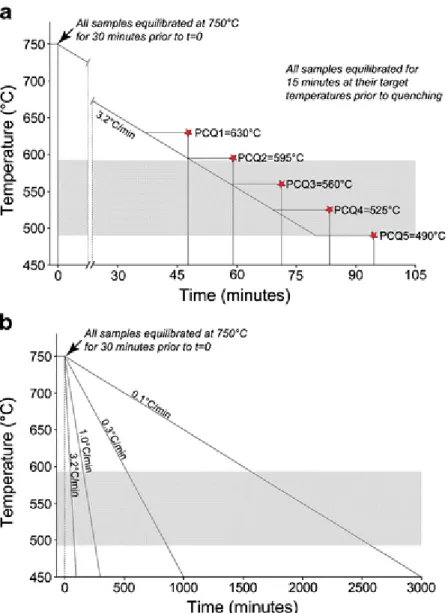
The experimental charges were kept for 30 min at 750°C (i.e., above the liquidus of
natrocarbonatitic melts; Cooper et al. 1975; Peterson 1990) to homogenize and equilibrate the starting material before controlled cooling was initiated. Two sets of experiments were
conducted: In the first, five samples were cooled at a fixed rate of 3.2°C/min and quenched at different final temperatures (ranging from 630°C to 490°C; Fig. 2a). Prior to quenching, the samples were kept at the target temperatures for 15 min to allow for equilibration. In the second set of experiments, four samples were kept at 750°C for 30 min and subsequently cooled at different cooling rates (varying between 3.2°C/min and 0.1°C/min; Fig. 2b) and quenched once the target temperature of 300°C was reached.
Fig. 2 Cooling curves for the two different sets of experiments. a The samples are cooled at a fixed rate (3.2°C/min) and quenched at different target temperatures. b The samples are cooled at different rates from 750°C to 300°C. Shaded fields represent the span of eruption temperatures of natrocarbonatites measured in the field (Krafft and Keller 1989; Dawson et al. 1990; Pinkerton et al. 1995)
Analytical methods
The chemical compositions of the phenocryst phases (e.g., gregoryite and nyerereite) and the average composition of the matrix (measured with defocused beam), present in the
experimental charges, were analyzed using a Jeol-JXA 8200 electron microprobe. In order to minimize the loss of volatile elements (e.g., sodium) during the analyses, 15 kV acceleration voltage, 5 nA current, and a defocused 20-μm-wide beam diameter and counting times between 10 and 20 s were set as analytical conditions for both crystals and groundmass. Measurements of crystal size distributions (CSDs)
The textures of the experimental products were photographed using backscattered electron images, from which the outlines of individual crystals were digitized. Morphological parameters of crystal habits were estimated using the crystal size distribution (CSD)slice
spreadsheet (Morgan and Jerram 2006), in which the digitized measurements are compared with a database of shape curves for random sections through 703 different crystal habits. The spreadsheet returns a best fit for crystal habit based on regression calculations and fitting to the database. Using the morphological parameters (long–intermediate–short axis) retrieved from the CSDslice spreadsheet, the crystal-size distributions of the samples were calculated using the CSDCorrections 1.38 software (for which the theoretical basis can be found in Higgins 2000, 2002a and references therein).
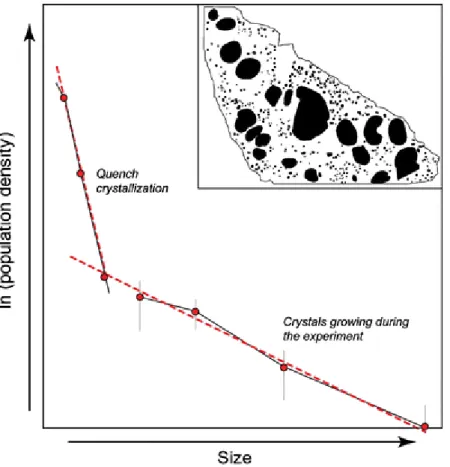
A potential problem with the CSD analyses of the experimental products is that
natrocarbonatitic melts are very difficult to quench without inducing crystallization. This is illustrated by an experimental reference sample quenched at 580°C in which two different populations of gregoryite can be identified (Fig. 3): (1) a population with high nucleation density and small crystal sizes generated by quench crystallization and (2) a population of larger crystals that grew during the experiment and were characterized by lower nucleation density and lesser slope in the CSD plot. Thus, in order to avoid incorporation of erroneous CSD data generated in the quenching process, we excluded crystals less than 25 μm in size as these are likely to be an artifact of quenching.
Fig. 3 Schematic plot of crystal size distribution of gregoryites in an experimental charge quenched at 580°C. Note that the sample has two distinct crystal populations (see also the outlines of individual crystals in the inset), one population that grew during the experiment (larger crystals) and one that was generated by quench-crystallization (smaller crystals)
Results
Textures in the experimental charges
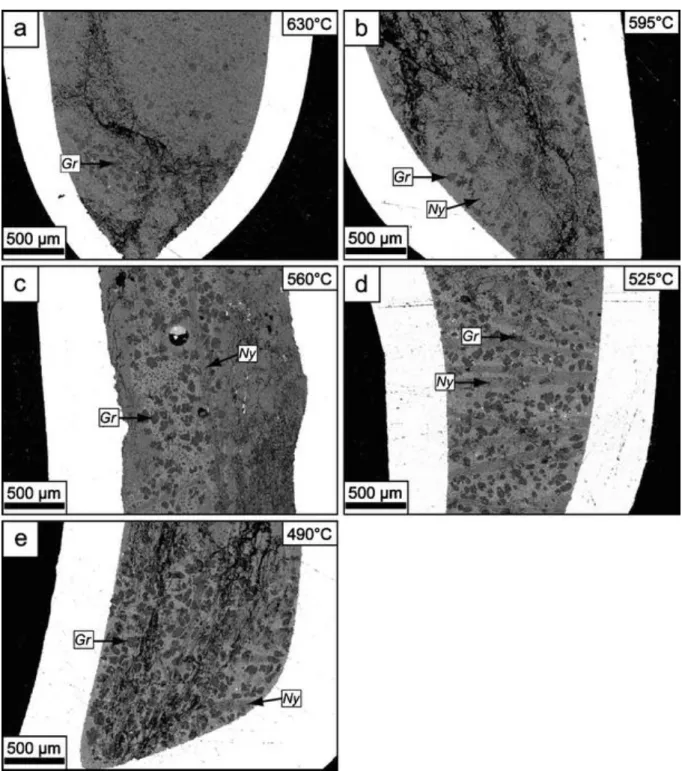
Five experiments were performed in which the temperature decrease was fixed at a rate of 3.2°C/min and allowing cooling from 750°C to the different target temperatures ranging from 630°C to 490°C (Figs. 2a and 4).
In the sample quenched at 630°C, gregoryite is the only phenocryst phase present together with a rather homogeneous grayish groundmass with evenly dispersed microphenocrysts of gregoryite generated during the quenching process (Fig. 4a). The large crystals grown during the experiment have all accumulated near the bottom of the capsule. Starting at 595°C, nyerereite becomes stable and crystallizes together with gregoryite. In the 595°C sample, the nyerereites are small and thin (Fig. 4b) but rapidly grow to large sizes with decreasing quench temperature (reaching more than 2 mm in length in some cases; Fig. 4c–e). Four experiments were performed in which the samples were cooled at different rates from 750°C to 300°C and then quenched (Figs. 2b and 5).
Fig. 4 Backscattered electron images showing the experimental charges cooled at a fixed rate of 3.2°C/min from 750°C to different target temperatures (Fig. 2a). a PQ1 quenched at 630°C, b PQ2 quenched at 595°C, c PQ3 quenched at 560°C, d PQ4 quenched at 535°C, and e PQ5 quenched at 490°C. Note that gregoryite is present in all samples, whereas nyerereite first appears as a phenocryst phase in PQ2 (i.e., 595°C). Also note that gregoryites in a have accumulated near the bottom of the capsule
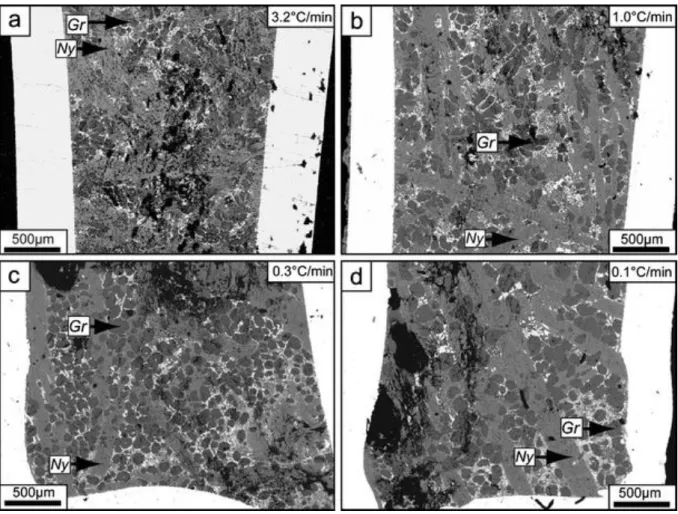
Fig. 5 Backscattered electron images of textures in the experimental charges cooled at different rates: a 3.2°C/min, b 1.0°C/min, c 0.3°C/min, and d 0.1°C/min. Rapidly cooled samples generally display more chaotic textures whereas slowly cooled samples show more distinct crystal shapes. Also note that the samples are quenched at the same target temperature (i.e., 300°C), and they all show a well-crystallized groundmass (white–gray intergrowths of predominantly sylvite and gregoryite)
In the most rapidly cooled experiment (3.2°C/min; Fig. 5a), the texture is rather chaotic, which in part is due to the difficulty in polishing the experimental charges but mainly an effect of the fast cooling rate. Overall, the samples show that the sizes of both gregoryites and nyerereites increase as the cooling rate is decreased (Fig. 5b–d). In addition to this, the crystal shapes become more distinct as the crystals are allowed to grow for longer time. In most samples, gregoryite crystals are near circular in shape; however, an anomaly is produced by the sample cooled at 1.0°C/min in which gregoryites tend to form bulbous, ―flower-like‖, shapes (Fig. 5b).
When comparing the textures generated in two different sets of experiments, one of the most noticeable differences is the texture of the groundmass. While the experiments quenched at different target temperature have a relatively homogenous groundmass (Fig. 4), the
experiments cooled to 300°C invariably show the presence of complex intergrowths of carbonate–alkali halides, dominated by sylvite and fluorite, together with microcrystalline varieties of gregoryite and nyerereite (Fig. 5; and identical to the groundmass textures in natural lavas as described by Peterson 1990 and Mitchell 1997, 2006). It is also evident from the textures present in the experimental samples (Figs. 4 and 5) that the growth of the
nyerereite crystals is much faster than for gregoryites at atmospheric pressure and also that nyerereites grow to larger sizes than the gregoryites.
Chemistry of the experimental charges
At 630°C, gregoryite is the only phenocryst phase present (PQ1, Fig. 4a), and gregoryite is later joined by nyerereite at temperatures lower or equal to 595°C (PQ2, Fig. 4b–e). This is also reflected in the compositions of the gregoryites and the residual matrix, which show systematic variations as function of the quench temperature (Fig. 6; Table 1).
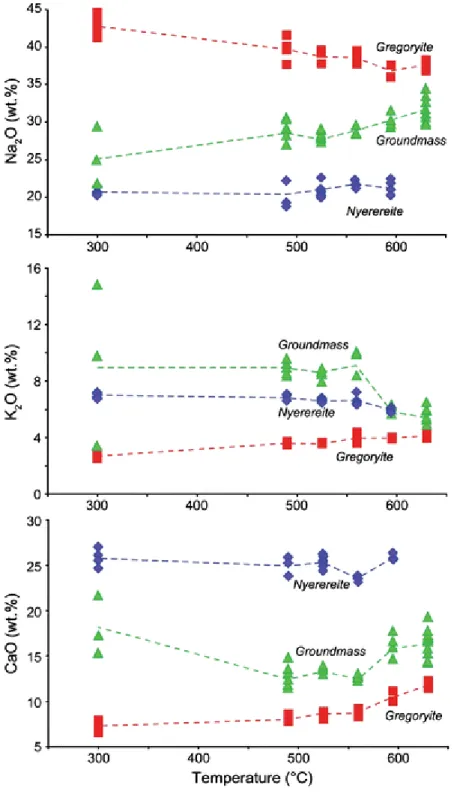
Fig. 6 Chemical variability of gregoryite, nyerereite, and groundmass compositions as a function of temperature in the experimental charges. Note that the gregoryite and the groundmass show specular trends over this temperature interval while nyerereite only show minor variation
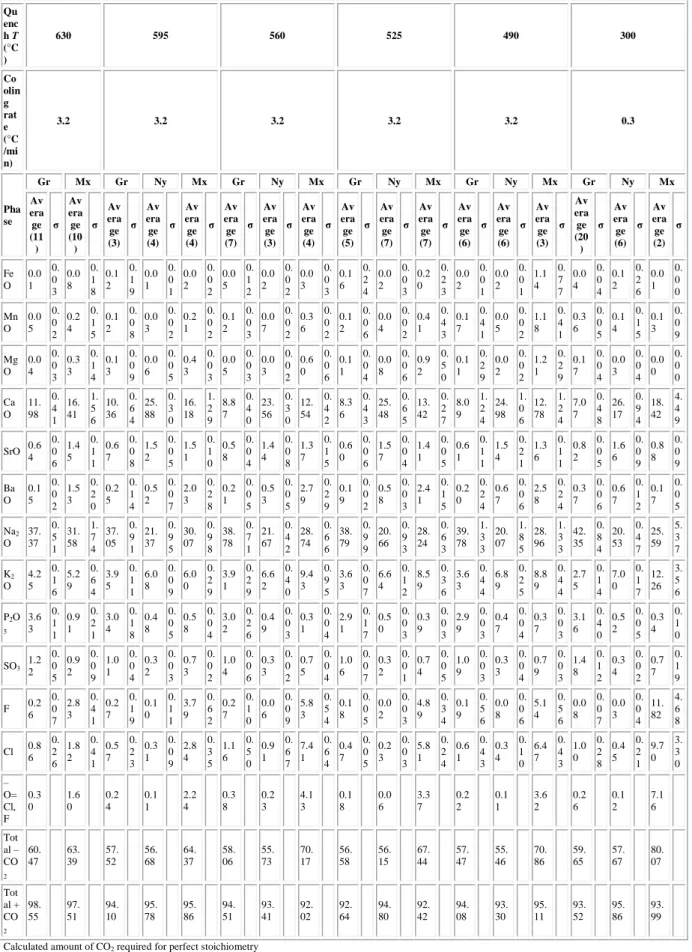
Table 1 Average composition of the main phases present in the experimental charges Qu enc h T (°C ) 630 595 560 525 490 300 Co olin g rat e (°C /mi n) 3.2 3.2 3.2 3.2 3.2 0.3 Pha se Gr Mx Gr Ny Mx Gr Ny Mx Gr Ny Mx Gr Ny Mx Gr Ny Mx Av era ge (11 ) σ Av era ge (10 ) σ Av era ge (3) σ Av era ge (4) σ Av era ge (4) σ Av era ge (7) σ Av era ge (3) σ Av era ge (4) σ Av era ge (5) σ Av era ge (7) σ Av era ge (7) σ Av era ge (6) σ Av era ge (6) σ Av era ge (3) σ Av era ge (20 ) σ Av era ge (6) σ Av era ge (2) σ Fe O 0.0 1 0. 0 3 0.0 8 0. 1 8 0.1 2 0. 1 9 0.0 1 0. 0 1 0.0 2 0. 0 2 0.0 5 0. 1 2 0.0 2 0. 0 2 0.0 3 0. 0 3 0.1 6 0. 2 4 0.0 2 0. 0 3 0.2 0 0. 2 3 0.0 2 0. 0 1 0.0 2 0. 0 1 1.1 4 0. 7 7 0.0 4 0. 0 4 0.1 2 0. 2 6 0.0 1 0. 0 0 Mn O 0.0 5 0. 0 2 0.2 4 0. 1 5 0.1 2 0. 0 8 0.0 3 0. 0 2 0.2 1 0. 0 2 0.1 2 0. 0 3 0.0 7 0. 0 2 0.3 6 0. 0 2 0.1 2 0. 0 6 0.0 4 0. 0 2 0.4 1 0. 4 3 0.1 7 0. 4 1 0.0 5 0. 0 2 1.1 8 0. 4 1 0.3 6 0. 0 5 0.1 4 0. 1 5 0.1 3 0. 0 9 Mg O 0.0 4 0. 0 3 0.3 3 0. 1 4 0.1 3 0. 0 9 0.0 6 0. 0 5 0.4 3 0. 0 3 0.0 5 0. 0 3 0.0 3 0. 0 2 0.6 0 0. 0 6 0.1 1 0. 0 4 0.0 8 0. 0 6 0.9 2 0. 5 0 0.1 1 0. 2 9 0.0 2 0. 0 2 1.2 1 0. 2 9 0.1 7 0. 0 4 0.0 3 0. 0 4 0.0 0 0. 0 0 Ca O 11. 98 0. 4 1 16. 41 1. 5 6 10. 36 0. 6 4 25. 88 0. 3 0 16. 18 1. 2 9 8.8 7 0. 4 0 23. 56 0. 3 0 12. 54 0. 4 2 8.3 6 0. 4 3 25. 48 0. 6 5 13. 42 0. 2 7 8.0 9 1. 2 4 24. 98 1. 0 6 12. 78 1. 2 4 7.0 7 0. 4 8 26. 17 0. 9 4 18. 42 4. 4 9 SrO 0.6 4 0. 0 6 1.4 5 0. 1 1 0.6 7 0. 0 8 1.5 2 0. 0 5 1.5 1 0. 1 0 0.5 8 0. 0 4 1.4 4 0. 0 8 1.3 7 0. 1 5 0.6 0 0. 0 6 1.5 7 0. 0 4 1.4 1 0. 0 5 0.6 1 0. 1 1 1.5 4 0. 2 1 1.3 6 0. 1 1 0.8 2 0. 0 5 1.6 6 0. 0 9 0.8 8 0. 0 9 Ba O 0.1 5 0. 0 2 1.5 3 0. 2 0 0.2 5 0. 1 4 0.5 2 0. 0 7 2.0 3 0. 2 8 0.2 1 0. 0 5 0.5 3 0. 0 5 2.7 9 0. 2 9 0.1 9 0. 0 2 0.5 8 0. 0 3 2.4 1 0. 1 5 0.2 0 0. 2 4 0.6 7 0. 0 6 2.5 8 0. 2 4 0.3 7 0. 0 6 0.6 7 0. 1 2 0.1 7 0. 0 5 Na2 O 37. 37 0. 5 1 31. 58 1. 7 4 37. 05 0. 9 1 21. 37 0. 9 5 30. 07 0. 9 8 38. 78 0. 7 1 21. 67 0. 4 2 28. 74 0. 6 6 38. 79 0. 9 9 20. 66 0. 9 3 28. 24 0. 6 3 39. 78 1. 3 3 20. 07 1. 8 5 28. 96 1. 3 3 42. 35 0. 8 4 20. 53 0. 4 7 25. 59 5. 3 7 K2 O 4.2 5 0. 1 6 5.2 9 0. 6 4 3.9 5 0. 1 1 6.0 8 0. 0 9 6.0 0 0. 2 9 3.9 1 0. 2 9 6.6 2 0. 4 0 9.4 3 0. 9 5 3.6 3 0. 0 7 6.6 4 0. 1 2 8.5 9 0. 3 6 3.6 3 0. 4 4 6.8 9 0. 2 5 8.8 9 0. 4 4 2.7 5 0. 1 4 7.0 0 0. 1 7 12. 26 3. 5 6 P2O 5 3.6 3 0. 1 1 0.9 1 0. 2 1 3.0 4 0. 1 8 0.4 8 0. 0 5 0.5 8 0. 0 4 3.0 2 0. 2 6 0.4 9 0. 0 3 0.3 1 0. 0 4 2.9 1 0. 1 7 0.5 0 0. 0 3 0.3 9 0. 0 3 2.9 9 0. 0 3 0.4 7 0. 0 4 0.3 7 0. 0 3 3.1 6 0. 4 0 0.5 2 0. 0 5 0.3 4 0. 1 0 SO3 1.2 2 0. 0 5 0.9 2 0. 0 9 1.0 1 0. 0 4 0.3 2 0. 0 3 0.7 3 0. 0 2 1.0 4 0. 0 6 0.3 3 0. 0 2 0.7 5 0. 0 4 1.0 6 0. 0 7 0.3 2 0. 0 1 0.7 4 0. 0 5 1.0 9 0. 0 3 0.3 3 0. 0 4 0.7 9 0. 0 3 1.4 8 0. 1 2 0.3 4 0. 0 2 0.7 7 0. 1 9 F 0.2 6 0. 0 7 2.8 3 0. 4 1 0.2 7 0. 1 9 0.1 0 0. 1 1 3.7 9 0. 6 2 0.2 7 0. 1 0 0.0 6 0. 0 9 5.8 3 0. 5 4 0.1 8 0. 0 5 0.0 2 0. 0 3 4.8 9 0. 3 4 0.1 9 0. 5 6 0.0 8 0. 0 6 5.1 4 0. 5 6 0.0 8 0. 0 7 0.0 3 0. 0 4 11. 82 4. 6 8 Cl 0.8 6 0. 2 6 1.8 2 0. 4 1 0.5 7 0. 2 3 0.3 1 0. 0 9 2.8 4 0. 3 5 1.1 6 0. 5 0 0.9 1 0. 6 7 7.4 1 0. 6 4 0.4 7 0. 0 5 0.2 3 0. 0 3 5.8 1 0. 2 4 0.6 1 0. 4 3 0.3 4 0. 1 0 6.4 7 0. 4 3 1.0 0 0. 2 8 0.4 5 0. 2 1 9.7 0 3. 3 0 – O= Cl, F 0.3 0 1.6 0 0.2 4 0.1 1 2.2 4 0.3 8 0.2 3 4.1 3 0.1 8 0.0 6 3.3 7 0.2 2 0.1 1 3.6 2 0.2 6 0.1 2 7.1 6 Tot al – CO 2 60. 47 63. 39 57. 52 56. 68 64. 37 58. 06 55. 73 70. 17 56. 58 56. 15 67. 44 57. 47 55. 46 70. 86 59. 65 57. 67 80. 07 Tot al + CO 2 98. 55 97. 51 94. 10 95. 78 95. 86 94. 51 93. 41 92. 02 92. 64 94. 80 92. 42 94. 08 93. 30 95. 11 93. 52 95. 86 93. 99 Calculated amount of CO2 required for perfect stoichiometry
With decreasing temperature, the Na2O content of gregoryites increase (from 37.4 to
42.4 wt.%), while K2O and CaO decrease from about 4.3 to 2.6 wt.% and about 12.0 to
7.1 wt.%, respectively. The average composition of the groundmass display systematic variation specular to that of the gregoryites, i.e., Na2O decreases with increasing temperature
(from 31.6 to 25.3 wt.%) and K2O and CaO increase from 5.3 to 9.3 wt.% and 16.4 to
18.0 wt.%, respectively (Fig. 6; Table 1). The nyerereites, on the other hand, show some scatter but no clear systematic trends with decreasing temperature for Na2O, K2O, or CaO.
A certain degree of variability in the chemical analyses is associated with the difficulty in the polishing of the samples and to the general instability of the carbonate minerals during microprobe analyses (this is particularly affecting the gregoryite analyses, see also Peterson
1990). Also, some variability in the groundmass composition is expected as the analyses are
not conducted on a homogeneous glass but microcrystalline material.
Backscattered electron images of the experimental charges do not show any visible zoning in the individual crystals, and no chemical differences could be found when analyzing core and rim compositions of the experimentally produced mineral phases.
Crystal size distributions of gregoryite
Our experimental samples only contain a few nyerereite crystals in each capsule;
consequently, the nyerereites were omitted from CSD analyses as their abundance is much too low to generate statistically significant distributions.
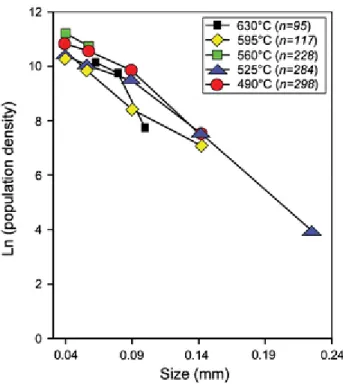
The gregoryite crystals generated at different quenching temperatures show a weak apparent tendency to develop larger crystals when cooled to lower temperatures (Fig. 4). However, when plotted as CSD diagrams, the gregoryites grown in the quenched experimental charges only display minor variation (Fig. 7). All quenched samples have the same overall trend and slope (average intercept is occurring at approximately 11, and the slope of the line is roughly −29). The time difference between the sample quenched at 630°C and the sample quenched at 490°C is only 44 min. The individual error for the analyses is larger than the measured
variation, suggesting that the crystal population do not change considerably over the short time span used in the experiments.
Fig. 7 Crystal size distributions for gregoryites in the experimental charges cooled at a fixed rate of 3.2°C/min and quenched at different target temperatures (Figs. 2a and 4). Note that the variations between samples quenched at the different target temperatures are minor and that the overall crystal size distributions are almost linear. n denotes the number of gregoryite crystals used for each analysis
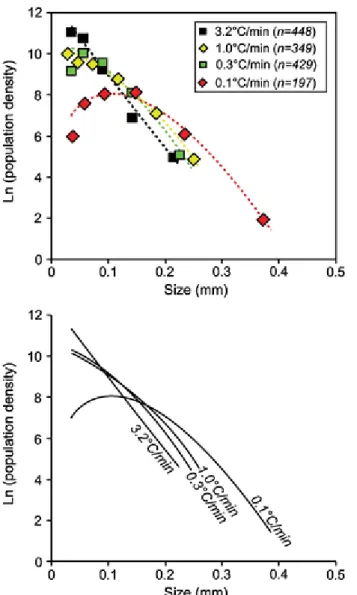
In the CSDs for the gregoryites grown at different cooling rates, there is a clear systematic change in slope going from the most rapidly cooled sample to the slowest cooled (3.2°C/min to 0.1°C/min, respectively; Fig. 8). The sample cooled at 3.2°C show a near-linear trend (intercept = 12.5 and slope = −35), whereas the other samples display more flattened trends (Fig. 8). The overall trend is that as the cooling rate is decreased, the total amount of small crystals diminishes and larger crystals become more abundant.
Fig. 8 Crystal size distributions for gregoryites in the experimental charges cooled at different rates from 750°C to 300°C at different cooling rates (Fig. 2b). Note that as the cooling rate decreases, the small crystals are consumed on the expense of the larger crystals. n denotes the number of gregoryite crystals used for each analysis
The sample cooled at 1.0°C/min contains bulbous, ―flower-shaped‖, gregoryites (Fig. 5b). For this sample, the gregoryite forming the bulbous clusters were digitized and analyzed as
several individual smaller crystals rather than as single cluster (following Jerram et al. 2003). Discussion
Phase equilibria: implications for magma ascent
Previous experimental work has shown that nyerereite is the first mineral on the liquidus of natrocarbonatitic magmas at 100 and 20 MPa (Cooper et al. 1975; Gittins and McKie 1980; Petibon et al. 1998). However, these experimental results also clearly indicate that as pressure is reduced, the stability field of gregoryite expands to higher temperature.
Our experiments show that gregoryite is the first mineral to crystallize at atmospheric pressure (starting just above 630°C and is later joined by nyerereite at 595°C; Fig. 4a, b). A common feature in our experimental samples is that gregoryites are frequently found as inclusion in the larger nyerereite laths (Fig. 5), but nowhere can the opposite be found (i.e., inclusions of nyerereite in gregoryite). This is in contrast to gregoryite crystals in natural samples, which
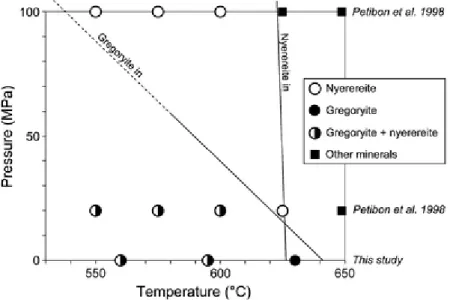
frequently have an oscillatory zoned core that is rich in lath-shaped nyerereite inclusions and an inclusion-free outer rim (Fig. 1; Peterson 1990). In combination, these observations indicate that nyerereite is the first phase crystallizing in natrocarbonatitic magmas (e.g., at depth and at elevated temperatures; cf. Petibon et al. 1998) and as the magmas rise closer to the surface the stability field of nyerereite and gregoryite cross (Fig. 9) which generates the inclusion-free outer rims of the gregoryite crystals.
Fig. 9 Pressure–temperature diagram for natrocarbonatites at 100 and 20 MPa and 1 atm for the temperature range 530°C to 650°C. Data for 100 and 20 MPa are from Petibon et al. (1998) and the 1 atm data from this study. Note that the lines for nyerereite and gregoryite cross at lower pressures
Mineral chemistry of gregoryites and the role of diffusion and reequilibration
The mineral chemistry of gregoryites and nyerereites present in the experimental charges shows a similar compositional span as natural lava samples collected in June 2007 and previously published compositions from literature, albeit the experimental gregoryites are
lower in Na2O for any given CaO content compared to natural samples (Fig. 10a). This shift
away from the natural field is probably due to the geochemical difference between our starting material and the bulk compositions of the lavas.
Fig. 10 Geochemical variation in experimentally generated gregoryites and nyerereites compared to natural samples. a Plot showing the variation in Na2O and CaO in gregoryites for experimental charges. b Plot showing the variation in Na2O and CaO in nyerereites for
experimental charges. Note that there is a clear trend in Na2O and CaO with decreasing temperature for the gregoryites (Zaitsev and Keller
2006; Zaitsev et al. 2008)
The experimental gregoryites show a clear trend toward higher Na2O and lower CaO contents
with decreasing temperature (Fig. 10a). This suggests that the mineral composition of the
gregoryites will inevitably end up as Na2O rich and CaO poor if the magmas in which they
grow are allowed sufficiently long periods of cooling.
The nyerereite compositions, on the other hand, display considerable scatter in the Na2O vs.
CaO plot (Fig. 10b) and do not show any systematic trend with decreased temperature (Fig. 6). Roughly 50% of the analyzed nyerereite crystals plot inside the natural field. In a recent paper, Zaitsev et al. (2008) reported that some samples of natrocarbonatite from Oldoinyo Lengai display distinctively different gregoryite compositions (i.e., lower Na2O and
higher CaO content) than found in most lavas from the volcano. The sample (OL-3a in Zaitsev et al. 2008) is fast quenched lapilli from the 1992 eruption of Oldoinyo Lengai. The composition of the gregoryites present in the 1992 lapilli fits fairly well with our experimental charges quenched at 595–560°C (Fig. 10). This temperature range is almost identical to the eruption temperatures of natrocarbonatitic lavas measured in the field (i.e., commonly varying between 590°C and 570°C; Dawson et al. 1990; Pinkerton et al. 1995).
The slowly cooled experimental gregoryites show high Na2O and low CaO content, as do the
different lava flows sampled at Oldoinyo Lengai over the period 1993–2000 (Fig. 10). Microphenocrysts present in the lavas have the same composition as overgrowth rims on the
larger phenocrysts (~47 wt.% Na2O and 5 wt.% CaO; Zaitsev et al. 2008), consistent with
being the last gregoryite composition to crystallize at the lowest temperatures prior to solidification. Therefore, we find that the chemistry of the crystals present in the rapidly cooled 1992 lapilli sample is in agreement with our experimental results,
All samples quenched at different target temperatures were subject to the same cooling rate (3.2°C/min) and allowed the same equilibration time at their final temperature (15 min); thus, the total time that separates each quench experiment is 11 min. This yields a maximum time difference of 44 min of cooling between sample PQ1 at 630°C and sample PQ5 at 490°C. The clear geochemical trends recorded in the cores of the experimental gregoryite crystals and the groundmass composition (Fig. 6) over such short periods of time show that elemental
diffusion must be extremely rapid in the natrocarbonatitic system (e.g., overprinting the original core composition in less than 11 min).
The experimental results indicate that the more sodic rims, free of inclusions, which are characteristic of most gregoryites in natrocarbonatitic lavas (Peterson 1990), may result from diffusion while residing in a shallow magma reservoir. It is, however, very difficult to
determine whether the zoning is due to overgrowth, diffusion, or a combination of both processes. Overgrowth should theoretically produce a rather sharp contrast between the core and rim, whereas diffusion would produce a more gradual transition. Assuming continuous crystallization was the only process affecting the composition of the crystals (e.g., producing overgrowth), the systematic variation in core compositions that we observe in our
experimental charges at different temperatures cannot be explained. Therefore, we favor a combination of rapid diffusion and continuous crystallization to form the outer rims on gregoryites and if the crystals are small enough, the entire crystal will probably be reequilibrated due to the high diffusion rates.
Textural coarsening of gregoryites
Slower cooling rates results in a decrease of the total amount of small gregoryite crystals at the expenses of large ones (Fig. 8). A decrease in small crystal sizes and increasing larger sizes is characteristic for textural coarsening (i.e., Ostwald ripening) in which the smaller crystals coalesce or dissolve to add to larger crystals. This process is common in subvolcanic intrusions where magma bodies are allowed long periods of cooling (Higgins 1998, 2002b), and textural coarsening has also been reported to affect the growth of amphibole and
plagioclase in the Soufriere Hills volcano in Montserrat (Higgins and Roberge 2003). The duration of the experimental runs for the 3.2°C/min sample and the 0.1°C/min sample only differ by 72 h, and thus, the process of textural coarsening in natrocarbonatites must be rapid in order to allow for the generation of such widely different crystal size distributions.
The question is, however, if it is realistic to expect this to occur at Oldoinyo Lengai when the natrocarbonatitic magmas are residing in the shallow magma reservoirs present beneath the hornitos of the summit crater, or even during lava flow emplacement?
During fieldwork in June 2007, we sampled an aa-type lava flow that was fed by a lava lake (i.e., same lava lake sampled for the experimental starting material). By comparing the crystal size distributions of gregoryite present in both the lava lake and the distal lava flow front
(~30 m from the lava lake; Fig. 11), it is possible to evaluate the gregoryite growth
mechanism during flow emplacement. The overall trends in the CSDs from the lava lake (OL-LL2; Fig. 11) and the flow front (OL-FF1; Fig. 11) show similar features as the experimental samples, i.e., smaller crystals, are consumed by larger crystals. This trend is not as clear as in the different cooling rate experiments but it is still there.
Fig. 11 Crystal size distribution in two different samples from a single lava flow emplaced inside the pit crater of Oldoinyo Lengai (June 2007). Sample OL-LL2 was collected from the boiling lava lake that fed the flow, and the OL-FF2 sample was collected at the flow front approximately 30 m away. Note that the CSD plot show similar trends as those observed in the experimental charges subject to different cooling rates (i.e., textural coarsening; Fig. 8) suggesting that gregoryites in natural samples also grow by textural coarsening
A previous CSD study of gregoryite and nyerereite in randomly collected natrocarbonatitic lavas also showed that these minerals have much lesser slopes in the CSD plots than
compared to silicate minerals (Fig. 4 in Peterson 1990). We observe very similar trends in our experimentally generated CSD plots (cooled at a fixed rate of between 1.0°C/min and
0.3°C/min; Fig. 8) as those found in natural lavas by Peterson (1990). Cooling rates of between 1°C/min and 0.3°C/min are probably realistic for lava flows at Oldoinyo Lengai. This rough estimate is based on a ~5°C/min cooling rate measured for a very small lava flow in the field (i.e., 90 mm wide and 31 mm thick; Pinkerton et al. 1995), which implies that even slower rates would result from cooling of more voluminous flows.
Based on the CSDs for natural and experimentally generated gregoryites, we find that significant crystal growth may occur (1) while residing in the shallow network of
interconnected magma reservoirs located beneath the hornitos inside the main crater and/or (2) during emplacement of natrocarbonatitic lava flows and the following solidification process.
Rheological control on the emplacement natrocarbonatitic lavas
A distinguishing property of natrocarbonatitic lavas is their extreme fluidity which, in turn, reflects their low viscosity (Norton and Pinkerton 1997). However, the experimental data show that natrocarbonatitic magmas crystallize rapidly during cooling at atmospheric
pressure. Thus, it is possible that syn-emplacement crystallization may affect the behavior of natrocarbonatitic lavas during emplacement as the crystal content has been shown to
significantly increase the viscosity (Lejeune and Richet 1995; Caricchi et al. 2007, 2008). Natrocarbonatitic lavas exhibit the same types of surface morphologies as commonly found in basaltic lava flows (e.g., aa-type and various varieties of pahoehoe; Keller and Krafft 1990; Pinkerton et al. 1995; Mattsson and Vuorinen 2009). Two different lava flows (e.g., one aa-flow and one pahoehoe aa-flow) were collected inside the pit crater of Oldoinyo Lengai in June 2007. Both lavas show high, almost identical, crystal contents (ranging between 60 and 70 vol.% crystals; Fig. 12) and the only noticeable difference is that the pahoehoe formed closer to the hornito that was feeding the flow (medium slope) and the aa sample further away (lesser slope). Since degree of crystallinity does not seem to be the main factor controlling the morphologies for the natrocarbonatitic flows observed in the field, we performed an
extremely simplified modeling to qualitatively estimate the effect of slope on the flow
behavior for natrocarbonatitic lavas containing 60 and 70 vol.% crystals. Crystal-rich magmas are characterized by non-Newtonian behavior, and thus, the slope (which affects the stress applied to the magma) can have a strong control on the viscosity of such lavas (Caricchi et al.
2007, 2008).
Fig. 12 Backscattered electron images of textures in natrocarbonatitic lavas collected in June 2007. Note that there are only minor differences in the crystal content in aa-type lavas (left) and pahoehoe (right)
In the calculations, we have considered a lava flow of 0.3 m thickness (h), driven only by gravity. The velocity profile as a function of the flow thickness, for a steady-state and laminar lava flow, can be described by the Navier–Stokes equation:
where η app is the apparent viscosity of magma, v is the flow velocity in the flow direction, z is
the vertical position in the flow, ρ is the density (assumed constant and equal to 2,200 kg/m3; Pinkerton et al. 1995, Mattsson and Vuorinen 2009), g is the acceleration of gravity, and θ is the angle between the horizontal plane and the flow plane. No slip conditions at the base and negligible traction at the free surface of the flow have been assumed (following Dragoni et al.
1986). The stress distribution in the direction perpendicular to flow direction is consequently
given by:
The non-Newtonian viscosity (viscosity as function of the applied stress) of natrocarbonatitic lavas containing 60 and 70 vol.% crystals has been calculated using the model presented by Caricchi et al. (2007). This model gives the variation of relative viscosity (i.e., the viscosity of the system divided by the viscosity of the liquid phase) as function of the applied strain rate. A viscosity of 0.15 Pa s has been considered for the liquid phase (Norton and Pinkerton 1997) and the apparent viscosity of the system has been calculated as:
where η r is the relative viscosity and η liq is the viscosity of the liquid phase. The variation of
apparent viscosity as function of the applied stress has been calculated fitting the values obtained from the Caricchi et al. (2007) model using an equation of the form:
where η min and η max are the minimum and the maximum apparent viscosities at the highest
and the lowest applied stress respectively, σ is the applied stress, and σ c and n are the fitting
parameters, which represent the stress at the onset of the viscosity decrease and the gradient of decrease, respectively. The variation of apparent viscosity in the direction perpendicular to the flow direction has been calculated using the stress values obtained by Eq. 2 and the values of η min, η max, σc, and n obtained from the fitting of the Caricchi et al. (2007) model. These
values are 140, 1,993 Pa s, 266 Pa, and 4 for a natrocarbonatitic magma containing 60 vol.% crystals and 2.75 × 10⁵
, 2.84 × 10⁶ Pa s, 266 Pa, and 4 for a magma containing 70 vol.% crystal.
The results for the variation of viscosity and velocity along the flow profile are showed in Fig. 13. The results show that magma containing 70 vol.% crystals flows with a maximum velocity that is more than two orders of magnitude lower than the velocity of the magma containing 60 vol.% crystals for all the investigated slopes. Additionally, in both the
examples, a reduction of the slope of the flow plane from 15° to 5° induces a drastic drop of the maximum flow velocity and a significant change of the velocity profile. These changes are related to the variations of viscosity as function of the crystal content of magma and the flow stress profile associated with the different slopes. Lower slopes of the flow plane reduce the stress applied to the magma, which, in turn, induce an increase of viscosity of the lavas.
Fig. 13 Velocity and viscosity profiles for steady-state lava flows containing 60 (above) and 70 vol.% crystals (below), as function of the inclination of the flow plane (indicated by the numbers on the lines). Note that a change from 60 to 70 vol.% crystals drastically effects the flow velocity and the viscosity
Although extremely simplified, this model is able to capture the basic effects of slope and degree of crystallinity on the flow of natrocarbonatitic lavas. Since no significant difference has been observed in the crystal content between pahoehoe and aa-type flow morphologies (Fig. 12), the transition between flow types can be related to the change in the slope of the flow plane. Since crystal-rich magmas are non-Newtonian and thus display a viscosity decrease with increasing applied stress (i.e., shear thinning behavior; Caricchi et al. 2007 and
references therein), a change in the slope of the flow plane results in a reduction of the stress acting on the lava, which in turn results in an increase of the viscosity that may force the transition from pahoehoe to aa-type morphology.
Conclusions
In natrocarbonatitic magmas, the main mineral phases, nyerereite and gregoryite, start to crystallize somewhere at depth beneath Oldoinyo Lengai. Experiments performed at 100 and 20 MPa confining pressure show that nyerereite is the liquidus phase at these pressures (Petibon et al. 1998). During ascent of the magma to shallower depths (i.e., to an
interconnected network of small reservoirs 0–40 m beneath the crater floor of the volcano; Kervyn et al. 2008), a change of the liquidus phase occurs, and gregoryite is stable to higher temperatures than nyerereite. In the shallow reservoirs (e.g., close to atmospheric pressure),
crystallization continues and gregoryite microphenocrysts (characterized by higher Na2O
content in response to the cooler environment) coalesce to form the outer rims of the preexisting larger gregoryites (i.e., the gregoryites grow by textural coarsening).
The crystallization of natrocarbonatitic magmas and lavas at atmospheric pressure is a very rapid process. This is shown by several lines of evidence: (1) the crystallinity of the
experimental charges increase from 4 to 44 vol.% during 44 min of cooling (with
ΔT = 140°C), (2) textural coarsening is evident as the dominant crystal growth process in CSD plots for experimental samples only separated in time by between 1 and 72 h, and (3) textural coarsening can also be identified in different parts of a single lava flow at Oldoinyo Lengai (e.g., a different crystal size distribution in samples collected near the source compared to samples collected at the flow front approximately 30 m away).
Our experimental results show that the geochemical composition of gregoryites is largely controlled by continuous crystallization in combination with rapid elemental diffusion.
Therefore, the cooling rate plays an important role in determining the final composition of the
gregoryites and the groundmass. In rapidly cooled experimental samples, the Na2O content of
gregoryites is lower and the CaO content is higher than for gregoryites present in slowly cooled experiments. The same chemical trend is also found in natural samples from Oldoinyo
Lengai, with higher Na2O and lower CaO contents in gregoryites present in slowly cooled
lava flows and lower Na2O and higher CaO contents in rapidly cooled/quenched lapilli
produced by Strombolian-type explosions. This implies that the gregoryite composition in natural natrocarbonatites can be used as a rough indicator of the cooling rate effective during emplacement of lava flows. However, in samples allowed to cool very slowly, the gregoryites completely reequilibrate through diffusion with the surrounding melt and the original
composition overprinted. The complex intergrowths of alkali halides and gregoryite, characteristic for the groundmass in many natrocarbonatitic lavas from Oldoinyo Lengai, were only generated in experiments that allowed cooling to the lowest temperatures (300°C). Quenching of the samples at higher temperature resulted in a rather homogeneous
groundmass. This indicates that these alkali- and halogen-rich liquids are immiscible only at temperatures between 490°C and 300°C.
The rapid crystallization of natrocarbonatites at shallow levels can significantly affect the rheological behavior of the lava flows during emplacement. When natrocarbonatitic lavas are emplaced over steep slopes (flowing down the sides of a hornito or during crater overflow episodes), the lavas can remain fluidal even at high crystal contents (up to 60 vol.%). This is due to a combination of (1) the low viscosity of the residual natrocarbonatitic melt and (2) to
the strong non-Newtonian (e.g., shear-thinning) behavior of rich magmas. If a crystal-rich lava flow encounters a decrease in slope (i.e., transition from the steeper slopes
surrounding the hornitos to the gently sloping crater floor), both the stress acting on the lava and the flow velocity will quickly decrease, which in turn results in an increase of the viscosity. This change in slope may be significant enough to force the transition from pahoehoe to aa-type morphologies in crystal-rich lava flows at Oldoinyo Lengai.
Acknowledgments We would like to thank Peter Ulmer, Eric Reusser, Matthieu Kervyn, and Jörg Keller for many interesting discussions on various topics of carbonatite volcanism. The careful reviews of Bruce Kjarsgaard, Dougal Jerram, and Anatoly Zaitsev are gratefully appreciated.
References
Caricchi L, Burlini L, Ulmer P, Gerya T, Vassalli M, Papale P (2007) Non-Newtonian
rheology of crystal-bearing magmas and implications for magma ascent dynamics. Earth Plan Sci Lett 264:402–419
Caricchi L, Giordano D, Burlini L, Ulmer P, Romano C (2008) Influence of rheology on the eruptive style of the 1538 eruption of Monte Nuovo (Phlegrean Fields, Italy): an experimental study. Chem Geol 256(3–4):158–171
Cooper AF, Gittins J, Tuttle OF (1975) The system Na2CO3–K2CO3–CaCO3 at 1 kilobar and its significance in carbonatite petrogenesis. Am J Sci 275:534–560
Dawson JB, Pinkerton H, Norton GE, Pyle D (1990) Physiochemical properties of alkali carbonatite lavas: data from the 1988 eruption of Oldoinyo Lengai, Tanzania. Geology 18:260–263
Dawson JB, Pinkerton H, Pyle DM, Nyamweru C (1994) June 1993 eruption of Oldoinyo Lengai, Tanzania; exceptionally viscous and large carbonatite lava flows and evidence for coexisting silicate and carbonate magmas. Geology 22:799–802
Dawson JB, Pinkerton H, Norton GE, Pyle DM, Browning P, Jackson D, Fallick AE (1995a) Petrology and geochemistry of Oldoinyo Lengai lavas extruded in November 1988: magma source, ascent and crystallization. In: Bell K, Keller J (eds) Carbonatite volcanism—Oldoinyo Lengai and the petrogenesis of natrocarbonatites. Springer, New York, pp 47–69
Dawson JB, Pinkerton H, Norton GE, Pyle DM (1995b) Physicochemical properties of alkali carbonate lavas – data from the 1988 eruption of Oldoinyo Lengai, Tanzania. Geology 18(3):260–263
Dragoni M, Bonafede M, Boschi E (1986) Downslope flow models of a Binghamian liquid: implications for lava flows. J Volcanol Geotherm Res 30:305–325
Gaillard F, Malki M, Iacono-Marziano G, Pichavant M, Scaillet B (2008) Carbonatite melts and electrical conductivity of the asthenosphere. Science 322:1363–1365
Gittins J, McKie D (1980) Alkalic carbonatite magmas: Oldoinyo Lengai and its wider applicability. Lithos 13:213–215
Higgins MD (1998) Origin of anorthosite by textural coarsening: quantitative measurements of a natural sequence of textural development. J Petrol 39:1307–1325
Higgins MD (2000) Measurement of crystal size distributions. Am Mineral 85:1105–1116
Higgins MD (2002a) Closure in crystal size distributions (CSD), verification of CSD calculations, and the significance of CSD fans. Am Mineral 87:171–175
Higgins MD (2002b) A crystal size-distribution study of the Kiglapait layered mafic intrusion, Labrador, Canada: evidence for textural coarsening. Contrib Min Petrol 144:314–330
Higgins MD, Roberge J (2003) Crystal size distribution of plagioclase and amphibole from Soufrière Hills volcano, Montserrat: evidence for dynamic crystallization—textural
coarsening cycles. J Petrol 44:1401–1411
Jerram DA, Cheadle MJ, Philpotts AR (2003) Quantifying the building blocks of igneous rocks: are clustered crystal frameworks the foundation? J Petrol 44:2033–2051
Keller J, Krafft M (1990) Effusive natrocarbonatite activity of Oldoinyo Lengai, June 1988. Bull Volcanol 52:629–645
Kervyn M, Ernst GGJ, Klaudius J, Keller J, Kervyn F, Mattsson HB, Belton F, Mbede E, Jacobs P (2008) Voluminous lava floods at Oldoinyo Lengai in 2006: chronology of events, vent construct instability and insights into the shallow magmatic system of a natrocarbonatite volcano. Bull Volcanol 70:1069–1086
Krafft M, Keller J (1989) Temperature measurements in carbonatite lava lakes and flows from Oldoinyo Lengai, Tanzania. Science 245:168–178
Lejeune AM, Richet P (1995) Rheology of crystal-bearing silicate melts: an experimental study at high viscosities. J Geophys Res 100:4215–4229
Mattsson HB, Vuorinen J (2009) Emplacement and inflation of natrocarbonatitic lava flows during the March–April 2006 eruption of Oldoinyo Lengai, Tanzania. Bull Volcanol 71:301– 311
McKie D, Frankis EJ (1977) Nyerereite a new volcanic carbonate mineral from Oldoinyo Lengai, Tanzania. Z Kristallogr 145:73–95
Mitchell RH (1997) Carbonate–carbonate immiscibility, neighborite and potassium iron sulfide in Oldoinyo Lengai natrocarbonatite. Min Mag 61:779–789
Mitchell RH (2006) Sylvite and fluorite microcrysts, and fluorite–nyerereite intergrowths from natrocarbonatite, Oldoinyo Lengai, Tanzania. Min Mag 70:103–114
Morgan DJ, Jerram DA (2006) On estimating crystal shape for crystal size distribution analysis. J Volcanol Geotherm Res 154:1–7
Norton G, Pinkerton H (1997) Rheological properties of natrocarbonatite lavas from Oldoinyo Lengai, Tanzania. European J Min 9:351–364
Petibon CM, Kjarsgaard BA, Jenner GA, Jackson SE (1998) Phase relationships of a silicate-bearing natrocarbonatite from Oldoinyo Lengai at 20 and 100 MPa. J Petrol 39:2137–2151
Peterson TD (1990) Petrology and genesis of natrocarbonatite. Contrib Mineral Petrol 105:143–155
Pinkerton H, Norton GE, Dawson JB, Pyle DM (1995) Field observations and measurements of the physical properties of Oldoinyo Lengai alkali carbonatite lavas, November 1988. In: Bell K, Keller J (eds) Carbonatite volcanism – Oldoinyo Lengai and the petrogenesis of natrocarbonatites, Springer-Verlag, pp. 23–36
Zaitsev AN, Keller J (2006) Mineralogical and chemical transformation of Oldoinyo Lengai natrocarbonatites, Tanzania. Lithos 91:191–207
Zaitsev AN, Keller J, Spratt J, Jeffries TE, Sharygin VV (2008) Chemical composition of nyerereite and gregoryite from natrocarbonatites of Oldoinyo Lengai volcano, Tanzania. Zap Vses Mineral Obsestva 137(4):101–111