hyperaccumulators for heavy metals
The MIT Faculty has made this article openly available.
Please share
how this access benefits you. Your story matters.
Citation
Sun, George L., Erin.E. Reynolds and Angela M. Belcher. "Designing
yeast as plant-like hyperaccumulators for heavy metals." Nature
Communications 10 (2019): 5080 © 2019 The Author(s)
As Published
10.1038/s41467-019-13093-6
Publisher
Springer Science and Business Media LLC
Version
Final published version
Citable link
https://hdl.handle.net/1721.1/124616
Terms of Use
Creative Commons Attribution 4.0 International license
Designing yeast as plant-like hyperaccumulators
for heavy metals
George L. Sun
1,2
, Erin.E. Reynolds
3
& Angela M. Belcher
1,2,4
*
Hyperaccumulators typically refer to plants that absorb and tolerate elevated amounts of
heavy metals. Due to their unique metal trafficking abilities, hyperaccumulators are promising
candidates for bioremediation applications. However, compared to bacteria-based
bior-emediation systems, plant life cycle is long and growing conditions are difficult to maintain
hindering their adoption. Herein, we combine the robust growth and engineerability of
bac-teria with the unique waste management mechanisms of plants by using a more tractable
platform-the common baker
’s yeast-to create plant-like hyperaccumulators. Through
over-expression of metal transporters and engineering metal traf
ficking pathways, engineered
yeast strains are able to sequester metals at concentrations 10
–100 times more than
established hyperaccumulator thresholds for chromium, arsenic, and cadmium. Strains are
further engineered to be selective for either cadmium or strontium removal, speci
fically for
radioactive Sr
90. Overall, this work presents a systematic approach for transforming yeast
into metal hyperaccumulators that are as effective as their plant counterparts.
https://doi.org/10.1038/s41467-019-13093-6
OPEN
1Department of Biological Engineering, Massachusetts Institute of Technology, Cambridge, MA 02139, USA.2Koch Institute of Integrative Cancer Research, Massachusetts Institute of Technology, Cambridge, MA 02139, USA.3Department of Civil and Environmental Engineering, Massachusetts Institute of Technology, Cambridge, MA 02139, USA.4Department of Material Science, Massachusetts Institute of Technology, Cambridge, MA 02139, USA. *email:[email protected]
123456789
H
eavy metal contamination is a growing environmental
concern as the world becomes increasingly industrialized.
Mining, manufacturing, and disposal of electronic goods
are the main sources of heavy metal waste; the United States alone
adds 262 million tonnes (289 tons) of waste per year to the
growing 850 and more landfills
1. To illustrate the impact of waste
generation this work specifically looked at two significant, yet
often overlooked, contributors to heavy metal waste which are the
textile industry and pollution from nuclear power plants and past
fallout. Textile manufacturing employs a variety of heavy metal
related processes, in particular dyeing, with many of the 100,00
types of dyes containing metal chelated centers for coloration
2.
Particular regions, such as India and Bangladesh where textile
manufacturing is a dominant industrial practice, see high levels of
cadmium, chromium, and lead in soils which can reach 10–100
times higher than WHO established safety limits
3. Other metals
such as cobalt, copper, zinc, and nickel are also pervasive and are
incorporated at different levels in the textile process
2,3. The result,
leachate that contains an indiscriminate mixture of metals which
are difficult to separate, therefore leaving burial or transport to
remote areas as the only viable waste management option. On the
same vein, the problem of nuclear waste and past nuclear fallout,
such as previous catastrophic events of Chernobyl and
Fukush-ima, have refocused attention on radioactive metal
contamina-tion, specifically radioactive strontium (Sr
90) which is of
particular interest for its biological implications in bone
inte-gration and cancer
4–6. However, given the molecular similarity of
calcium and strontium, and the relative abundance of calcium
over strontium, removing just Sr
90without being overwhelmed
by other species is challenging. Both waste scenarios expose a
unique challenge, how to selectively capture and discriminate
metals from one another. Removal of toxic elements such as
cadmium and mercury should be prioritized, even if at lower
concentrations than more abundant and less harmful elements
such as calcium and magnesium. This is particularly true for
radioactive elements such as Sr
90, where strontium is typically
masked by large amounts of similar divalent metals like calcium.
Current industrial approaches such as absorption and
ion-exchange are not particularly effective for precise removal of toxic
yet low concentration of heavy metals as these processes are
first
saturated by more abundant background metals
7–9.
Bioremediation strategies have the potential to address the
challenge of heavy metal contamination. A promising subset of
bioremediation is phytoremediation, the use of plants to sequester
pollutants from soils and water
10,11. Plants have developed
mechanisms to uptake heavy metals without suffering major toxic
effects, and their abundant and renewable biomass contribute to
significant bioaccumulation of toxins from soils and waters
10,11.
Out of all plants, there are more than 400 hyperaccumulator
spe-cies; the stricter definition being an accumulation of 100 mg/kg of
dry weight (DW) (0.01% DW) of cadmium or arsenic, 1000 mg/kg
(0.1% DW) of cobalt, copper, chromium, aluminum, nickel, or lead,
and 10,000 mg/kg (1% DW) of manganese, iron, or zinc
12–14. Not
all hyperaccumulators have equal metal preferences. Even in a
single family such as Brassicaceae, out of the 87 species 67 are nickel
hyperacumulators, 15 are zinc, and 5 can do both
12. Insights on the
mechanism of hyperaccumulation have been attributed to
hyper-active metal transporters and a variety of detoxification pathways
which include glutathione synthesis and metal
compartmentaliza-tion in vacuoles and other organelles
15,16.
What limits wide-spread adoption of plant-based remediation
solutions is their maintenance and engineering complexity. Plants
are complex organisms, with different species requiring strict
growing conditions where hyperaccumulators found in one
location may not necessarily thrive in others due to surrounding
biotic and abiotic factors. More so, current phytoremediation
technology takes weeks to years to see signs of remediation, and
in this current global waste crisis may be too long of a time
scale
17–19. There have been attempts to create transgenic plants
which incorporate genes from hyperaccumulators which grow
faster and are more resistant to environmental factors
20.
How-ever, because plants are multi-cellular with more complex gene
clusters, the current state of genetic tools have yet to realize the
sophistication and ease of engineering compared to their
single-celled counterparts such as bacteria and yeast
21. Therefore, design
of faster and easier waste management technologies need to be
developed on other platforms that are more scalable and
cost-effective. Single-cell organisms such as bacteria offer ease and
scalability; however, they lack many hyperaccumulating features
such as hyperactive metal transporters and useful organelles such
as a vacuole. A biological platform at the intersection of these two
is the common baker’s yeast, S. cerevisiae. Current genetic
engi-neering technologies have made it possible to engineer yeast on
all levels, from specific proteins to complex metabolic pathways.
More so, the infrastructure and ability to scale and distribute
yeast are already in place thanks to the beer and pharmaceutical
indutries
22–24. The results herein show that taking concepts from
plant hyperaccumulators and engineering them into yeast can
generate similar hyperaccumulating capabilities that are equal or
better than their plant-based counterparts.
Results
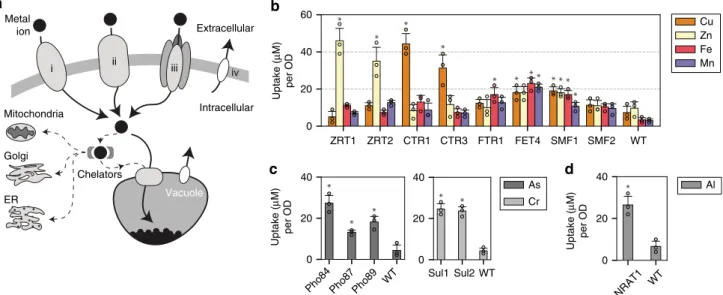
Expressing metal transporters increase metal uptake. Several
fundamental metal trafficking components are essential for
enhanced metal uptake in hyperaccumulating plants, including
cell membrane transporters, organelles storage systems, and
chelator molecules
15,16(Fig.
1
a). Metal ions enter via highly active
membrane transporters, and are compartmentalized into
orga-nelles such as the vacuole. To limit cellular toxicity, chelators such
as glutathione, metallothionein, and phytochelatins bind and
remove metals from sensitive metabolic functions
16. To mimic
these plant hyperaccumulating features, the
first step was to
identify and express a hyperactive membrane transporter. A set of
membrane metal transporters for zinc, copper, iron, and
manganese
13,15,25–27were overexpressed in yeast. For this study,
native yeast metal transporters ZRT1 (accession number
#P32804), ZRT2 (#Q12436), CTR1 (#P49573), CTR3 (#Q06686),
FTR1 (#P40088), FET4 (#P40988), SMF1 (#P38925), and SMF2
(#P38778) (ZRT3, CTR2, and SMF3 are vacuole transporters,
while FET3 is an oxidoreductase) were cloned and overexpressed
using a GAL1 promoter on a 2μ plasmid. When overexpressed,
some of the transporters, along with several more described
below, did not show uniform expression but instead had punctate
patterns when examined under
fluorescence microscopy
(Sup-plementary Fig. 1a). This suggested that over-expression led to
poor localization, and this factor was considered when selecting a
transporter candidate for future engineering.
To measure metal uptake, cells were incubated in 100
μM metal
for 4 h. Supernatant was collected and measured for remaining
metal content using inductive coupled plasma (ICP), and this
value was used to calculate the amount of metal removed by the
cells. Parallel to each experiment a sample of wild-type (WT) and
a sample with no cells were measured as controls. In addition,
samples were washed in both ddH2O and a 1 mM EDTA buffer
and measured for freed metals to account for non-specific metal
binding onto the cell wall. No major non-specific metal binding
was observed in either ddH2O or EDTA wash steps
(Supple-mentary Fig. 2). Taking these controls into consideration,
enhanced uptake of zinc, copper, iron, and manganese was
observed across several transporters (Fig.
1
b). ZRT1,2 and
CTR1,3 were highly selective for zinc and copper, respectively,
increasing metal uptake by 10-fold compared to wild-type (WT)
(p < 0.05). FET4 and SMF1 were less metal-specific and increased
metal uptake by 3–5 fold across all four metals (p < 0.05; except
for FET4 uptake of Zn compared to WT).
A similar study was performed for arsenic and chromium.
These metals are typically found in oxy-polyatomic states such as
arsenate and chromate. To achieve arsenate and chromate
hyperaccumulation a different set of transporters were needed.
Given the molecular and steric similarity between phosphate
(PO4
3−) and arsenate (AsO4
2−), and sulfate (SO4
2−) and
chromate (CrO4
2−), a hypothesis was that the overexpression of
sulfate and phosphate permeases would allow passage of arsenate
and chromate
28,29. Overexpression of phosphate permeases
Pho84 (#P25297), 87 (#P25360), and 89 (#P38361), and sulfate
permease Sul1 (#P38359) and Sul2 (#Q12325) showed increased
metal uptake of arsenate and chromate, respectively (Fig.
1
c;
Supplementary Fig. 1a). Overall, the Pho genes increased arsenate
uptake by more than 3–5 fold (p < 0.05), and Sul genes increased
chromate uptake by more than 5-fold (p < 0.05). These
observa-tions align with plant hyperaccumulation observaobserva-tions that
arsenate and chromate trespass into the cell via the phosphate
and sulfate assimilation pathways
30,31.
Another common group of metal contaminants are trivalent
metal ions such as aluminum and rare-earth metals. The most
obvious approach would be to use a trivalent metal transport for
their metal uptake; however, none exist in yeast, or generally at
all. But research in a rice specie, Oryza sativa, uncovered a
Nramp-like transporter known as Nrat1 (#Q6ZG85) which
showed selective uptake of aluminum but not divalent metals
32.
Cloning and heterologously expressing Nrat1 in yeast did indeed
promote selective uptake of aluminum with more than a 5-fold
increase in aluminum uptake than compared to WT (p < 0.05)
(Fig.
1
d), and no significant uptake for divalent metals such as
Cu, Zn, Fe, and Mn (p > 0.05) (Supplementary Fig. 3) which
results align with previous published observations
32. The use of
Nrat1 for rare-earth metal uptake such as neodymium and
ytterbium, precious metals used in magnets and electronics, were
tested but gave unreliable results as they precipitated in culture
before measurements could be performed. However, the
pre-ferential accumulation of aluminum using Nrat1 support the
hypothesis that other trivalent metals such as lanthanides and
actinides can be potentially hyperaccumulated.
To compare yeast hyperaccumulation results with established
values, the amount of metal uptake was converted to milligram of
metal removed per gram of culture dry weight (gDW)
(Supplementary Fig. 4). Given these results, overexpression of
CTR1,3 reached 7.5 ± 0.9 and 3.1 ± 0.7 mg/gDW for copper, and
overexpression of FTR1 and FET4 reached 2.0 ± 0.4 and 2.5 ± 0.3
mg/gDW for iron, respectively (Supplementary Table 1). All
phosphate (Pho84, 87, 89) and sulfate (Sul1, 2) permeases
accumulated beyond the 1 mg/gDW threshold for arsenate and
chromate hyperaccumulation. Nrat1 reached 1.25 ± 0.2 mg/gDW
of aluminum which is above the 1 mg/gDW threshold
14. Overall,
these results show that hyperaccumulation is not a plant-specific
trait but a generalizable feature that can be engineered in yeast by
selecting and expressing the appropriate metal transporters.
Increasing expression levels of SMF1 enhance metal uptake.
SMF1 from the Nramp family was selected for further
optimi-zation and engineering because of its broad metal specificity
(Fig.
1
b), and the existing body of research on the Nramp
family
33–36. Another selection criterion was SMF1’s relatively
consistent membrane-localized expression as observed under
fluorescent microscopy (Supplementary Figs. 1a, 5). SMF1 was
also favored because of its promiscuous activity with several
metals such as manganese, iron, nickel, and cobalt
27,36,37. Thus,
SMF1 was a more appealing candidate to engineer for selective
heavy metal uptake rather than converting a highly specific metal
transporter which may be less malleable to change. More so, past
a
b
c
d
As Cr Al Cu Zn Fe Mn Vacuole Extracellular Metal ion i ii iii iv Intracellular Mitochondria Golgi ER ChelatorsPho84 Pho87 Pho89 WT
0 20 40 Uptake ( μ M) per OD Sul1 Sul2 WT 0 20 40 NRAT1 WT 0 20 40 Uptake ( μ M) per OD ZRT1 ZRT2 CTR1 CTR3 FTR1 FET4 SMF1 SMF2 WT 0 20 40 60 Uptake ( μ M) per OD
Fig. 1 Metal transporters were used to selectively internalize heavy metals into yeast. a A simplified schematic of metal transport in a eukaryotic cell. Membrane transporters can be divalent metal transporters (i), permeases (ii), metal transporters that are modified or found to have auxillary metal transport function (iii), or exporters which are used to remove excess metals out of the cell (iv).b Bar coloring indicates metal measured, with over-expressed transporter labeled on thex-axis. Values are reported in μM of metal uptake normalized per yeast culture density (μM/OD). Yeast metal transporters for zinc (ZRTs), copper (CTRs), iron (FTRs and FETs), and manganese (SMFs) were overexpressed and studied for metal hyperaccumulation. A WT strain was also tested in parallel as a control.c The same study was performed for phosphate and sulfate permeases (PHOs, and SULs) which showed transport of arsenate and chromate, respectively.d The Nrat1 transporter, previously shown to uptake trivalent metals in certain strains of rice, was expressed and showed aluminum(III) transport. Asterisk above bar charts represent significance increase in uptake compared to WT (p < 0.05) for strains mentioned in the text. For all data, the mean ± s.d. of three replicates are shown. The source data underlying Fig. 1b are provided as a Source Datafile
work by Bozzi et. al. and Ehrnstorfer et. al. have elucidated crystal
structures of multiple Nramps and have shed light on their
structure-to-function
relationship
with
respect
to
metal
uptake
33,38. These insights were leveraged to semi-rationally alter
the metal preference of SMF1, which is shown in later results.
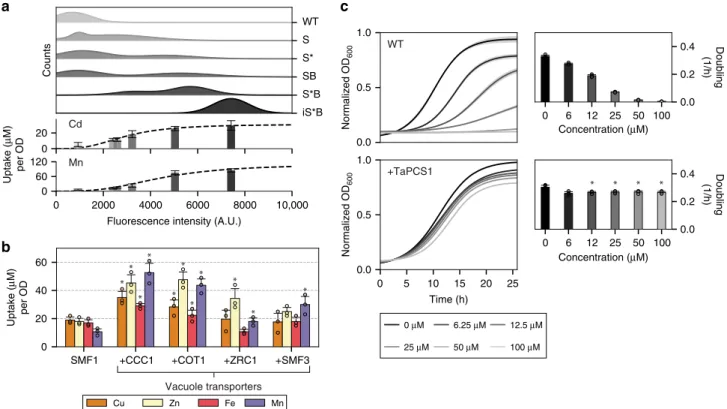
Enhancing metal uptake using SMF1 required increasing its
expression lifetime by increasing protein yield and stability. SMF1
(denoted as S), like most nutrient transporters, is tightly regulated
to control the
flux of metals into the cell, while limiting excess
uptake to protect against toxicity. SMF1 expression, for example,
is controlled by manganese ions and is post-translationally
downregulated by ubiquitination and endocytosis
39. To create a
hyperaccumulating yeast strain, these controls were removed so
that the transporter could be highly expressed without
degrada-tion. Therefore, mutations of SMF1’s ubiquitination site K33,34
were altered to arginine (mutant denoted as S*) which helped
reduce protein degradation
39. In addition, BSD2 ubiquitin ligase
(#P38356), which post-transcriptionally tags SMF1 for
degrada-tion, was deleted to further enhance SMF1 expression levels
(deletion strain denoted as B)
37,40. Finally, SMF1* was integrated
(denoted as iS*) under a GAL promoter in BSD2 knockout
strains. Expression was measured using both
fluorescence
microscopy (Supplementary Fig. 5), and quantified using flow
cytometry by
fluorescently labeling a V5 tag fused to the
C’-terminus of the SMF1 variants. Populations of
fluorescently
labeled SMF1 were analyzed to measure the percent of positively
expressing cells, and the mean
fluorescent intensity was used to
qualitatively correlate the expression level between cells to their
metal uptake levels (Fig.
2
a). Changes from S
→ S* → S*B → iS*B
corresponded to increasing uptake of manganese and cadmium
which resulted in uptake levels saturating to 85 ± 6.7
μM (8.2 ±
0.7 mg/gDW) for manganese and 22 ± 6.0
μM (4.3 ± 1.2 mg/
gDW) for cadmium given the presence of 100
μM manganese
or cadmium in culture (Fig.
2
a).
Adding vacuole transporters further enhance metal uptake.
Metal uptake capacity was further enhanced by expressing
vacuole transporters to compartmentalized metals internalized by
SMF1. Native yeast vacuole transporters
26,27tested were CCC1
(#P47818), COT1 (#P32798), ZRC1 (#P20107), and SMF3
(#Q12078) which were individually expressed in S*B strains
(Supplementary Fig. 1b and 6). All tested vacuole transporters
showed elevated metal uptake for copper, zinc, iron, and
man-ganese, with CCC1 and COT1 being the most significant across
all metals (p < 0.05) (Fig.
2
b). These results support the role that
the vacuole broadly compartmentalizes metals from the cytosol.
However, without the expression of SMF1, sole expression of
vacuole transporters CCC1, COT1, ZRC1, and SMF3 in WT
strains had negligible impact on copper, zinc, iron, and
manga-nese uptake (p > 0.05) (Supplementary Fig. 7). These results
suggest that the largest barrier to metal uptake is from the
membrane transporter, in this case SMF1, which is responsible
for initial metal internalization. It is only after metal enters a cell
that the vacuole transporters are rendered useful.
Phytochelatin synthase TaPCS1 enhances metal tolerance. The
purpose of creating a metal hyperaccumulator becomes
coun-terproductive if the cell dies and releases the internalized metals
back into the media. Therefore, mechanisms for metal
a
b
WT S S* SB S*B iS*B Cu Zn Fe Mn Cd Mn SMF1 +CCC1 +COT1 +ZRC1 +SMF3 0 20 40 60 Uptake ( μ M) per OD Vacuole transportersc
0 μM 6.25 μM 12.5 μM 25 μM 50 μM 100 μM Counts Uptake ( μ M) per OD 0 20 0 2000 4000 6000 8000 10,000Fluorescence intensity (A.U.) 0 60 120 0.0 0.5 1.0 WT +TaPCS1 0 5 10 15 20 25 Time (h) 0.0 0.5 1.0 0 6 12 25 50 100 Concentration (μM) 0.0 0.2 0.4 Doubling (1/h) Doubling (1/h) 0 6 12 25 50 100 Concentration (μM) 0.0 0.2 0.4 Normalized OD 600 Normalized OD 600
Fig. 2 Modifying yeast metal trafficking pathways improved metal uptake and tolerance. a Top subpanel shows the population distribution of SMF1 variants measured withfluorescently labeled V5-tag using flow cytometry. The weighted average of the fluorescent intensity corresponds to the placement of the lower subpanel bar charts which represent the level of metal uptake for that strain. Increasing expression levels of SMF1 correlated to increased metal uptake of cadmium or manganese; however, up to a certain point indicated by the plateau in uptake.b Expression of vacuole transporters CCC1, COT1, ZRC1, and SMF3 in addition to SMF1 enhanced metal uptake. Asterisk above bar charts represent significant increase in uptake compared to SMF1 (p < 0.05).c Constitutively expressing wheat phytochelatin synthase, TaPCS1, conferred heavy metal tolerance against cadmium. Asterisk above bar charts represent significant changes in growth rates compared to WT (p < 0.01). For all data, the mean ± s.d. of three replicates are shown. The source data underlying Fig. 2b are provided as a Source Datafile
detoxification and tolerance are needed to increase cell viability,
and in theory, give cells more time to endure and uptake metals.
One of the main mechanisms found in plants for metal
detox-ification is the production of phytochelatins, oligomers of
glu-tathione (GSH) with cysteine and carboxyl rich moieties that
chelate metals such as copper and cadmium
13,15,20. Yeast are able
to produce glutathione via the GSH pathway, which naturally
protects yeast from accumulation of toxic metals. However, there
does not exist a phytochelatin synthase for robust metal
detox-ification like that in plants. Instead, yeast rely on GSH or
cysteine-rich and low molecular weight CUP1 metallothionein to chelate
metals. However, past work has shown that metal detoxification is
effective only at high copy numbers of CUP1
41, suggesting that
protein production versus chemical synthesis of metal chelating
compounds is less effective, possibly due to a slower rate of
protein synthesis and/or abundance. Therefore, to create yeast
tolerant to heavy metal environments would require a similar
phytochelatin synthase mechanism. Past studies in plant
hyper-accumulators have shown that a phytochelatin synthase, TaPCS1
(#Q9SWW5), from wheat improved heavy metal tolerance in
both plants and yeast
42.
Integrating TaPCS1 under constitutive expression using a GAP
promoter showed cadmium tolerance beyond 100
μM, whereas
WT growth rates were significantly hampered below 10 μM (p <
0.01) (Fig.
2
c), results which support past observations
42. TaPCS1
also improved copper, manganese, zinc, and cobalt tolerance by
2–10 fold than compared to WT (Supplementary Fig. 8). The
subsequent
results
which
combine
SMF1,
CCC1,
and
TaPCS1 show that these modules can act additivity to
incrementally improve metal hyperaccumulation.
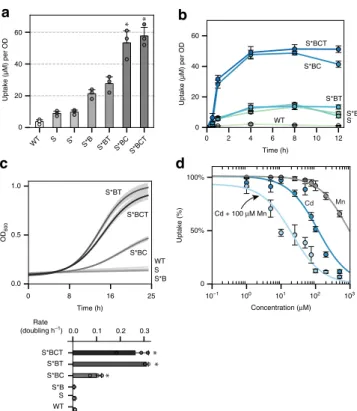
Engineering a manganese and cadmium hyperaccumulator. To
mimic the characteristics of a plant hyperaccumulator, the
final
yeast-based system combined expression of the membrane
transporter SMF1 (S, or K33,34R mutant S*), vacuole transporter
CCC1 (C), metal detoxifying phytochelatin synthase TaPCS1 (T),
and deletion of ubiquitin ligase BSD2 (B). All parts were
inte-grated into the genome except for S* which was introduced on a
2μ plasmid under a GAL1 promotor. As each component was
added to the system the amount of cadmium uptake increased
incrementally. The effect of adding all components together
(S*BCT) enhanced cadmium uptake by almost 16-fold than
compared to WT (p < 0.01) (Fig.
3
a). In addition, the rate of
uptake increased dramatically with the combination S*BC
reaching steady-states within 2–4 h compared to 10–12 h for
strains lacking an overexpressed vacuole transporter (Fig.
3
b).
The rate of uptake increased by almost 30-fold for S*BCT
com-pared to WT (p < 0.01). Adding T to S*B or S*BC did not
sig-nificantly enhance metal uptake but instead stabilized metal
internalization (Fig.
3
a, b). After 12 h of growth in media
con-taining 100
μM cadmium, strains without TaPCS1 began to leak
back out cadmium, possibly due to cell death or activation of
divalent exporters. In terms of viability, during active metal
uptake in 100
μM cadmium, the expression of C slightly
improved cell viability, whereas combined expression of C and T
fully rescued yeast survival (p < 0.01) (Fig.
3
c; Supplementary
Fig. 9).
SMF1 and CCC1 have broad metal specificity primarily for row
one transitions metals, thereby out-competing the uptake of
cadmium if other transition metals such as manganese are
present. To analyze the degree of manganese interference against
cadmium, S*BCT was titrated at varying concentrations of
cadmium with and without a constant background of 100
μM
manganese. Metal uptake values were normalized to percent
uptake with respects to the original metal concentration added,
and the concentration at which metal uptake was half was termed
KU. The KU
for cadmium with and without the presence of
100
μM went from 127 ± 12 μM to 21 ± 3.7 μM (p < 0.01). The KU
for manganese was almost 8 times higher at 945 ± 84
μM (p <
0.01) (Fig.
3
d). Therefore, the main mechanism of transport for
SMF1 preferred manganese and the uptake of cadmium was
inferred to be due to transport leakiness.
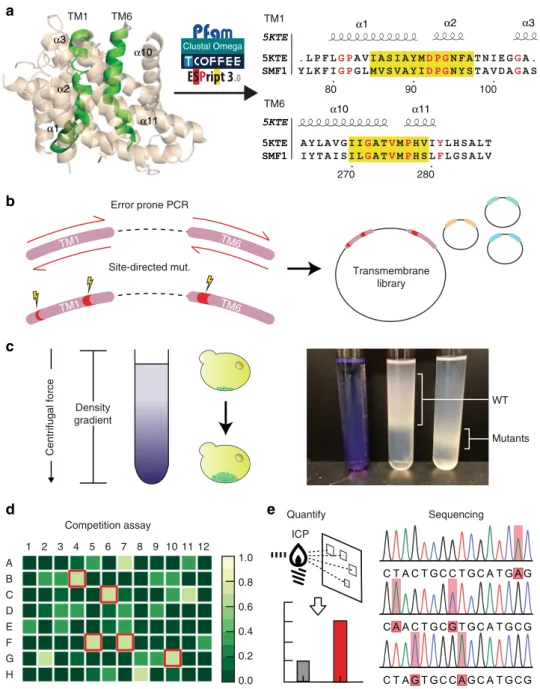
Screening pipeline to engineer metal speci
fic transporters.
Crystal structures and literature on Nramp structure-to-function
was used to semi-rationally build libraries to create two variants
of SMF1. The
first variant was a more specific cadmium
trans-porter, and the other was a strontium transporter for potential
application in radioactive Sr
90remediation. The crystal structures
of SMF1 homologs D. radiodurans (DraNramp) and S. capitis
(ScaDMT)
were
used
to
narrow
down
transmembrane
domains
(TM)
fundamental
for
metal
recognition
and
transport
33,34,36,38,43. Specifically, TM regions 1, 4, and 6 in the
Nramp family were identified to confer metal selectivity and
movement
33,38. Without a crystal structure for SMF1, the specific
TM regions had to be inferred from known structures or through
multi-alignments of conserved regions. Multi-alignment of SMF1
protein sequence against a Pfam database of homologous Nramps
including DraNramp and ScaDMT revealed region 76–105,
180–200, and 264–287 to represent TM1, 4, and 6, respectively,
based on the highest degree of conservation when compared to
TM regions in the aligned homologs (Fig.
4
a; Supplementary
Fig. 10).
More so, previous work in Nramp mechanistic function
showed that mutation M276 in SMF1 (discovered as M230 in
DraNramp) conferred metal selectivity
34. Outside
crystallo-graphic observations, it was empirically shown that mutating
TM4 region G189 (discovered as G153 in DraNramp, or G185 in
DMT1)
33,43into an arginine exposes a calcium entryway, which
was hypothesized to also transport similar group II elements like
strontium (Supplementary Fig. 10).
Mutating M276C and separately G189R and M276A were
performed on SMF1 prior to generating libraries for cadmium
and strontium screening, respectively. Given these base
muta-tions, error-prone PCR was done sequentially on TM1 and TM6
to generate libraries (Fig.
4
b) which were then transformed into
BCT strains. Creating the cadmium and strontium mutant were
performed in parallel, where separate libraries were screened for
cadmium or strontium uptake. During screening, libraries were
subjected to either 100
μM cadmium or strontium similar to
previous metal uptake experiments. Libraries were then screened
based on an increase in mass as an indirect measurement for
metal uptake. Mutants with higher metal content were
fractio-nated using rate-zonal density gradient centrifugation (Fig.
4
c;
Supplementary Fig. 11). Rate-zonal, rather than isopynic density
gradient centrifugation was used to fractionate cells based on
changes in mass, rather than equilibrium density, as previous
studies have shown that yeast maintain a relatively constant
density despite external influences
44. More so, our results showed
the greatest segregation using rate-zonal density gradient
centrifugation. Cells migrating the furthest were isolated, plated,
and picked for colonies for a more focused metal assay. Cells were
subjected to a competition assay with cadmium or strontium with
100
μM manganese in a 96 well format. A colorimetric assay
specific to manganese was performed on the supernatant, where
wells with the highest intensity (high manganese content; low
manganese uptake) corresponded with mutants with low
manganese preference (Fig.
4
d). A select number of mutants
were then chosen for quantitative metal uptake measurement
using ICP, then sequenced, and later re-introduced into the
mutagenesis/screening pipeline (Fig.
4
e). 4–5 rounds of screening
were performed to generate a cadmium and strontium mutant.
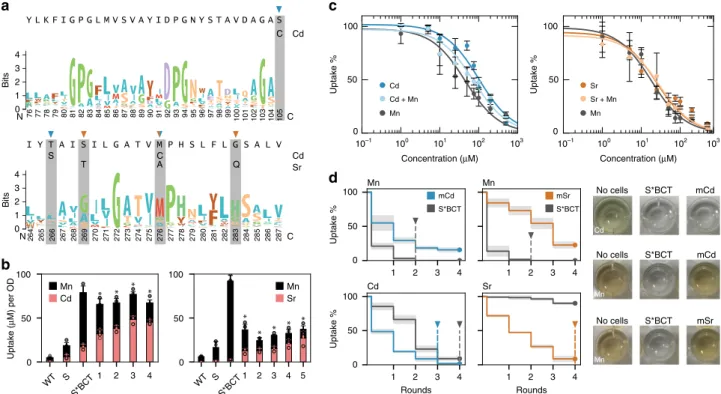
Creating a SMF1 transporter specific to cadmium or
stron-tium. The SMF1 mutant with the highest cadmium specificity
(denoted as mCd) contained mutations S105C, M276C, and
S269T; whereas the SMF1 mutant with the most selectivity for
strontium (denoted as mSr) contained mutations G189R, T266S,
M276C, and G283Q (Fig.
5
a). To test the contributions of each
mutation, SMF1* was systematically mutated at each of the
changed residues to reveal their significance and effect on SMF1
expression and function. Many of the mutations on mCd and
mSr were located on TM6 rather than TM1, which supports past
observations of the highly sensitive permeation region in the
first
alpha-helix segment of TM1 (Supplementary Fig. 12). In addition,
rounds of mutations leading to mCd and mSr did not
sig-nificantly change expression levels (Supplementary Fig. 13).
Supporting Bozzi’s et. al. work, M276 plays a critical role in
metal selectivity
34. Changing the methionine to cysteine doubled
cadmium uptake while halving manganese uptake (Fig.
5
b) (p <
0.05). Whereas changing the methionine into alanine, and
subsequently changing G189 into arginine enhanced strontium
uptake while dramatically reducing uptake of manganese by
almost 8-fold (p < 0.01) (Fig.
5
b). These modifications, and each
subsequent change, reduced Mn uptake while increasing uptake
of Cd or Sr for mCd and mSr, respectively (Fig.
5
b). It should be
noted that these mutations could instead impede Mn uptake
allowing increased permissiveness of Cd and Sr transport, rather
than strictly increasing sensitivity for Cd or Sr; a subtle yet
important distinction. However, in either case, the goal of
improving Cd or Sr uptake is shown for mCd and mSr,
respectively.
A titration experiment of cadmium and strontium with mCd
and mSr, respectively, in the background of 100
μM manganese
was performed to determine their new KU’s. For mCd the KU
for
manganese dropped by 40-fold to 26.2 ± 7.6 (p < 0.01), whereas
the KU
for cadmium went from 100 ± 3.2 without manganese to
75.8 ± 10.3 in the presence of manganese, a reduction by less than
25% (p < 0.05) in comparison to the 5-fold decrease with the
non-mutated version (p < 0.01) (Fig.
3
d; Fig.
5
c). Similarly, for mSr,
the KU
for manganese dropped to 17.9 ± 1.6 (p < 0.01) whereas
the KU
for strontium was 26.8 ± 5.7 and remained constant at
27.1 ± 11 in the presence of manganese.
The improved preference for cadmium and strontium uptake
was more obvious when performing iterative rounds of metal
uptake. When comparing uptake of cadmium or strontium in the
presence of manganese for mCd and mSr against the un-mutated
S*, it took two rounds to fully remove manganese in the
un-engineered case, while there still remained >10% manganese after
4 rounds for mCd and mSr which showed a significant reduction
in manganese uptake (p < 0.01) (Fig.
5
d). However, when
measuring cadmium or strontium uptake, mCd completely
removed cadmium after 3 rounds, while the un-engineered strain
required 4 because of manganese uptake inhibition. For mSr,
strontium incrementally decreased after each round without signs
of manganese inhibition. After 4 rounds strontium levels reached
below 10%, while the un-engineered strain had >80% strontium
remaining (p < 0.01) signifying a significant change in metal
preference from manganese to strontium.
Discussion
This work demonstrated that yeast can be engineered to
hyper-accumulate metals by overexpressing and evolving native metal
transporters and engineering mechanisms for metal
detoxifica-tion. The main design requirements for yeast hyperaccumulation
are: (1) overexpression and engineered hyperactive membrane
transporter activity, (2) overexpression of vacuole transporters for
metal compartmentalization, and (3) enhanced metal tolerance.
Co-expression of a cell membrane transporter (SMF1) and a
vacuole metal transporter (CCC1), enhanced metal uptake of
manganese and cadmium by more than 10-fold, exceeding their
plant hyperaccumulating threshold of 10 mg/gDW and 0.1 mg/
gDW, respectively. In addition, simultaneous expression of CCC1
and plant phytochelatin synthase TaPCS1 rescued yeast survival
in the presence of 100
μM cadmium. In order to improve metal
selectively against the preferred manganese substrate, and more
towards cadmium or strontium, information from
crystal-lographic and empirical observations from Nramp point
muta-tions were utilized to strategically engineer relevant SMF1
transmembrane domains. Semi-rational mutagenesis of SMF1
combined with a screening pipeline based on mass changes using
rate-zonal centrifugation generated SMF1 variants with either
0 8 16 25 0.0 0.5 1.0 OD 600
a
d
b
S*BT S*BC S*BCT S*B S* WT Cd + 100 μM Mn Cd Mnc
Time (h) Rate (doubling h–1) WT S S*B S*BC S*BT S*BCT 0.0 0.1 0.2 0.3 WT S S*B S*BC S*BT S*BCT 0 2 4 6 8 10 12 Time (h) 0 20 40 60 Uptake (µM) per OD 10−1 100 101 102 103 Concentration (μM) 0 50% 100% WT S S* S*B S*BT S*BC S*BCT 0 20 40 60 Uptake (µM) per OD Uptake (%)Fig. 3 Combining SMF1, CCC1, and TaPSC1 improved metal uptake capacity and tolerance.a SMF1 (S) and its modifications (S* and ΔBSD2 as B) along with vacuole transporter CCC1 (C) and metal resistance enzyme TaPCS1 (T) incrementally enhanced cadmium uptake. Asterisk above bar charts represent significant increase in cadmium uptake when compared to WT (p < 0.01). b Combinations of S*, B, C, and T showed changes in uptake rate, capacity, and metal retention over 12 h of metal incubation.c In the presence of 100μM cadmium, the growth rate is rescued with the addition of CCC1 and furthermore with TaPCS1. Subfigure below represents the doubling time of each strain. Asterisk to the side of bar charts represent significant increase in growth rate compared to WT (p < 0.01). d S*BCT strain was titrated against cadmium, manganese, or cadmium in the presence of 100μM manganese (x-axis). Metal uptake experiments were performed at varying concentrations from 1μM to 1 mM, metal content analyzed using ICP, and values reported as percent uptake. S*BCT showed a higher preference for manganese than cadmium, with cadmium uptake being dramatically reduced in the background presence of 100μM manganese (light blue curve). For all data, the mean ± s.d. of three replicates are shown. The source data underlying Figs. 3a, 3b, and 3d are provided as a Source Datafile
cadmium or strontium preference and more than 10-fold
reduction in manganese selectivity.
Actual application of these yeast strains in real-world settings
would require another layer of technological development, such
as a container or cartridge to secure yeast in a controllable unit.
Fortunately, these technologies exist, such as yeast packaging,
freeze-drying, and delivery which are routine technologies found
in the consumer market. A potential concept would be to grow
and store yeast in commercial
filter-like cartridges where they can
be housed in
filtering units with size-exclusion cutoffs to prevent
yeast leakage back into the purified waters. An additional layer of
safety is to genetically modify these yeast with kill switches, or a
metabolic reliance on a controlled nutrient such that removal
from these containers will result in cell death
45.
There are yet many more handles that offer better control over
metal hyperaccumulation. Expression levels of membrane metal
transporters, specifically SMF1, can be enhanced by performing
additional ubiquitin associated lysine mutations, deleting specific
proteases such as PEP4
39,40, or integrating multiple copies into
the genome with inducible or constitutive expression. Uptake
could be further enhanced by trafficking metals into other
orga-nelles such as the mitochondria, ER, or Golgi which themselves
α1 α2 α3 80 90 100 α1 α2 α3 α10 α11 270 280 α10 α11 TM1 TM6 Clustal Omega TM1 TM6 TM6
a
b
c
d
e
TM1 TM6 TM1 Quantify Sequencing Competition assay Density gradient Centrifugal force Site-directed mut. WT Mutants Transmembrane library 1 2 3 4 5 6 7 8 9 10 11 12 A B C D E F G H 0.0 0.2 0.4 0.6 0.8 1.0 ICP Error prone PCRFig. 4 A developed high throughput screen to systematically engineer selective metal transporters. a Pfam protein database and clustering services such as ClustalΩ, TCoffee, and ESpript3 were used to align SMF1 with referenced protein crystal structure 5KTE33. Through literature searches and multi-alignments,
transmembrane 1 and 6 (TM1, 6) were found to be the most significant regions for mutagenesis. The alignment comparing 5KTE with SMF1 shows the TM1 and TM6 region, where yellow highlights indicate conserved regions, and red text indicate highly conserved residues (similarity score > 0.7).b Mutations cited to enhance or decrease metal transport were selectively mutated using site-directed mutagenesis. Libraries were then generated on top of these mutations through error-prone PCR.c An initial screen was performed through rate-zonal density gradient centrifugation. d, e Fractionated layers were plated, picked, and assayed for metal uptake. A competition assay of the desired metal versus the native metal (e.g., manganese) was performed calorimetrically (d). Wells with the least amount of native metal uptake (highest signal) were selected and (e) quantitatively measured for metal uptake using ICP. Mutations were sequenced and reintroduced in the pipeline to generate better performing mutants
harbor multiple metal transpoters
26. The same transporter
screening pipeline developed in this work could also be used to
engineer organelle metal transporters, such as CCC1, to further
increase metal uptake and specificity in conjunction with a
sur-face metal transporter like SMF1. A complementary approach,
which is currently being investigated, is whether the deletion of
metal exporters could improve metal retention and enhance
overall metal accumulation. It may be a promising strategy to
delete exporters from organelles, such as the Golgi, ER,
mito-chondria, etc. to gradually build up metal compartmentalization.
This is a particularly interesting strategy if there is no good metal
transporter candidate from these organelles, or if they are difficult
to rationally engineer. Finally, yeast morphology could be altered
to allow higher uptake capacity. Theoretically, the upper limit for
metal uptake capacity is restricted to intracellular volume. If
needed, organelle size, morphology, copy-number, and yeast size
could be controlled with key genes such as VPH1 and VTCs
46,47.
Future work will assess whether increasing the physical volume of
yeast or increasing the number of organelles such as the vacuole
will lead to higher metal uptake capacity.
The major benefit of using transporters for metal
hyper-accumulation and environmental remediation is the control over
metal selectivity. Unlike current non-specific physicochemical
techniques, biological transporters engineered for metal
hyper-accumulation can distinguish less abundant yet more toxic metals
over background elements. Biological systems have evolved a
repertoire of transporters that can be leveraged for such selective
metal uptake. This work demonstrated a focused study on SMF1;
however, a similar approach using the same screening pipeline
can be employed to other transporters mentioned earlier. Such
engineering may be limited by the lack of structure-to-function
knowledge and crystal structure availability for some transporters.
However, advances in nanobody-aided crystallography, NMR,
and cryoTEM may help elucidate transporter crystal structures
for better mechanistic understanding
33,38.
There are other areas in which yeast hyperaccumulators can
have potential real-world applications. Given the customizability
of yeast and methods proposed here to engineer metal selectivity,
there is a possibility to design yeast strains by demand. Certain
geographic areas suffer from specific metal contamination
because of specific industries, for example areas in Bangladesh
and India suffer from arsenic and chromium poisoning due to the
textile industry
2,3. Therefore, yeast could be tailored to selectively
capture and remediate arsenic and chromium from their soils.
The second application is to recycle, or mine out heavy metals
back from solutions. Waste typically contains a mix of metals,
making it extremely difficult to process and especially difficult to
extract and re-capture precious metals. With this yeast-based
approach it may be possible to not only remediate waste, but also
to extract, concentrate, and store removed metals in yeast for
mining purposes. Therefore, if a certain mixture contains X
number of metals of interest, it would be possible to design X
Cd Mn Sr Mn S*BCT mCd S*BCT mSr WT S S*BCT 1 2 3 4 0 50 100 WT S S*BCT 1 2 3 4 5 0 50 100 1 2 3 4 0 50 100 Uptake % 1 2 3 4 1 2 3 4 Rounds 0 50 100 Uptake % 0 1 2 3 4 Bits N 76 A K 77 78 79 80 81 82 83 84 85 86 87 88 89 90 91 92 93 94 95 96 97 98 99 100 101 102 103 104 105C 0 1 2 3 4 Bits N 264 W 265 266 267 268 269 270 271 272 273 274 275 276 277 278 279 280 281 282 283 284 285 286 287 Ca
c
d
b
Cd Sr Cd C S A T C Q 10–1 100 101 102 103 10–1 100 101 102 103 Concentration (μM) 0 50 100 Uptake % Concentration (μM) 0 50 100 Uptake % Cd + Mn Cd Mn Sr Mn Sr + Mn Uptake ( μ M) per OD 1 2 3 4 Rounds No cells S*BCT No cells S*BCT No cells S*BCT mCd mCd mSr Mn Cd Mn Mn Mn Cd SrFig. 5 Creation of a cadmium and strontium metal transporter after 4–5 rounds of screens. a Weblogos of SMF1 TM1,6 from Nramp multi-alignment are displayed, with cadmium and strontium mutations highlighted. Cadmium mutants had S105C, T266S, and M276C. Strontium mutants had G189R, S269T, M276A, and G283Q.b Total metal uptake of 100μM cadmium and manganese were measured to assess manganese interference. Cadmium mutant labeling corresponds to 1= M276C, 2 = M276C + S105C, 3 = M276C + T266S, and 4 = M276C + S105C + T266S. Strontium mutant labeling corresponds to 1= M276A, 2 = M276A + G189R, 3 = M276A + G189R + S269T, 4 = M276A + G189R + G283Q, and 5 = M276A + G189R + S269T + G283Q. Strain background for all mutants were BCT. Asterisk above bar charts represent significant changes in both Cd and Mn uptake compared to un-mutated S*BCT (p < 0.05). c Titration curves of fully mutated cadmium and strontium transporters in strain BCT were performed for Cd or Sr, respectively, with or without 100μM Mn; x-axis represents the concentration of either Cd, Sr, or Cd, Sr, with Mn. d Sequential uptake experiments, up to 4 rounds, were performed to measure the amount of iterations required for complete elimination of 100μM cadmium or strontium in a mixture of 100 μM manganese. Images on the right are colorimetric detection of cadmium and manganese (there are no available colorimetric assays for strontium at this concentration) showing selective preference for cadmium (no coloration) against native metal manganese (darkened well). For all data, the mean ± s.d. of three replicates are shown. The source data underlying Fig. 5c are provided as a Source Datafile
number of strains to individually target and mine back those
metals. Using yeast as a mechanism for metal removal, as well as
mining and recycling can close the loop between manufacturing,
use, and disposal. Therefore, rather than providing a palliative
solution for the waste management crisis, yeast could be an
integral tool for waste treatment processes and recycling.
Methods
Yeast strain and culture. Yeast strain W303α was obtained from the Amon Lab at MIT. Synthetically defined dropout media (SD) was made by combing 1.7 g/L yeast nitrogen base without amino acid and ammonium sulfate (YNB) (Fischer), 5 g/L ammonium sulfate (Sigma), 0.6 g CSM-HIS-LEU-TRP-URA powder (MPBio), 20 g/L glucose (Sigma), and 10 mL/L of 100× adenine hemisulfate stock (1 g/L) (Sigma). 100× stocks of His (5 g/L), Leu (10 g/L), Trp (10 g/L), and Ura (2 g/L) (Sigma) were made in ddH2O andfiltered sterilized before supplementing cultures.
Alternatively, complete synthetically defined media (CSM) was made with the above ingredients but with 0.79 g/L CSM mix (MPBio). YPD was made with 20 g/L peptone, 20 g/L glucose and 10 g/L yeast extract. CSM/SD-R media was made by replacing 20 g/L glucose with raffinose (VWR). CSM/SD-G media was made by replacing 20 g/L glucose with 20 g/L galactose and 20 g/L raffinose. Solutions were stirred andfilter sterilized through a 0.22 μm filter top (EMD). Agar plates were made by adding 20 g/L BactoAgar (Fisher) and autoclaving before pouring. Isolating genomic DNA. Cultures were grown overnight in their appropriate drop-out media. 500μL of cells were then transferred and pelleted at 900×g for 3 min Cells were then resuspended in 250μL DNA breakage buffer containing 2% Triton X-100, 1% SDS, 0.1 M NaCl, 10 mM Tris-HCl, 0.5 M EDTA (Sigma) in 100 mL ddH2O. Approximately 1:1 of acid-washed 420–600 μm glass beads
(Sigma) to cell pellet were added to the tubes. 250μL phenol/chloroform/isoamyl alcohol (25:24:1; Sigma) was then layered on top. Tubes were bead beaten for 5 min and spun down at 14,000 × g for 5 min at 4 °C. The aqueous layer was then removed and added to 1 mL of ice-cold 100% EtOH (VWR) and spun down at 14,000 × g for 5 min at 4 °C. EtOH was aspirated leaving behind precipitated DNA which was then dried at room temp for 30 min Cells were then resuspended in TE buffer (Sigma) for downstream cloning.
Cloning metal transporters. Sequences were acquired from the Yeast Genome Database (www.yeastgenome.org) or through NCBI (https://www.ncbi.nlm.nih. gov/gene). All cloning steps werefirst simulated with Snapgene. All enzymes including the commercial non-trademarked Gibson assembly master mix, HiFi, were purchased from NEB. All references to Gibson assembly used the HiFi master mix. Between each PCR step, products were cleaned using the Wizard SV Gel and PCR CleanUp Kit (Promega). The pYES2/CT (Invitrogen) was used as the plasmid backbone for gene expression. The pYES2/CT vector was modified by inserting a stop codon after the V5 tag to eliminate expression of the C’ terminus 6xHis tag. All sequences were confirmed by Sanger sequencing using Quintara Bio.
Metal transporters, CTR1, CTR3, FET4, FTR1, SMF1, SMF2, ZRT1, and ZRT2 were amplified from genomic W303α DNA using PCR and ligated into pYES2/CT via restriction cloning. Forward and reverse primers (Supplementary Table 2) of the metal transporter genes wereflanked with the KpnI and XhoI restriction sites and trailed by TAAGCA junk DNA to enable efficient restriction cleavage. All genes were followed by the V5 tag native to the pYES2/CT vector.
Permeases Pho84, Pho87, Pho89, Sul1, Sul2 were amplified from genomic W303α DNA using PCR and Gibson assembled into the pYES2/CT vector. During assembly overhangs contained a HA tag to replace the V5 tag of the pYES2/CT vector (Supplementary Table 3).
Nrat1 protein sequence was retrieved from Uniprot (www.uniprot.org), codon optimized, and synthesized using Genscript. Nrat1 was Gibson assembled into pYES2/CT and immediately followed by the V5 tag (Supplementary Table 4).
CCC1, COT1, ZRC1, and SMF3 were assembled into a modified pYES2/CT vector. The pYES2/CT original URA marker was replaced with a LEU marker taken from the pRS305 vector. The CCC1 gene wasfirst cloned using restriction sites SacI and BamHI. The V5 tag was replaced with a Flag tag by introducing the appropriate PCR primer overhangs. The remaining vacuole transporter genes COT1, ZRC1 and SMF3 were created by replacing the CCC1 via Gibson assembly (Supplementary Table 5).
Engineering S*BCT. A mutated version of SMF1 was performed by mutagenzing the K33,34 region, AAGAAA, into arginines, AGGAGA, using QuikChange site-directed mutagenesis (Agilent) (Supplementary Table 6). The BSD2 ubiquitin ligase was deleted amplifying the HIS cassette using PCR from pRS303 containing 40 bp overlap with the genomic BSD2 region and transformed following the transfor-mation protocol described below (Supplementary Table 6).
TaPCS1 was ordered from Addgene (#49767; deposited by the Julian Schroeder Lab) and inserted into the pD1235 vector (ATUM) via Gibson assembly. The gene along with the TRP marker was amplified with PCR with 40 bp overlap over the trp1–1 region of the W303 strain and transformed for genomic integration (Supplementary Table 6).
pYES2/CT with CCC1 was modified to allow proper integration into the yeast genome. The vector was reorganized to have the LEU marker downstream of the gene, the swap being made via Gibson assembly. CCC1 along with the LEU cassette was amplified with PCR with 40 bp overlap over the leu2–3 region of the W303 strain and transformed for genomic integration (Supplementary Table 6). Identifying and mutagenizing SMF1 TM regions. Pfam (https://pfam.xfam.org/) was used to curate the representative proteomes from the Nramp family and were compared using TCoffee’s transmembrane multi-alignment algorithm (http:// tcoffee.crg.cat/). To check the accuracy of this tool the same dataset was aligned using Clustal Omega (https://www.ebi.ac.uk/services/teams/clustal-omega), which showed similar results. The resultant multi-alignedfile was visualized using ESPript (http://espript.ibcp.fr/ESPript/ESPript/) with reference sequence taken from PDB entry 5KTE (https://www.rcsb.org/structure/5tke) to help indicate regions with secondary structure. Red highlighted amino acids indicate highly conserved regions with similarity scores >0.7. All other amino acids are colored black. Visualized alignments identified transmembrane regions on SMF1, and mapped residues G153 and M230 found in 5KTE to G189 and M276 on SMF1, respectively. Sequence usage of the Nramp family was also visualized using WebLogo (https:// weblogo.berkeley.edu/logo.cgi) and mapped onto TM1,4 and 6 of SMF1 to quali-tatively understand the significance of mutated regions during screening.
Libraries of SMF1 were generated using primersflanking TM1 and 6 which were then used with Agilent’s GenemorphII EZClone mutagenesis kit (Supplementary Table 7). Site-directed mutagenesis primers were created using Agilent’s primer design webservice (www.agilent.com/genomics/qcpd) and mutations were introduced using Agilent’s Quikchange lightning or multi-site mutagenesis kits (Supplementary Table 7).
Transformations. Plasmid constructions were performed in NEBα competent cells (NEB) and transformed following NEB’s protocol. Yeast transformations were performed with the Frozen-EZ Yeast Transformation Kit II (Zymo Research). The protocol was modified slightly for integrated constructs. Transformed cells were first plated onto YPAD plates and grown for 1 day. Plates were replica-plated on their respective SD drop-out and grown for an additional 1–2 days. A total of 4–8 colonies were then picked, grown overnight, and smash and grabbed to isolate their genomic DNA. DNA was then amplified using PCR with primers flanking the integrated area of interest and ran on a gel to verify proper integration. Correlating OD600to culture dry weight. Wild-type W303 were grown and
diluted to various culture densities ranging from 0.1–2 OD600in 500 mL. Cells were
pelleted and washed 3× in ddH2O. 50 mL conical tubes were pre-weighed on an
analytical balance with microgram resolution. Cells were transferred into these tubes, pelleted, and resuspended in 1 mL of H2O. Tubes were then dipped and
snap-freezed in liquid nitrogen. Tubes were then capped with a porous cloth and fitted into a lyophilization chamber (VirTis) and lyophilized for 48 h. Tubes with cells were weighed with weight of the tube subtracted to calculate cell dry weight (DW). Mass of cells per volume (y-axis) was plotted against measured OD600
(x-axis) giving a ratio between OD and culture dry weight per culture volume. OD to culture dry weight correlation factor was used to convert ICP results with units ofμM to milligram of metal removed per gram of yeast dry weight (mg/gDW) for each strain mentioned in the results.
Metal uptake analysis using inductive coupled plasma. Liquid stocks of copper (II) chloride, zinc chloride, iron (II) chloride, manganese (II) chloride, cadmium nitrate, and strontium chloride (Sigma) were made at 100 mM in ddH2O and
filtered through a 0.22 μm filter. Colonies were streaked on SD agar plates, picked, and inoculated in SD-R media with the appropriate supplemented amino acids. Overnights were diluted 1:10 in SD-R and grown for 4 h. Cells were then pelleted and resuspended in SD-G media for induction overnight.
To prepare cells for metal uptake analysis, cells induced with SD-G were diluted to 1 OD600in fresh SD-G and spiked with 100μM metal and incubated for 4 h at
30 °C. After 4 h of metal incubation OD600was measured again to consider any
changes in culture density. Afterwards, cells were pelleted and supernatant collected for metal analysis. Metal concentrations were measured in an inductive coupled plasma (ICP) Agilent ICP-AES 5100 instrument following standard operating procedures provided by the Center of Material Science facility at MIT. Metal standards were made from ICP-grade stock solutions purchased from Fluka and diluted in a 2–3% HNO3matrix in CSM buffer. After ICP analysis metal uptake was
calculated by subtracting 100μM (original metal concentration) by the metal concentration measured in the supernatant. The value was then divided by the OD600measurement to give units ofμM/OD in order to equally compare uptake
levels between strains and metals. Units were further converted to mass of metal removed per cell dry weight to help compare against literature values which report hyperaccumulation values in units of mass (mg/gDW). The conversion ofμM to mg/gDW required multiplying the molarity of metal removed by the molecular weight of the metal, and converting the culture OD to gram of dry weight using the ratio derived in the OD600to culture dry weight analysis described above.
To control for non-specific metal binding onto the cell wall, a control sample containing a wild-type W303α (WT) strain was also spiked with 100 μM metal and
processed similarly to account for non-specific uptake for in a non-expressing strain. Another sample containing no cells was also spiked with 100μM metal to test for non-specific metal binding on to the test tube and equipment. In addition, a more rigorous test for non-specific binding was performed by washing cells after metal uptake and measuring the metal content in the wash buffer. After metal uptake experiments, cells were washed once with ddH2O to remove any residual
liquid, as not all the liquid was removed for ICP analysis. Afterwards, the cells were washed once more with ddH2O to the original volume and gently incubated for
3 min Cells were spun down, and supernatant measured for metal content. Afterwards, cells were washed another time in an EDTA buffer (10 mM Tris with 1 mM EDTA, pH 7.4) to the original volume and incubated for 3 min Cells were then pelleted, supernatant removed, and measured for metal content again.
Metal uptake titration experiments were performed following the same method but using different metal concentrations ranging from 1μM to 100 μM or 1 mM. Metal uptake was normalized to percent uptake with respects to the original metal concentration added. The concentration at which 50% of metal was removed was termed KU. For interference experiments, titrations against the desired metal
(cadmium or strontium) was performed in the presence of constant 100μM manganese.
Iterative metal uptake experiments were performed by taking the supernatant of a previous metal uptake experiment, and transferring the supernatant directly into a freshly induced culture normalized to 1 OD600. Uptake was performed for 4 h,
and supernatant transferred iteratively to a fresh new culture up to 4 times. At each iteration the supernatant was sampled and measured using ICP to calculate the metal uptake per round.
Staining and microscopy. Transporter expression was measured using immuno-histochemistry. Cells were induced following the procedure mentioned above and fixed with 3.7% paraformaldehyde (EMS) at 0.5 OD600for 30 min at room
tem-perature.Cells were pelleted at 900×g and washed 3× in 1.2 M sorbitol-citrate
buffer (Sigma) before resuspending in the same buffer with 1:100 dilution of 100T Zymolyase (Zymo) and incubated at 30 °C for 30 min to 1 h. Cells were pelleted and washed 3× in PBS+ 1% BSA before settling on poly-lysine treated 8 well chamber slides (Lab-Tek). Cells were gently permeabilized with 0.1% Tween-20 (Sigma) in PBS+ 1% BSA on ice for 5 min Cells were then stained with the appropriate primary antibody against V5 (2F11F7; Thermo), HA (5B1D10; Thermo), or Flag tag (FG4R or PA1-984B; Thermo). V5 and HA antibodies were diluted 1:500, while the Flag antibodies were diluted 1:1000. After 1 h at 4 °C, cells were washed 3× in PBS+ 1% BSA, and stained with the appropriate secondary antibody conjugated to AlexaFluor488 (A-11001; Thermo) or 647 (A-21245; Thermo) diluted to 1:2000. DAPI at 5μg/mL (Thermo) in PBS was used to stain nuclei for 3–5 min Cells were washed and aspirated before removing the wells. A 24 × 50 mm coverslip was placed gently on the slide with 60% glycerol in PBS as the mounting media. Nail polish was used to seal the edges and slides were imaged on an AxioPlan2 within 24 h.
In all experiments, a non-expressing WT control was stained in parallel to measure non-specific antibody binding and autofluorescence. The same primary and secondary antibodies (V5, HA, Flag tag, etc.), and staining conditions were performed similarly with the experimental samples.
Quantifying membrane expression usingflow cytometry. SMF1 variants (S, S*, SB, S*B, iS*B) were stained with antibodies following the same steps in the staining and microscopy methods. Cells were diluted to 0.1 OD600in PBS+ 1% BSA and
measured on a BD FACS Celesta or LSR II following standard operating proce-dures provided by the Koch Flow Cytometry Core. Yeast cell gating strategy fol-lowed: FSC-A and SSC-A was used to gate on cells. FSC-W and FSC-H was used to gate vertically oriented single cells (vertical singlets). SSC-W and SSC-H was used to gate horizontally oriented single cells (horizontal singlets). After gating on these 3 plots, single cells were measured based onfluorescence (Supplementary Fig. 14). Cell counts were plotted against binnedfluorescent intensity (x-axis) creating a population distribution histogram offluorescence (y-axis). The mean fluorescent intensity weighted by cell count was used to quantitatively comparefluorescent intensity (i.e., expression) against metal uptake measured by ICP for those strains. Cell culture density measurements and viability assays. OD600measurements
were performed using 2 mL non-frosted cuvettes and a table-top DU800 Beckman Coulter spectrophotometer measured at 600 nm. OD600values were used to divide
metal uptake values measured by ICP to normalize for culture density. Cell viability was measured at different metal concentrations ranging from 1μM to 100μM. Cultures were grown overnight and then diluted to <0.1 OD600.
Cultures were aliquoted to a total volume of 100μL and spiked with varying metal concentrations. Cultures were placed in a 96 well U-bottom plate (Cellstar) and shaken in a BioTek Synergy 2 plate reader held at 30 °C for 24–36 h. Growth rates were calculated byfinding the maximum slope in the growth curve.
A live-dead assay was also performed to analyze cell viability by calculating the ratio of live to dead cells after metal uptake experiments. Cells after metal uptake experiments were resuspended in culture media and dyed with a live-dead fluorescent indicator (Thermo). A positive control of freshly grown cells, and a negative control of cells heated to 70 °C for 15 min, were used to gate the live and
dead cell populations, respectively. Counts within those gates were used to calculate ratio of live cells after metal uptake. Cells were analyzed under the FITC and PE channels of an LSR IIflow cytometer.
Manganese assay. The manganese colorimetric detection Hach kit was modified tofit a 96-well format. Fifty microliter of sample was added to 50 μL of 2× ascorbic acid provided by the kit. Then 5μL of the cyanide and PANI reagent were used to detect manganese given a colorimetric change from yellow to red. Wells were measured at 560 nm. Cyanide was disposed of using guidelines approved by MIT EH&S.
Screening transporter libraries. Percoll (Sigma) buffered with 1.5 M NaCl was used to make density gradients. A Pharmacia LKB Pump P-1 peristaltic pump joined to a gradient maker (GE) was used to make Percoll gradients. Gradients were formed in Greiner 16 × 100 mm round bottom polystyrene tubes (Sigma) which werefirst hydrophobically coated with Sigmacote (Sigma). A purple dye was used as a control to visually inspect consistency of gradient formation per batch. Libraries were transformed into yeast and plated. Single colonies were pooled together using a scraper (Corning) into 10 mL of SD-R with the appropriate amino acids. Cells were grown for 12 h before being diluted into 50 mL of SD-R for 4 h. Cells were then pelleted and resuspended in SD-G with the appropriate amino acids for induction overnight. Induced culture was then diluted to 1 OD600into
multiple 10 mL SD-G media with spiked 100μM of cadmium or strontium. Cultures were grown for 4 h before washing and resuspending in 150 mM NaCl. Cells, percoll gradient, and an Eppendorf 5804-R swinging bucket centrifuge were chilled to 16 °C before spinning. Settings for acceleration and braking were set to 0. Cells were gently layered onto the gradient and spun in increments of 5 min at 100 × g. A total of 3–4 spins were sufficient to observe segregation of cells which signified a fractionation of heavier cells due to metal uptake. Approximately a centimeter below the least visible band was collected and spun down at 1500 × g for 3 min before resuspending in SD with the appropriate amino acids. Cells were rescued for 1.5 h before plating. Collected cells were plated onto 2–3 plates giving approximately 10–100 colonies each.
After platting roughly 10–50 colonies were picked in 100 μL SD-R cultures in a 96-well format and induced following the same protocol as before. Cells were diluted to 1 OD600and spiked with 100μM cadmium or strontium with the
addition of 100μM manganese and shaken for 4 h. Plates were spun down at 900 × g for 3 min and the supernatant was diluted 1:10 in ddH2O and assayed using
the modified manganese Hach detection kit described above. The top 4–6 wells with the highest readings (most manganese remaining) were selected and plated again. Selected colonies were then subjected to a more thorough metal uptake ICP experiment and sequenced before re-introduction into the screening pipeline. Mathematical analysis and plotting. Raw data were collected and stored as csv or excelfile formats. Data were imported and analyzed with python using modules such as numpy, pandas, and scipy. Plots were graphed using matplotlib. Statistical analysis. Statistical parameters including the definitions and values of n, SDs, and/or SEs are reported in thefigures and corresponding figure legends. When reporting significance, a two-tailed unpaired t-test was performed for all calculated p-values. The significance threshold was set to p < 0.05 for all experi-ments, or as specified in the text.
Reporting summary. Further information on research design is available in the Nature Research Reporting Summary linked to this article.
Data availability
Data supporting thefindings of this work are available within the paper and its Supplementary Informationfiles. A reporting summary for this Article is available as a Supplementary Informationfile. The datasets generated and analyzed during the current study are available from the corresponding author upon request. The source data underlying Figs. 1b, 2b, 3a, b, d, and 5c, as well as Supplementary Figs. 2, 3, 7 and 9 are provided as a Source Datafile.
Received: 22 February 2019; Accepted: 14 October 2019;
References
1. Powell, J. T., Townsend, T. G. & Zimmerman, J. B. Estimates of solid waste disposal rates and reduction targets for landfill gas emissions. Nat. Clim. Change 6, 162–165 (2016).
2. Robinson, T., McMullan, G., Marchant, R. & Nigam, P. Remediation of dyes in textile effluent: a critical review on current treatment technologies with a proposed alternative. Bioresour. Technol. 77, 247–255 (2001).