Aeolian Sand Transport in Out-of-Equilibrium Regimes
H. Selmani1,4 , A. Valance1, A. Ould El Moctar2, P. Dupont3, and R. Zegadi41Institut de Physique de Rennes, UMR UR1-CNRS 6251, Université de Rennes 1, Rennes, France,2Laboratoire de Thermique
et Energie de Nantes, Polytech. Nantes, CNRS UMR 6607, Nantes, France,3LGCGM, INSA de Rennes, Campus Beaulieu, Rennes, France,4Laboratoire de Mécanique de Précision Appliquée, Institut d’Optique et Mécanique de précision,
Université Ferhat Abbas, Sétif 1, Algeria
Abstract
We investigate the relaxation process toward the equilibrium regime of saltation transport in the context of nonuniform conditions. Relaxation phenomena can be described in terms of a characteristic length scale that measures the distance for the particle flux to adapt to a spatial change in flow or boundary conditions. We conducted wind tunnel experiments to document the influence of the upwind mass flux on the relaxation process. For zero upwind mass flux conditions, the relaxation process is monotone and the relaxation length is independent of the wind strength. In contrast, for nonzero upwind flux conditions (obtained by releasing particles in the flow from a finite height), the relaxation process is nonmonotone and is well captured by damped harmonic oscillations. Importantly, the relaxation length increases with increasing air flow velocity but is almost insensitive to the magnitude of the upwind flux. Our experimental outcomes clearly indicate that the relaxation of far from equilibrium transport regimes strongly deviates from a simple exponential behavior.1. Introduction
Saltation is known as the main mode of sediment transport in air and characterizes the motion of the parti-cles jumping along the sand surface in ballistic trajectories (Bagnold, 1941). When a sufficiently strong wind blows over a sand bed, aeolian transport of sand is initiated and an equilibrium between air flow and trans-ported particle is eventually achieved. This equilibrium state is characterized by an equilibrium or saturated mass flux, which is an increasing function of the wind strength. Up to now, most researches were focused on the description of the equilibrium state of transport where erosion and deposition processes balance exactly (Bagnold, 1941; Durán et al., 2011; Kok et al., 2012; Shao, 2008). A further interesting and important issue is the description of the out-of-equilibrium transport. If we consider a situation where we have a sudden increase or decrease in wind velocity, the mass flow rate does not adapt instantaneously to its new equilibrium value. This transient lasts a certain characteristic time (or occurs over a certain characteristic distance) for the new grains extracted from the bed to reach the air velocity and for the particle concentration to relax toward its new equilibrium value (Durán et al., 2011; Valance et al., 2015). During this transient process, the air speed within the transport layer has also to decrease to its equilibrium value because of the negative feedback of transport on the wind. Bagnold (1941) was the first to evidence that the saturation process takes a finite distance. When brought slightly out of equilibrium, the particle-laden air flow is shown to relax to its equilibrium state via an exponential behavior which can be modeled by a linear first-order differential equation for the mass flux Q (Andreotti et al., 2010; Pähtz et al., 2013, 2015):
𝜕Q 𝜕x = −
Q − Qsat
Lsat , (1)
where Lsatis the characteristic length scale of the relaxation process and Qsatis the saturated state
corre-sponding to the equilibrium state. It is worth noting that the mass flux Q is nothing but the product of the transported particle mass per unit area by the average particle velocity. Hence, the physics of the saturation process strongly depends on the interplay between these two physical variables. This equation describes a spatial inhomogeneous situation but an analog equation involving a characteristic time scale𝜏satcan be
written for unsteady transport. The solution of equation (1) simply reads
Q(x) = Qsat+ ( Qx0− Qsat ) exp(−(x − x0)∕Lsat), (2)
RESEARCH LETTER
10.1002/2017GL076937 Key Points:• The saturation length is independent of the wind strength in the case of zero upwind mass flux conditions • In the case of finite upwind flux
condition, the relaxation process is nonmonotone and is well captured by a damped harmonic oscillation • The relaxation length determined in
the latter case scales linearly with the friction velocity contrasting with the former case Supporting Information: • Supporting Information S1 Correspondence to: H. Selmani, [email protected] Citation:
Selmani, H., Valance, A., Ould El Moctar, A.,
Dupont, P., & Zegadi, R. (2018). Aeolian sand transport in out-of-equilibrium regimes.
Geophysical Research Letters, 45.
https://doi.org/10.1002/2017GL076937
Received 17 NOV 2017 Accepted 29 JAN 2018
Accepted article online 2 FEB 2018
©2018. American Geophysical Union. All Rights Reserved.
where Qx0is the upwind mass flux at the position x = x0. This simple exponential behavior is expected to provide a good description of the relaxation process as long as the upwind mass flux is not too far from the equilibrium-saturated flux Qsat. Andreotti et al. (2010) confirmed via wind tunnel experiments that the final
stage of the relaxation (i.e., for Q> Qsat∕4) toward the saturated state is well described by equation (2). The first
stage of the process (i.e., for 0< Q < Qsat∕4), which corresponds to the initial growth of the particle flux, is
however not captured by equation (2). In the initial growth phase, the erosion process is prevailing and is driven both by aerodynamic and impact entrainment. In the following, the characteristic length associated with this initial phase will be referred to as the amplification length Lamp.
An alternative relaxation equation was proposed by Sauermann et al. (2001) to account for the whole process from the initial growth phase to the saturation one and reads
𝜕Q 𝜕x = −
Q(Q∕Qsat− 1)
Lsat
. (3)
This equation differs from equation (1) by the presence of a quadratic term in Q which allows to describe the amplification stage for small Q. In contrast, for large particle flux Q (i.e., close to Qsat), we recover the simple linear relaxation law. This nonlinear relaxation equation can be easily integrated and yields
Q(x) = Q0
Q0∕Qsat+ (1 − Q0∕Qsat) exp(−x∕Lsat) , (4) with Q0≡Q(x =0).
Other experimental results indicate, however, more complex relaxation processes with an overshoot, which is sometimes accompanied by an oscillation behavior. In particular, Bagnold (1941) reported wind tunnel exper-iments showing that this type of complex relaxation occurs when the upwind mass flux Q0set at the entrance
of the tunnel is set to a finite value. The latter situation with a finite upwind flux may appear a bit artificial at first sight, but it is in fact intended to mimic a situation corresponding to a change in the basal boundary conditions, that is, a transition from a rigid substrate to erodible bed with a finite upwind flux. This type of settings can be encountered in a large number of natural situations. The most prominent example is that corresponding to sand transport in a barchan dune field where the ground alternates rigid basal surfaces (i.e., interdune areas) and erodible sand beds (i.e., dune areas) (Ould Ahmedou et al., 2007).
In Bagnold experiments, the upwind flux is set with a hopper device applied to the tunnel roof. The Bagnold data can definitively not be described by a simple exponential or quadratic nonlinear relaxation but share instead some features of a damped harmonic oscillator (see Figure 1). A formal relaxation equation for Q based on a damped harmonic oscillator would read
𝜕2Q 𝜕x2 + 2 L 𝜕Q 𝜕x + ( 2𝜋 𝜆0 )2( Q − Qsat ) = 0, (5)
where L and𝜆0are two characteristic length scales. The latter stands for the natural wavelength oscillation of
the undamped oscillator and the former is the length scale associated to the damping process. We can define a damping ratio𝜁 from these two length scales: 𝜁 = 𝜆0∕2𝜋L. For large damping ratio (i.e., 𝜁>1), we get an exponential relaxation without oscillation:
Q(x) = Qsat+ ( Q0− Qsat ) [ 𝛽 exp(−x∕L−)+ (1 −𝛽) exp(−x∕L+)], (6) with L±= L∕(1 ± √
1 − 1∕𝜁2). The largest length scale L
−provides the characteristic distance for the
satura-tion process, while the smallest one L+stands for the characteristic scale for the initial amplification process.
In contrast, for small damping ratio (i.e.,𝜁<1), we obtain damped oscillations with a wavelength 𝜆=𝜆0∕
√ 1 −𝜁2
obeying the following relation:
Q(x) = Qsat+(Q0− Qsat) sin [
(2𝜋∕𝜆)x + 𝜙0] sin𝜙0
exp (−x∕L), (7) where L stands for the characteristic decay length of the oscillation. Expression (7) gives an excellent approxi-mation to capture the experimental data of Bagnold (see Figure 1). Our conjecture that equation (5) provides a better framework to describe aeolian relaxation processes is supported by new wind tunnel experiments reported in this letter.
Figure 1. Variation of the mass flux along the downwind distancex: Data from Bagnold (1941) for three different upwind flux conditionsQ0= 0, 5and 17 g/m.s and a given nominal air velocityU∞= 4.9m/s. The solid lines represent the best fit using equation (7). The parameters of the fit are given in Table S1 of the supporting information.
Another important and still controversial issue concerns the physical mechanisms that govern the relaxation process. Sauermann et al. (2001) were the first to derive a theoretical expression for Lsat based on the
assumption that the relaxation length is governed by the efficiency of the erosion process due particle impacts (i.e., the splash process). Based on estimations of the elementary dune size in both subaqueous and aeo-lian environments, Hersen et al. (2002) argued that Lsatis proportional to the drag length Ldrag= (𝜌p∕𝜌f)d, where𝜌p and𝜌f are respectively the
particle and fluid density. Physically, the drag length corresponds to the distance needed for an inertial particular to equilibrate its velocity with that of the fluid. In another point of view, Andreotti (2004) proposed that
Lsatis driven by the negative feedback of the transported particles on the wind to take place. This feedback mechanism is also governed by the drag length. Direct measurements of the saturation length through wind tun-nel experiments (Andreotti et al., 2010) confirmed that Lsatis on the order of magnitude of the drag length and independent of the wind strength as expected in the hypothesis that the relaxation length is closely linked to the drag length.
Pähtz and coworkers (Pähtz et al., 2013, 2014, 2015) recently proposed an expression of the saturation length based on the saltation length Lsaltand
thus governed by the average speed of sand particles traveling above the sand bed: Lsat∝ Lsalt≈ Vp2∕g. As the grain velocity in steady regime of saltation is invariant with the wind speed (Ho et al., 2011; Valance et al., 2015), the saltation length is expected to be independent on the wind strength like the drag length. The present experimental study does not give a definite answer concerning the pertinent physical mecha-nisms of the relaxation process but provides clear evidences that the relaxation process toward the saturated regime of transport is strongly dependent on the way the system is brought out of equilibrium. We carried out extensive wind tunnel experiments to characterize the spatial evolution of the sediment flux Q(x) and relaxation toward the equilibrium state of transport with controlled upwind conditions in terms of mass flux
Q(x = 0)≡ Q0. We confirm that the saturation length is invariant with the wind strength for zero upwind flux
conditions and show that for finite upwind flux (Q0> 0) obtained by releasing particles in the flow from a finite height, the saturation length is an increasing function of the wind strength contrasting with the results of the literature.
The paper is organized as follows. First, the wind tunnel facility and experimental protocols are presented in section 2. Results and analyses are given in section 3, while section 4 provides conclusion and outlook.
2. Experimental Setup and Protocol
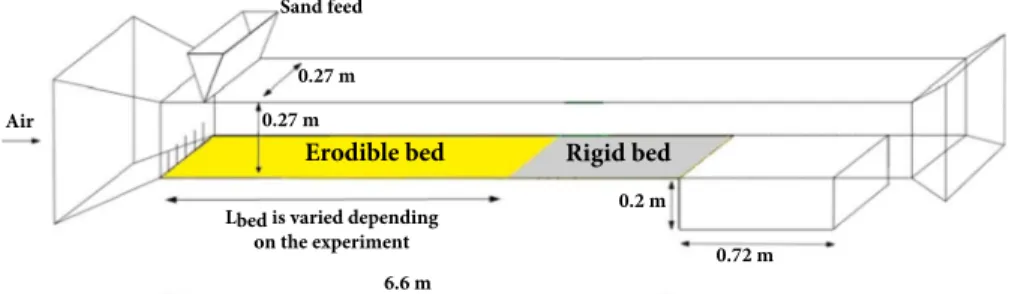
The experiments reported here were performed in a 6.6 m long wind tunnel with a cross section of dimensions 0.27 m × 0.27 m, where the nominal air velocity U∞(i.e., the air speed outside from the boundary layer) can
be varied between 0 to 20 m/s (see Ho et al., 2011, 2014 for further details). At the upwind edge of the tunnel, a hopper is installed on the roof of the wind tunnel and delivers a constant and prescribed upwind sand flux
0 1 2 3 4 5 6 7 Downstream distance x (m) 0 20 40 60 80 100 120 Mass flux Q (g/m.s) 5 6 7 8 9 10 11 U∞ (m/s) 0 0.25 0.5 0.75 1 1.25 Saturation length (m) 5 6 7 8 9 10 11 U (m/s) 0 0.5 1 1.5 2 2.5 3 Amplification length (m)
Figure 3. (a) Spatial evolution of the mass fluxQalong the downstream distancexin the case of zero upwind flux (i.e.,Q0= 0) for various air flow speeds (U∞=6, 7, 8, 9, 10 m/s). The dashed, dotted, and solid lines represent, respectively, the best fit using equations (2), (4), and (6) (see Table S2 in the supporting information for the values of the parameters). (b and c) Saturation and amplification length versus air flow speed obtained, respectively, from equations (2), (4), and (6).
Q0(see Figure 2). The floor of the tunnel is covered with a sand layer whose streamwise length Lbedwas varied from 0.2 to 6 m. The upwind edge of the sand bed is located right below the feeding system (i.e., the hopper). We used natural sand with a median diameter d = 200 μm and density
𝜌p= 2,650 kg/m3. The air speed is measured by using a Pitot tube located
at a distance of 6 m from the beginning of the tunnel and set at a height of 130 mm from the floor. The Pitot tube is outside from the boundary layer and is used to assess the nominal air velocity U∞.
We performed experiments with increasing bed length Lbedfrom 0.2 to
6 m (with an increment of 0.5 m) for various air speeds (from 6 to 10 m/s) and three different upwind sand fluxes Q0(Q0= 0, 35.6 and 69.5 g/m.s).
The nonzero values of upwind fluxes correspond to saturated values of saltation transport obtained at U∞= 7.5 and 9.2 m/s, respectively. Each run follows the same protocol. The sand bed is prepared with a uni-form thickness of 2 cm and a given streamwise bed length Lbed. The sand
bed surface is flattened before each run. The fan of the tunnel is tuned at a given wind speed, while the hopper is opened at the same time deliver-ing a prescribed upwind flux. A run lasts typically a few minutes (typically between 1 and 10) in order to collect a measurable amount of sand at the exit of the tunnel. After each run, the collected sand is weighed and the resulting outgoing flux Q(x = Lbed) is determined as follows: Q = M∕(T ×W),
where M is the mass of the collected sand, T the duration of the run, and W the wind tunnel width. This procedure allows to document the evolution of the mass flux Q(x) as a function of the downstream distance x (measured from the upwind edge of the sand bed) and to estimate the characteris-tic distance needed to reach the saturated state of transport starting from different out-of-equilibrium situations.
Lastly, it is important to make a few comments about the conditions in which the particles from the hopper are released in the tunnel in the case of nonzero upwind flux. The particles are released in the flow from the roof of the tunnel. Thus, they enter the flow with no horizontal momen-tum component but they are immediately dragged with the air flow. As a consequence, the particles do not fall straight down but follow a ballistic trajectory and impact the bed obliquely. Importantly, the fall time (which is about√2h∕g = 0.25 s where h = 0.27 m is the height of the tunnel) is larger than the characteristic time𝜏eqfor the particle to equilibrate its
hor-izontal velocity with that of the wind (𝜏eq= Ldrag∕U∞) which varies from
0.1 to 0.05 s for wind speed ranging from 5 to 10 m/s, respectively. As a result, the particles that are launched from the roof will therefore impact the bed with a horizontal velocity, which is close to that of the wind. It is thus important to keep in mind that the upwind conditions correspond to a transport state with a finite flux where the mean particle speed is far in excess in comparison with that obtained in a steady and saturated state.
3. Experimental Results
From Bagnold observations (see Figure 1), the relaxation process is expected to be completely different according to the upwind flow condi-tions (i.e., the mass flux prescribed at the upwind edge of the wind tunnel). We first revisit the situation where the upwind flux is set to zero and then investigate the situation where there is a finite upwind flux.
3.1. Zero Upwind Mass Flux Conditions
Figure 3a shows the spatial evolution of the mass flux Q(x) for different wind speeds in the situation where the upwind mass flux Q0is set to zero. The mass flux increases monotonously with increasing distance until
0 1 2 3 4 5 6 Downstream distance x (m) 0 40 80 120 160 200 Mass flux Q (g/m.s) 0 1 2 3 4 5 6 Downstream distance x (m) 0 50 100 150 200 Mass flux Q (g/m.s)
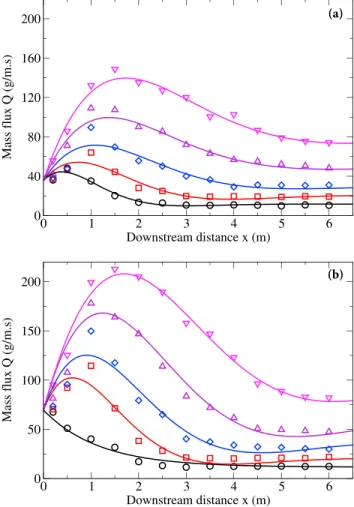
Figure 4. Spatial evolution of the mass fluxQalong the downstream distancexin the case of nonzero upwind flux for various air flow speeds: (a)Q0= 35.6g/m.s and (b)Q0= 69.5g/m.s; (black circles)U∞= 6m/s, (red squares)U∞= 7m/s, (blue diamonds)U∞= 8m/s, (purple triangles)
U∞= 9m/s, and (magenta triangles)U∞= 10m/s; The solid lines represent the best fit using equation (7) (see Table S3 in the supporting information for the values of the fitted parameters).
an asymptotic value corresponding to the saturated value is reached. As expected, the saturated value increases with increasing wind strength. As previously emphasized by Andreotti et al. (2010), the relaxation process exhibits two different characteristic length scales, one characterizing the initial stage of mass flux amplification (Lamp) and the other corresponding
to the exponential relaxation toward the saturated state (Lsat). To extract the characteristic length scales, we employ three different methods. The first one is that proposed by Andreotti et al. (2010) where the amplification length is defined as the distance to reach Qsat∕4 and the saturation length is determined by approaching the last stage of the relaxation process (i.e., when Q> Qsat∕4) via a simple exponential relaxation (cf. equation (2)).
The second one relies on the solution of the nonlinear relaxation equation (cf. equation (4)). We use the same criterion as previously to define the characteristic amplification length (i.e., Q(x = Lamp) = Qsat∕4) which yields:
Lamp= Lsatln(Q0∕3Qsat). The third method is based on the solution of an
overdamped harmonic oscillator (cf. equation (6)) where L−provides the
saturation length and L+the amplification one.
The three methods yield similar results for the amplification and saturation length (see Table S2 in the supporting information and Figure 3) except for the lowest wind speeds where the overdamped oscillator solution fails in describing properly the relaxation behavior. All three methods reveal that the amplification length Lampdecreases with increasing wind speed while
the saturation length Lsatdoes not show any significant variation with the air flow velocity. These finding confirm the experimental trends found by Andreotti et al. (2010). Our measurements show that the magnitude of the saturation length is of order of 0.4 m, which is about the same value as that obtained by Andreotti et al. (2010) but with sand grains twice smaller than ours (0.120 mm against 0.200 mm). Those direct measurements of the sat-uration length do not indicate an increase of the latter with the grain size and thus contradict the indirect measurements of Andreotti et al. (2010), which show a linear scaling of the saturation length with the particle diam-eter. Further experimental investigations are thus needed to provide a definite statement about the linear scaling of the saturation length with the particle diameter.
Finally, it is worthwhile to note that none of the new methods introduced here (i.e., nonlinear and overdamped relaxation) provides us with a more robust way to determine the amplification and relaxation lengths. The nonlinear relaxation solution is doing a bad job for describing the final stage of the relaxation process resulting in the underestimation of the saturation length by a factor 2 while the overdamped harmonic solution fails in capturing properly the relaxation process for the lowest wind speeds.
3.2. Nonzero Upwind Mass Flux Conditions
In the case of nonzero upwind mass flux, the relaxation process exhibits a contrasting behavior with a non-monotone evolution (see Figure 4). The spatial evolution of the mass flux Q(x) presents indeed a peak value at a finite distance that is greater than the incoming mass flux Q0and also greater than the saturated value.
The overshoot is clearly caused by the process of impact entrainment triggered by the particles released upwind and appears in almost all situations, whether the value of upwind mass flux is higher or smaller than the saturated flux. As a matter of fact, even if the falling height of the seeded particles is moderate, they are accelerated by gravity and dragged by the air flow to velocities larger than the particle velocity in the satu-rated state. Thus, they should produce a greater number of ejecta when they collide with the bed (Beladjine et al., 2007) and this results in an overshoot in the mass flux. Afterward, a decelerating process takes place due to the negative feedback of the particles on the wind. This situation contrasts with the case where the parti-cles start from rest and are progressively accelerated by the air flow and strive to reach the minimum required velocity to saltate continuously.
5 6 7 8 9 10 11 U (m/s) 0 0.5 1 1.5 2 2.5 3 3.5 Relaxation length L (m) 5 6 7 8 9 10 11 U (m/s) 0 2 4 6 8 10 12 Wavelength λ (m) 5 6 7 8 9 10 11 U (m/s) 0 0.2 0.4 0.6 0.8 1 1.2 1.4 1.6 1.8 2 Peak position L peak (m)
Figure 5. (a) Relaxation lengthLversus the wind speed for two different upwind mass fluxQ0= 35.6and 69.5 g/m.s (Insert: Relaxation length normalized by the drag length versus the friction velocityu∗). (b) Wavelength𝜆and (c) peak positionLpeakversus the wind speed for the two same upwind mass flux. (Insert: Lengths normalized by the drag length versus the friction velocityu∗).
The peak value Qmaxis found to increase both increasing wind strength
and upwind mass flux. A detailed analysis indicates that the latter obeys the simple following scaling: (Qmax− Qsat)∕Q0≈ 0.4(u∗∕u∗c), where u∗is
the friction velocity characterizing the saturated state of transport and u∗
c
is the static threshold velocity. To estimate the friction velocity, we used the correlation between the nominal velocity U∞and the friction velocity
u∗determined by Ho et al. (2011) in comparable conditions (similar sand
grains and tunnel length): u∗= 0.13 × U
∞− 0.32.
In our experiments, the overshoot is attributed to the preexisting upwind sand flux and disappears when the upwind flux vanishes. In the experi-mental work of Shao and Raupach (1992), an overshoot of the mass flux is also observed without any upwind mass flux. The source of this contrasting behavior remains unclear.
The nonmonotone evolution resembles the solution of a damped har-monic oscillator. We thus employed equation (7) to extract the character-istic length scales of this behavior, that is, the relaxation length L and the wavelength𝜆 of the damped oscillation (see Figure 5). First, both charac-teristic length scale L and𝜆 are found to increase with the wind strength. Second, we do not see any significant effect of the magnitude of the upwind mass flux Q0on these lengths. These results suggest that the relax-ation process is mostly driven by the wind speed and not by the intensity of the bombardment of the released particles.
Although the uncertainty of the measurements, the relaxation length L, and the wavelength𝜆 seems to be compatible with a linear scaling law with the friction velocity (see the inserts of Figure 5). This result contrasts with the invariance of the saturation length in the case of zero upwind mass flux and shows that the relaxation process is strongly dependent on the way we bring the system out from the equilibrium.
Additionally, we find that the position Lpeakof the peak value of the mass flux is also an increasing function of the wind strength and independent of the upwind mass flux. Importantly, the three length scales L,𝜆, and Lpeakare
intimately correlated since we have:𝜆 ≈ 4L and Lpeak≈ L∕2. The issue that
remains to be further elucidated is to identify the physical mechanisms which control these length scales.
4. Conclusion
We carried out wind tunnel experiments to document the relaxation pro-cess toward the equilibrium regime of aeolian sand transport by varying the upwind mass flux. The main outcomes of this experimental study fol-low. (i) We first confirm the experimental outcomes of Andreotti et al. (2010), that is the saturation length is independent of the wind strength in the case of zero upwind mass flux conditions. (ii) Second, we show that in the case of finite upwind flux conditions (obtained by releasing particles in the flow from a finite height), the relaxation process is nonmonotone as first evidenced by Bagnold (1941) and is well captured by a damped harmonic oscillation. (iii) Third, the relaxation length determined in the latter case scales linearly with the friction velocity contrasting with the former case.
It is important to stress here that conditions with a preexisting upwind sand flux can be encountered in a wide variety of natural situations. In desert environment, one can experience at least two fundamental different situations in terms of sand transport. The first one (probably the most studied) corresponds to transport on an erodible sand bed and it is encountered on sandy deserts where there is an inextinguishable source of sand.
In this case, out-of-equilibrium transport is produced by a temporal or spatial variation of the wind strength. In contrast, the second situation corresponds to transport over a basal substrate whose nature exhibits spatial inhomogeneities (i.e., transition from a rigid bed to a particle bed). This situation is typical from desert areas with a low availability of sand like in barchan dune field areas.
Our experimental outcomes indicate that the relaxation of far from equilibrium regimes cannot be described by a simple exponential behavior and requires the development of more sophisticated theoretical approaches in order to capture the complexity of far from equilibrium transport processes.
Finally, the oscillatory behavior of the relaxation process together with a characteristic length scale that increases with increasing wind speed observed in the case of a finite upwind mass flux may have some impor-tant implications concerning the dynamic of sand dunes. Indeed, it is admitted (Claudin & Andreotti, 2006; Parteli et al., 2007) that the saturation length actually controls the initial size of sand dunes emerging from a flat sand bed. In the picture where the saturation length is governed by the drag length (Andreotti et al., 2010) that is independent of the wind speed, the minimal size of a dune is therefore invariant with the wind strength. Our new outcomes suggest that in the context of barchan dunes lying on a rigid substrate and subject to a finite upwind mass flux, the minimal dune size could be dependent on the wind speed.
References
Andreotti, B. (2004). A two-species model of aeolian sand transport. Journal of Fluid Mechanics, 510, 47–70.
Andreotti, B., Claudin, P., & Pouliquen, O. (2010). Measurements of the aeolian sand transport saturation length. Geomorphology, 123, 343–348.
Bagnold, R. A. (1941). The physics of blown sand and desert dunes. Methuen, New York: Springer.
Beladjine, D., Ammi, M., Valance, A., & Oger, L. (2007). Collision process between an incident bead and a three-dimensional granular packing. Physical Review E, 75, 61305.
Claudin, P., & Andreotti, B. (2006). A scaling law for aeolian dunes on Mars, Venus, Earth, and for subaqueous ripples. Earth and Planetary
Science Letters, 252, 30–44.
Durán, O., Claudin, P., & Andreotti, B. (2011). On aeolian transport: Grain-scale interactions, dynamical mechanism and scaling laws. Aoelian
Research, 3, 243–270.
Hersen, P., Douady, S., & Andreotti, B. (2002). Relevant length scale of barchan dunes. Physical Review Letters, 89, 264–301.
Ho, T. D., Valance, A., Dupont, P., & Ould El Moctar, A. (2011). Scaling laws in aeolian sand transport. Physical Review Letters, 106, 94501. Ho, T. D., Valance, A., Dupont, P., & Ould El Moctar, A. (2014). Aeolian sand transport: Height and length distribution of saltation trajectories.
Aeolian Research, 12, 65–74.
Kok, J. F., Partel, E., Michael, T., & Bou Karam, D. (2012). The physics of wind-blown sand and dust. Report on progress in Physics, 75, 106901. Ould Ahmedou, D., Ould Mahfoudh, A., Dupont, P., Ould El Moctar, A., Valance, A., & Rasmussen, K. R. (2007). Barchan dune mobility
in Mauritania related to dune and interdune sand fluxes. Journal of Geophysical Research, 112, F02016. https://doi.org/ 10.1029/2006JF000500
Pähtz, T., Kok, J. F., Parteli, E. J. R., & Herrmann, H. J. (2013). Flux saturation length of sediment transport. Physical Review Letters, 111, 218002. Pähtz, T., Omeradži´c, A., Carneiro, M. V., Araújo, N. A. M., & Herrmann, H. J. (2015). Discrete element method simulations of the saturation of
aeolian sand transport. Geophysical Research Letters, 42, 2063–2070. https://doi.org/10.1002/2014GL062945
Pähtz, T., Parteli, E. J. R., Kok, J. F., & Herrmann, H. J. (2014). Analytical model for flux saturation in sediment transport. Physical Review E, 89, 52213.
Parteli, E. J. R., Durán, O., & Hermann, H. J. (2007). Minimal size of a barchan dune. Physical Review E, 75, 11301.
Sauermann, G., Kroy, K., & Herrmann, H. J. (2001). Continuum saltation model for sand dunes. Physical Review E, 64, 31305. Shao, Y., & Raupach, M. R. (1992). The overshoot and equilibration of saltation. Journal of Geophysical Research, 97, 559–564. Shao, Y. (2008). Physics and modelling of wind erosion. Dordrecht, Amsterdam: Kluwer Academy.
Valance, A., Rasmussen, K. R., Ould El Moctar, A., & Dupont, P. (2015). The physics of aeolian sand transport. Comptes Rendus Physique, 16, 105–117.
Acknowledgments
H. S. would like to thank the Algerian Ministry of Higher Education and Scientific Research for the financial support in the framework of program PNE 2015-2016. Data to support the figures in this manuscript are available in the supporting information.