Detection of Floating Grains in DC Aluminum Casting
by
Carolyn M. Joseph
B.S. Materials Science and Engineering Massachusetts Institute of Technology, 2015
Submitted to the Department of Materials Science and Engineering in partial fulfillment of the requirements for the degree of
Master of Science
in Materials Science and Engineering at the
MASSACHUSETTS INSTITUTE OF TECHNOLOGY February 2015
\
kjs 'Lo\~I 0 Carolyn M. JosephThe author hereby grants to Massachusetts Institute of Technology permission to reproduce and to distribute publicly paper and electronic copies of this thesis document in
whole or in part in any medium now known or hereafter created.
Signature of Author:
Signature redacted
Department of Mterials~cience and Engineering
IA Presented December 8, 2016
Certified by:
Accepted by:
Signature redacted____
/T'Jl--
Antoine AllanoreThon . King Assistant Professor of Metallurgy
"IIMI RThesis Supervisor
Signature redacted
/ %Donald Sadoway
Chair, Departmental ommittee on Graduate Students
MASSACHOsETmIFNSTUTUTE OF TECHNOLOGY
FEB 2 7
2017
Detection of Floating Grains in DC Aluminum Casting by
Carolyn M. Joseph
Submitted to the Department of Materials Science and Engineering on December 8, 2016
in partial fulfillment of the requirements for the degree of
Master of Science
Abstract
Free-moving "floating" grains have been linked to macrosegregation in direct-chill (DC) aluminum castings. The presence of these grains in the sump of a solidifying ingot has been acknowledged based on measurements of cast microstructures and by recent work using a turbulent jet to suspend solute-poor grains and minimize
macrosegregation."2 Experiments in this study were designed to sample grains from the
mushy region of two ingots, one cast by the standard method and another stirred with a turbulent jet. Measurements of floating grain size, concentration, morphology, and chemical composition are reported. The observations from the standard ingot offer a point of comparison for floating grain theories and casting models. The measurements from the stirred ingot show how the turbulent jet modifies the distribution, concentration and morphology of the floating grains.
Contents
1 Literature Review and Background 1.1 DC Casting
1.2 Macrosegregation in DC Casting
1.2.1 Free-moving "Floating" Grains ____
1.2.2 Macrosegregation Modeling in DC Casting 1.3 Free-Moving Grains in Stirred Melts_ ___
1.4 Coulter Counter_
1.5 Project Motivation __
2 Experimental Procedures 2.1 Molds for Grain Sampling
2.1.1 Surface Quenching (SQ) Mold ____
2.1.2 Deep Quenching (DQ) Mold - ---
-2.2 Coulter Counter Grain Measurements_ 2.3 DC Casting Apparatus and Procedures ___
2.3.1 Sampling Locations and Times ____
2.3.2 Samples Obtained During Standard and Stirred Casts __ 2.4 Metallographic Procedures ____ 2.4.1 Sample Preparation 2.4.2 SEM_ 2.4.3 EDS_ 2.4.4 EBSD_ 2 .4 .5 O ptical M icroscopy ---3 Results
3.1 Qualitative Analysis of Micrographs 3.2 Grain Diameters and Shapes
3.3 Grain Compositions 3.4 Grain Connectivity
3.5 Coulter Counter Measurements_
4 Discussion
4.1 Floating Grains in Standard DC Cast Ingot o-4.2 Relation to Computational Casting Models
4.3 Floating Grains in Turbulent Jet Stirred Ingot 4.4 General Discussion_
5 Conclusion
5.1 Suggestions for Future Work __
6 References
Appendix A: Mold Cooling Rates
Appendix B: Coulter Counter Theory and Sensitivity Appendix C: Coulter Counter Crucible Test
4 4 5 6 9 12 15 16 17 17 17 17 18 20 21 23 24 24 24 24 24 24 25 25 26 30 33 35 36 36 38 38 40 41 41 42 45 47 49
Acknowledgment
The author would like to thank Novelis Inc. for providing the support, expertise, and equipment necessary to complete this work. Bob Wagstaff, Rick Bruski, Sam Wagstaff, and many others at Solatens Technology Center have offered invaluable mentorship, guidance, and generosity. The author would also like to thank Professor Antoine Allanore for his advice, encouragement, and support, as well as members of the Allanore Research Group who serve as examples of kindness, hard work, and excellence in research.
1 Literature Review and Background
More than half of the 80 million tons of aluminum cast every year are cast by the direct-chill (DC) method.3 The process makes ingots for rolling and billets for extrusion
and forging. The products produced by DC casting support industries ranging from aerospace, automotive, and construction to packaging (such as beverage cans) and consumer products. Macrosegregation is a common casting defect that affects productivity and the quality of DC cast products. Understanding the main drivers of macrosegregation, particularly the influence of free-floating grains, and development of computational casting models are active fields of research. This review includes an introduction to the DC casting process, a discussion of macrosegregation and current computational casting models, and a description of techniques from the fields of rheocasting and inclusion detection that offer methods for visualizing floating grains.
1.1 DC Casting
The DC casting process is semi-continuous and consists of a water-cooled mold with a false bottom (called a starter block), which is positioned above a casting pit that is several meters deep. Figure 1 shows a schematic of the casting pit and associated equipment. Molten metal is transported to the mold via a trough and is most commonly distributed with a fiberglass distribution bag (combo bag). The mold fills with metal until a certain metal level is reached on the tang of the mold. Then, the starter block moves downward into the pit. Primary cooling of the metal occurs through contact with the mold, which is cooled with water circulating inside. As the block is moving down, the solidifying ingot extends past the bottom of the mold into the casting pit. Secondary cooling occurs as the ingot moves down into the casting pit and the metal surface is sprayed with jets of water. Over time, a steady state solidification interface develops, and the ingot consists of a liquid sump, a transitional mushy zone, and a solid region. The process continues until the desired casting length is reached.
Tundish--Molten
Alloy
-Mold
Water
4
Film
Starter
Block
/ //Solid
Alloy
Primary
Cooling
Water
Manifold
Primary
Cooling
Mushy
Secondary
-Zone
Cooling
Tertiary
Cooling
+
Casting Direction
Figure 1: DC casting setup showing relevant equipment and regions of solidification.4
1.2 Macrosegregation in DC Casting
Macrosegregation is a common casting defect in DC cast aluminum. It is defined as partitioning or segregation of alloying elements on the scale of a casting. While
microsegregation, or partitioning of elements on the scale of a grain, can be corrected by homogenization, the diffusion distances needed to correct macrosegregation are too large to be achieved with reasonable downstream processing.'- The mechanical properties of a rolled product depend on composition, so macrosegregation can result in non-uniform mechanical properties in the final product.6~9
In DC cast aluminum ingots of hypoeutectic alloys, the typical macrosegregation pattern along the centerline is a "W" shape, as shown in Figure 2. There is a buildup of eutectic forming solute elements such as copper, magnesium, and zinc at the outer edges of the casting and negative centerline segregation these elements. 3,5,1-12
I
0.06 -A Magnesium 0.04- -- --- --- Copper -Center 0.02 0 -0.02 -0.04 -0.06- 12 0 20 40 60 80 100 120 140 160 180 200
Distance, mm
Figure 2: Typical macrosegregation profiles across a billet diameter for hypoeutectic aluminum alloys. Composition measurements are from a 192mm diameter billet of aluminum alloy 2024 (Al-Cu-Mg) grain refined with 0.04% Ti. The profiles show negative centerline segregation of Cu and Mg.
Macrosegregation has been studied extensively and has several contributing causes. Most generally, it is caused by the relative motion of the liquid and solid phases during solidificiation.35,13 Several interacting mechanisms are thought to contribute to this
relative movement. These may include thermal and solutal convection, shrinkage-induced flow, sedimentation of free-moving "floating" grains, and deformation due to thermal or mechanical stress.
1.2.1 Free-moving "Floating" Grains
Sedimenting grains were proposed as a cause of macrosegregation based on post-solidification observations of a duplex microstructure in the center of some castings.14
The presence of both coarse-celled (large dendrite arm spacing) and fine-celled (small dendrite arm spacing) dendritic grains suggests that one of the types of grains formed elsewhere and was transported to the center of the ingot. The sedimenting grain theory is based on the idea that, at low solid fractions, the solid phase is depleted in solute relative to the alloy composition. Figure 3 shows solidification of a hypoeutectic alloy (XO) on a generalized phase diagram.
T-7 ---
---X
T- \ --- XL Solid composition assuming equilibrium conditions TE-Average solid composition assuming no diffusion in solid Solute CompositionFigure 3: Generalized phase diagram showing solidification of alloy XO.'5 XS is the solid composition at a given undercooling under equilibrium conditions. Xs shows the average composition of the solid phase assuming no solute diffusion in the solid and complete mixing in the liquid.
Under equilibrium solidification conditions, the composition of the solid phase (Xs) at a given undercooling (T) is depleted in solute relative to the liquid phase (XL). Assuming no diffusion in the solid and complete mixing in the liquid, the average composition of the solid phase (Xs) at a given undercooling is more significantly depleted in solute relative to the liquid phase.5
If the solute-poor solid grains that form at small undercoolings are free to move in the sump and are denser than the surrounding liquid, they may settle to the center of the ingot and create a region of negative segregation. Electron microprobe measurements on the coarse- and fine-celled dendritic grains found in the center of castings indicate that the coarse-celled grains are depleted in solute and could be the free-moving grains suggested by the theory.4"6 In addition, the theory would explain why grain refining elements such as titanium, which exhibit a peritectic reaction with aluminum, show positive centerline segregation. Instead of being rejected from the first solid, these elements would be part of
the initial solid nuclei and would be transported to the center of the ingot with the
sedimenting grains. "
Recent observations suggest that sedimenting grains are the major contributor to the region of negative segregation at the center of large DC cast aluminum ingots.'21 8 , Work by Wagstaff and Allanore has shown that stirring with a turbulent jet during casting can resuspend floating grains and minimize the effects of macrosegregation.' In addition, it was found that the static angle of repose of a coarse-celled dendritic grain matches the sump angle after which negative centerline segregation is observed. 8 A strength of the floating grain theory over other explanations for macrosegregation is that it can explain both the negative centerline segregation of eutectic-forming elements and the positive segregation of peritectic-forming ones.
Existing knowledge on floating grains is conceptual, based on post-solidification
observations of final cast microstructures.'2,2,14,1-18 The size and composition of the
coarse- and fine-celled grains at the center of an ingot have been quantified.2"6 Line scan
measurements show that the coarse-celled grains exhibit a uniform plateau of minimum composition as compared to the fine-celled grains which show a gradual change in composition from the center to the grain edges." Figure 4 shows an example of the duplex microstructure as well as line scan measurements across the grains. 12
A
B
30-10 to
Distance/ pm Distance/pm
Figure 4: Micrograph and line scans of duplex grain structure observed at the center of a 192mm grain refined DC cast billet.2 (A) Coarse-celled grains and corresponding line
scan showing Cu and Mg content. (B) Fine-cell grains and corresponding line scan. The coarse celled grains found in the center of grain refined billets were found to have minimum compositions that were 17-25% of the initial composition. The fine cell grains in these billets had minimum compositions that were 26-56% of the nominal alloy composition. 6Despite their differences in dendrite arm spacing, the average diameters of
the and fine-celled grains were not different. It was also observed that the coarse-celled grains seem to be present as clusters.6
Turbulent jet mixing has been shown to produce ingots with more homogeneous composition profiles." In a macrosegregation study by Wagstaff and Allanore, it was found that the center of a standard Al-4.5%Cu ingot was depleted by 15% from the furnace Cu composition.'0 In contrast, an ingot of the same alloy that was stirred with a
turbulent jet exhibited minimal depletion in the center region (-5% to +5% deviation from furnace composition). 2 Substantial grain refinement was observed with jet processing
and it was found that the microstructure became more globular.2 Grain sizes in the center
of the standard ingot ranged from 200-250pm.'0 The jet processed ingot had grains with
an average size of 50pim and a maximum size of 150pm. In addition, the measured dendrite arm spacings in the jet processed ingot approached the measured grain sizes, indicating that the globular nature of the grains did not allow for distinguishing between grains and dendrite arms.2 A copper quenching mold was used to quench grains from the
surface of the jet processed ingot during casting. Grains captured from the surface were observed to be globular and -50pm in size.2
1.2.2 Macrosegregation Modeling in DC Casting
Post-solidification measurements have driven the development of floating grain macrosegregation theories. Computational DC casting models offer another method for testing assumptions about grain formation and motion.
Knowledge of floating grain properties is particularly important for casting models, which can combine transport mechanisms in the liquid, solid, and mushy regions of an ingot." Composition profiles can be predicted and then compared to experimental measurements on post-solidified castings. Initial models assumed that the solid phase moved at the casting speed everywhere and thus did not include free-floating grains.20 As
it became clear that floating grains are a significant contributor to macrosegregation, DC casting models were modified to include their effect.
Floating grains were first incorporated into a two-dimensional DC casting model by Reddy and Beckermann. In this model, the solid phase was assumed to be rigid and moving at the casting speed at solid volume fractions greater than the packing limit (0.637). At solid fractions lower than the packing limit, the solid was assumed to be spherical particles that could move freely in the surrounding liquid. The model assumed heterogeneous nucleation at a given undercooling and did not consider grain
fragmentation, remelting of grains, or grain evolution. Agreement with experimental macrosegregation profiles was not consistent, but the model predicted negative centerline segregation.
Numerous subsequent macrosegregation modeling studies of DC casting have included floating grains.9,23-27 Vreeman et al. developed a model accounting for
patterns, and compared the model to industrial scale ingots.-2 Figure 5A shows the ingot sump profile predicted by the model for a grain refined ingot during steady state casting. It includes lines of constant solid fraction, streamlines, and shading to represent the total solute concentration in the solid and liquid phases. Figure 5B shows the
macrosegregation profile predicted by the model and the corresponding experimentally measured composition profiles.
Predicted Sump Conditions
0.00 Streamlines
/u' 0Solid Fraction
00" Macrosegregation Profiles 0 0.15 f =0.3 6.0 -00 0.205. 0.25 56
f
M Experiments Predictions 0.30- 5.4 .0 0.05 0.10 0.15 0.20 0.00 0.05 0.10 0.15 0.20A
Position/rB
Solute Concentration / wt% Cu 5.7 5.9 6.1 6.3 6.5Figure 5: Results from macrosegregation model of a grain refined ingot that accounts for floating grain motion. (A) Predicted sump conditions during steady state casting. (B)
Predicted and experimentally measured macrosegregation profiles.
The model includes a mushy region composed of liquid and free-floating dendrites at solid fractions less than the packing fraction (0.3). At larger solid fractions, a rigid solid phase moves at the casting speed. The values for grain diameter and packing fraction were assumed to be constant. The model was found to be highly dependent on these two key parameters, as the grain diameter determines the velocity difference between the liquid and solid phases, and packing fraction separates the region of free-floating dendrites from the rigid solid structure. The grain diameter and packing fraction are unknown quantities, however, and are difficult to predict since grain coalescence mechanisms and grain growth with convection are not well understood and are heavily
dependent on grain morphology. The grain size is likely a distribution of diameters, and the packing fraction is not necessarily constant in the ingot.
This model was compared to experimental macrosegregation profiles from casts with and without grain refiner." Since floating grain formation was assumed to occur through heterogeneous nucleation on grain refiner, the model's grain refined case had floating grains while the non-grain refined case did not. The model underpredicted the magnitude of centerline segregation in the grain refined cast (Figure 5B) and did not predict the negative centerline segregation that was observed in the non-grain refined cast. While many model parameters may affect the final composition profile, the results suggest that grains may form by fragmentation in addition to heterogeneous nucleation on grain refiner.
In order to rigorously determine the dendrite diameter distribution, volume fraction, and path of motion in an ingot, models must include a nucleation or fragmentation model as well as a transport equation that accounts for grain growth. Multiscale and multiphase modeling studies of equiaxed solidification have worked to develop macroscopic
transport equations and connect them to microscopic relations for nucleation, crystal
fragmentation, and growth.2S32
One example of a DC casting model that couples grain nucleation and growth with macroscopic transport equations is presented by Zaloznik et al. This model assumes a porous solid phase at volume fractions greater than the packing limit (0.3), and free-floating spherical grains at smaller solid volume fractions. Grain refiner particles were modeled to move at the liquid velocity, and nucleation was assumed to occur at a critical undercooling, dependent on grain refiner particle diameter. In this model, grain motion during casting could be tracked. Figure 6 displays the predicted sump conditions, including lines of constant solid fraction, streamlines of solid motion, and shading to represent the floating grain concentration.
Predicted Sump Conditions
0.0 -- -Solid Fraction Grain f 0.0 Concentration/ m- -> 2Solid Streamlines 1.15x 10" 1.10x10" 1.05X 10¹²a 1.00xIO" 0.2 0.15 0.10 0.05 0 Position / mFigure 6: Predicted sump conditions for a grain refined cast showing grain concentration (number per m3), solid streamlines, and lines of constant solid fraction.
The model predicts that grains may circulate in three different thermal regions. If they remain close to the inclined solidification front, solidification would be fast. If they enter the core of the mushy region with minimal undercooling, grains would experience slow growth before settling to the bottom. Closer to the liquidus front, remelting would occur. This led to the conclusion that some of the grains found at the center of the ingot are from the fast-growing zone close to the packing front, while others settled from the slow-growing zone.
The current method for validating casting models is by comparison to post-solidification measurements. If there are discrepancies between the predicted and
measured macrosegregation profiles, it is difficult to know which assumptions about the solidifying ingot must be modified. Measurements of floating grains in the mushy region during solidification can serve as an intermediate point of comparison for model
development and validation.
1.3 Free-Moving Grains in Stirred Melts
Jet processing of DC cast aluminum shares many similarities with semi-solid metal processing techniques such as rheocasting and thixocasting. Rheocasting is a metal
forming process by which metal is partially solidified under vigorous agitation before it is cast into its final shape. The semi-solid mixture is composed of solid spheroids, whose properties depend on the shear rate and cooling rate.3 In both rheocasting and jet processed DC casting, solidification occurs under cooling with vigorous convection and
the resulting microstructures are equiaxed.' 4 Because of these similarities, the
rheocasting literature offers valuable insight into the theory of grain formation and evolution during stirring as well as useful techniques for characterizing free-moving solids during solidification.
Several methods have been used to characterize stirred melts during solidification including viscosity measurements and quenched samples. A common sampling method in rheocasting is rapid quenching of the melt with a copper mold to preserve the
microstructure. This method was developed to study chill zone formation.36 A similar
mold was subsequently used to quench semi-solid melts and cool the liquid phase quickly enough that it would be distinguishable from the existing solid.' The study found that samples obtained by the mold showed a fine, equiaxed microstructure combined with larger grains, which were either dendritic or globular depending on the solidification conditions, and are often found in clusters. The larger grains were presumed to be solid at the time of quenching, while the fine grains were part of the liquid phase. When
examined with an optical microscope, the large grains showed a darker region around their outer edge, adding -40pm to the total diameter. This area correlated to a region of high Cu concentration when a line scan was done across the grain with SEM-EDS. This region was assumed to be growth of the grain during quenching with the copper mold.
The Cu mold quenching method has been used in several rheocasting studies.3 Quantitative metallography is difficult on quenched samples of semi-solid melts and on final rheocast microstructures.4' This is because of the complex structure of the particles,
which can be dendritic, "cramped" dendrites, or agglomerates of individual particles. 4
It is difficult to determine particle connectivity from two-dimensional cross-sectional measurements since particles interconnected as dendrites or as agglomerates of
independent particles may appear to be separate when cut at certain orientations. Serial polishing is one way to determine the connectivity. Several serial polishing studies of quenched grains have revealed that seemingly separate grains are in fact
interconnected.' 4 3
There is still discussion as to whether the particles are connected as large dendritic grains or as agglomerates of individual particles. Another metallographic technique that can assist in understanding the connectivity of grains is electron
UakAttN Le1 UeLLtIon (EBSD) U1 eCLLhi1g Le111qUCs LldL lreveal the crystaliUgrapmic
orientation of the particles.4
' These methods can help distinguish between grains that are independent particles that have agglomerated into a single mass, which would exhibit different crystallographic orientations and large dendritic masses, which would show the
same orientation.
In semi-solid metal processing, spherical grains form under conditions of vigorous convection and slow cooling. Leading theories suggest that that grains are initially equiaxed dendrites, which then ripen and evolve to form "rosettes" and eventually spheres.34
'~' ~ 4-Initial dendrite
B
C Dendritic growthIncreasing shear rate
C
Roet Increasing time+-- Rosette Decreasing cooling rate
D
4- Ripened rosette Entrapped eutectic
Spherical grain
Figure 7: Grain structural evolution during solidification with forced convection.34 The
extent of evolution depends on the shear rate, the amount of solidification, and the cooling rate. (A) Initial dendrite fragment. (B) Dendritic growth. (C) Rosette. (D) Ripened rosette. (E) Sphere.
Spherical grains often contain entrapped eutectic, which is evidence of their previously dendritic structure. In one study, spherical grains were found at very low fractions solid (less than 0.05) after only 5 seconds of solidification. No entrapped
eutectic was observed in these grains37 This indicates that in some cases, spherical grains
form directly and dendritic growth can be avoided.
The primary and secondary dendrite arm spacings of solidified structures are related to local solidification time. Studies of semi-solid melts indicate that the particle diameter
depends strongly on cooling rate, and the particle diameter for a fixed cooling rate is approximately equal to what the primary dendrite arm spacing would be in an unstirred
melt of the same cooling rate. Figure 8 shows experimental data for the of particle size at varying cooling rates for A14.5%Cu. Points labeled "Final diameter" are grain
diameters measured on samples quenched from the semi-solid melt. "Initial diameter" subtracts out the expected grain growth during quenching. The remaining points are the final diameters from various studies obtained after isothermal ripening of small grains.
The upper and lower bound lines are based on final dendrite arm spacing vs solidification time measurements for various Al-Cu solidification studies.
1000
100 :1
Dendrite arm spacing 0
2 Upper bound
. 10
0Final diameter
Dendrite arm spacing 0 Initial diameter
Lower bound 0 Diameter after ripening
A Annavarapu and Doherty (ripening) + Manson-Whitton (ripening)
0.1 1 10 100 1000 10000
Local Solidification Time / s Figure 8: Grain diameter in semi-solid melt and solidification time.
1.4 Coulter Counter
A coulter counter device is commonly used in aluminum casting for detection of nonmetallic inclusions (particles of oxide, flux, or refractory). The principles are based on the electrical sensing zone method of aqueous coulter-counters, which can measure the concentration and size of particles in a conducting liquid. In aluminum casting, the
most widely used coulter counter device is the LiMCATM , which was developed in the
1980s by Doutre and Guthrie." It is inserted into the trough either before or after metal filtration, and usually measures particle concentrations in units of thousand inclusions (greater than a given size) per kilogram. Size distributions measured by the LiMCA and similar coulter counter devices are used to monitor metal cleanliness and filter
efficiencies.
In principle, the coulter counter device can also be used to detect conductive particles in molten metal. There are several examples in the literature of coulter counters being used to measure conductive particles. During the development of the LiMCATM , this principle was tested by use of the device to measure particles of copper in liquid
gallium.45 The device has also been used to measure conductive grain refiner particles,
particularly in studying grain refiner fading.47 There are also examples of a coulter
counter device being used to measure the size and concentration of aluminum grains in a solidifying crucible.48'49 In these studies, a crucible of metal was allowed to cool below
the liquidus and a LiMCATM was used to measure particle sizes and concentrations until the orifice became blocked with solid metal. Both the particle concentration and average particle size increased as a function of decreasing temperature. Rapidly solidified samples taken at various temperatures showed the presence of particles, and an increase in particle concentration and size with decreasing temperatures. The coulter counter measurements were not validated quantitatively with the metallographic samples.
1.5 Project Motivation
The floating grain macrosegregation theory has progressed significantly in recent years. Evidence for the presence of grains is based on macrosegregation profiles, modifications by jet processing, and analysis of critical sump angles. Computational models that include floating grains can predict the negative centerline segregation observed experimentally in grain refined ingots in two-dimensions. Casting models are evaluated by comparison to post-solidification measurements, which offer information on the final morphology and composition of grains. There has not, however, been direct observation of the grains in standard DC casts, nor is there information on how the morphology and composition of grains evolves during casting. Measurement of floating grain properties can help advance computational macrosegregation models and can offer an intermediate point of comparison for model validation. Techniques from the field of rheocasting as well as technology currently used for inclusion detection may be useful in characterizing the grains.
We hypothesize that direct observation of these floating grains will be possible with molds designed to rapidly quench metal from the sump of DC cast ingots. This project seeks to sample floating grains from ingots during casting in order to quantify their properties. These quantitative measurements can help assess the validity of our current understanding of floating grains in the sump of DC cast ingots.
2 Experimental Procedures
Two sampling techniques were chosen to probe grains from the sump of DC cast aluminum ingots during casting. Copper quenching molds, similar to those developed for rheocasting studies, were used to rapidly solidify samples from the molten metal sump. A molten metal coulter counter, developed for measurement of inclusions, was used to detect grains in the molten sump during casting.
2.1 Molds for Grain Sampling
2.1.1 Surface Quenching (SQ) Mold
Copper (Cu) quenching molds were used to rapidly cool the molten alloy sampled during casting. The surface quenching (SQ) mold was based on the design of Martinez and Flemings. Figure 9A shows the surface quenching mold dimensions. The mold was made of two 13mm thick Cu plates separated by 1mm graphite spacers, which created an opening with dimensions 127mm x 25mm x 1mm. The bottom of the mold was sealed with plastic wrap and the top was connected to vacuum. Samples were obtained by touching the bottom of the mold to the liquid metal surface. The plastic wrap melted and a thin sample of metal was pulled into the mold's opening. The sample was removed with pliers and the plastic wrap was replaced so that the mold could be used again.
2.1.2 Deep Quenching (DQ) Mold
A second Cu mold was designed to obtain samples from up to 0.6m deep in the sump during casting. Figure 9B shows the deep quenching mold dimensions and geometry. It consisted two 19mm thick Cu plates spaced Imm apart by a cut made into one of the plate halves. The opening created was 121mm x 19mm x 1mm. The Cu plates were inserted into two 51mm diameter graphite rings with rope seals. The mold and rings were fit snugly into the bottom of a 91.4cm long silica matrix composite tube (76mm OD, 64mm ID). A refractory cap with a rope seal was inserted into the tube below the mold and a refractory plug attached to a wire was inserted into an opening at the bottom of the
cap i
s51ual tIh mu. I U Lax a saimpie, L1h MIUM was 1o wereU InL Me metal to the desired
depth. The plug was removed to allow metal to pass into the mold's opening. The total sampling process took fewer than 5 seconds.
t To Vac I Graphite . Spacers E 13 m ~IMold Opening 1mm
FJiL
25mmFigure 9: Schematic of molds used for grain mold. (B) Deep quenching (DQ) mold.
+-*-Thermocouple Al-Si Tube 64mm Mol Mo Refractory Cap Refractory
B
,---pug
sampling. (A) Surface quenching (SQ)
Appendix A includes mold temperature profiles during sampling, which were measured with K-type thermocouples inserted into the end of the Cu mold, as shown in Figure 9B. Appendix A also shows calculations for cooling rates, which were estimated based on measurements of secondary dendrite arm spacing in the quenched samples. The average cooling rate for the deep quenching mold starting at room temperature was ~300*C/s. The average cooling rate for the surface quenching mold starting at room temperature was ~500*C/s. Both of these cooling rates created a microstructure of fine
crystals.
2.2
Coulter Counter Grain Measurements
Figure 10 shows a diagram of a molten metal coulter counter. It consists of two tungsten electrodes, one of which is encased in a glass tube with an orifice. For this study, a tube with a standard orifice was used (located 15mm from the bottom of the tube
and 3 0 0pm in diameter). The device was lowered into the molten metal (70mm below the
surface), and a constant current was maintained between the electrodes (60-65Amps).
Cu Plates Graphite Spacers
A
I
I
RCoulter
-CounterApparatus
Argon
A Vac TifI
41
ii
The
Figure 10: Diagram of coulter counter used in molten metal.
The coulter counter uses a vacuum to draw metal into the glass tube and monitors the voltage between the two electrodes as metal flows in. When a particle passes through the orifice, changes in voltage are proportional to the volume of the particle passing through. Appendix B explains how the measured voltage is related to particle volume and why the sign of the voltage change depends on particle conductivity. Particles that are less
conductive than the surrounding liquid (inclusions) will cause positive voltage changes, while particles that are more conductive than the liquid will cause negative change. Appendix B also discusses how the voltage response is sensitive to orifice diameter and shape.
The number of voltage changes (peaks) that occur when a fixed volume of fluid is pulled into the tube (3mL) can be used to determine the concentration. Metal is expelled with argon when it reaches a certain fill level, which is monitored by a thermocouple inside the glass tube.
Generally, the resistivity value used in coulter counter inclusion measurements is that of pure liquid aluminum (2.5x10⁻⁷Qm), and in literature examples of grain detection, the resistivity of pure solid aluminum at 700*C is used.48'49 Appendix B discusses the
sensitivity of particle size measurements to the liquid resistivity values used in the size calculation. It shows that variation in measured particle diameter based on the liquid resistivity value (A14.5%Cu compared to pure Al) can range from 5-40prm depending on particle diameter.
-mocoupl
Electrodes
Glass
Tube
OrfI
Liquid
MetalThe coulter counter's ability to detect conductive aluminum grains was tested by sampling continuously during solidification of a crucible of metal. Appendix C describes the test procedures and presents the resulting particle measurements. The coulter counter was able to detect solid particles, which increased in number as the metal was cooled below the liquidus. Samples from the surface quenching mold confirm the presence of floating solid particles in the liquid.
2.3 DC Casting Apparatus and Procedures
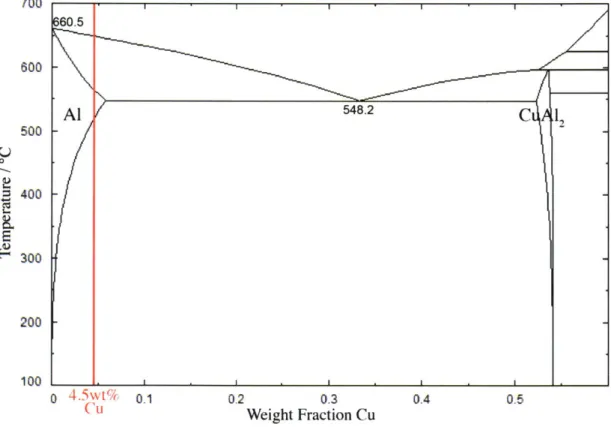
Two ingots of A14.5%Cu were cast using a commercial scale DC casting apparatus. The first ingot was cast using a standard distribution method (hereafter called standard), while the second accelerated the metal with a turbulent jet as used by Wagstaff and Allanore to introduce stirring in the sump of the ingot (hereafter called stirred).' Figure 11 shows the Al-Cu phase diagram, and Table 1 shows relevant properties of this alloy.
Q 0 700 600 500 400 300 200 100 0 4.5wt CU 0.1 0.2 Weight Fraction Cu0.3 0.4 0.5
Figure 11: Al-Cu phase diagram. marked on the diagram.
The alloy cast in these experiments (A14.5%Cu) is
560.5
Al - 548.2CA,
Table 1: Relevant Al-Cu system properties.4 2
1
Property Unit Value
Liquid Density (A14.5%Cu) kg m-3 2460
Solid Density (A14.5%Cu) kg m3 2750
Solid Density (Al) kg m- 2700
Melting Point Pure Al 0C 660.5
Al-Cu Eutectic Temperature 0C 548.2
Al-Cu Eutectic Composition wt% Cu 33
Liquid Diffusivity (A14.5%Cu) m2 s1 5x10⁻⁹
Viscosity (A14.5%Cu) kg m-' s-1 0.0013
Partition Coefficient - 0.171
An A14.5%Cu alloy was melted in a natural gas fired furnace. From the furnace, the metal moved through alumina-silica troughs and 1 Oppm of boron grain refiner was added in the form of 3:1 TiB rod. Hydrogen was removed with a run-through degassing
machine that pumped chlorine and argon through spinning rotors in the metal. Inclusions and impurities were removed with a 30ppi ceramic foam filter.
During the standard cast, the metal moved through a ceramic spout with a pin that allowed for control of metal flow and casting speed. The metal was distributed through a standard fiberglass combo bag into an open-top 1750x600mm WAGSTAFF LHCTM mold. The casting temperature was maintained at 690'C (35'C superheat). The casting speed ramped to a steady state speed of 60mm/min, and the metal level during steady state casting was maintained at 60mm above the tang of the mold.
During the stirred cast, the metal was accelerated downward into the mold through a spout with a 2cm opening. No pin was used for metal flow control, and no combo bag was used for metal distribution. The casting temperature was 690'C, the speed was 60mm/min, and the metal level was maintained at 60mm.
2.3.1 Sampling Locations and Times
Figures 12A and 12B show the sampling locations for the coulter counter and the two quenching molds. The coulter counter was mounted above the head of the ingot 38cm from the short face. The surface quenching mold samples were obtained next to the coulter counter tube insertion point. The deep quenching mold was lowered into the bottom center of the sump diagonally from a position next to the spout.
A
By
Figure 12: Sampling locations for coulter counter and quenching molds in DC cast ingot. (A) Schematic of ingot sump and sampling locations. (B) z-axis view of head of ingot with marked sampling locations.
When the steady state sump was developed, the sump depth was measured from the deep quench sampling location. For each sample, the mold was lowered in the same location to a depth 5cm above the measured sump depth. Four deep quenched samples
Surface
Coulter
Quench
Counter
Deep
Quench
1
1750
x Rolling Face (1.750mm) 0 Coulter Counter 380mm) Deep Quench MoldSurface Quench Mold
were obtained from the sump of the standard ingot at 870, 1230, 1560, and 1945mm in cast length. Five samples were obtained from the surface of the standard cast at 915,
1318, 1520, 1929, and 2553mm in length. The cast lengths for the surface quenching mold correspond to samples obtained by the coulter counter.
The sampling depth for the deep quenching mold in the stirred cast was determined by the same method as the standard cast. Six deep quenched samples were obtained from the sump of the stirred ingot at 915, 1090, 1250, 1510, 1769, and 1973mm in length, and three samples were obtained from the surface at 1670,2190, and 2330mm in length.
The coulter counter was inserted into the ingot during both the stirred and standard casts. The device was preheated over the surface of the metal during cast startup, was inserted at 500mm in cast length to 70mm below the surface, and drew in its first sample at 800mm. The coulter counter sampled continuously until the end of the standard cast. During the stirred cast, the orifice became blocked before sampling could occur.
2.3.2 Samples Obtained During Standard and Stirred Casts
Figure 13 shows an example of a quenched sample and a representative image of sample microstructure. The microstructure of the samples obtained with the quenching molds during DC casts exhibited large grains (presumably those present in the mushy region) that were surrounded by fine crystals (formed during quenching).
Figure 13: (A) Sample obtained with DQ mold. (B) Representative SEM image of quenched microstructure.
2.4 Metallographic Techniques
2.4.1 Sample Preparation
Thin samples from quenching molds were mounted in KonductoMet phenolic mounting compound, ground, and polished to a mirror finish (ending with 0.05pm colloidal silica). A14.5%Cu samples were etched for optical microscopy with Keller's reagent (2.5ml HNO3, 1.5mL HCl, 1.0mL HF, 95mL H20) for 30 seconds. A color
etchant, Wecks reagent (4g KMnO4, 1 g NaOH, IOOmL H20) was used on several
samples to highlight variation in composition (microsegregation) around the grains.4 2.4.2 SEM
A Hitachi SU1510 scanning electron microscope was used for imaging grains, making energy dispersive x-ray spectroscopy measurements, and gathering electron backscatter diffraction data. A 20kV accelerating voltage was used throughout this study. 2.4.3 EDS
Energy dispersive x-ray spectroscopy measurements were made with an Oxford instruments x-act EDS detector SEM attachment and analyzed with AZtec® analysis software.
2.4.4 EBSD
Samples were analyzed with an Oxford Nordlys electron backscatter diffraction detector and AZtec software.
2.4.5 Optical Microscopy
Optical micrographs were obtained with a Nikon Eclipse LV 150 microscope with a l0x magnification eyepiece and lOx-100x objective lenses. The microscope was used in both the bright and dark field settings. A rear polarizer and tinted lens were used to highlight the Cu-rich regions on samples etched with Weck's reagent. The Cu-rich regions were highlighted in the green spectrum, and the Al-rich regions were black. A Nikon Digital Sight D5-2Mv camera and Image Pro 6.3 software were used to obtain images. Optical micrographs were analyzed with open source ImageJ software.
- - - I
3 Results
Floating grains were sampled with the copper quenching molds from both the standard and stirred ingots. The metallographic samples obtained with these molds were analyzed with optical and scanning electron microscopy to determine the floating grain sizes and shapes, and the resulting distributions are presented. Composition
measurements made with energy dispersive x-ray spectroscopy are reported. Particle measurements made with the molten metal coulter counter are also presented.
3.1 Qualitative Analysis of Micrographs
Figure 14 shows representative SEM images of the samples obtained with the copper quenching molds. No large grains were present in the samples quenched from the surface of the standard DC cast (Figure 14A). Floating grains were present in the samples
obtained with the deep quenching mold from the standard ingot (Figure 14B) as well as in the surface and deep quenched samples from the stirred ingot (Figures 14C and 14D). The standard cast contained both globular grains and equiaxed dendrites, as labeled in Figure 14B, while grains from the stirred cast were generally more globular in shape.
Figure 14: Representative SEM images of quenched samples. (A) Standard surface quench. (B) Standard deep quench with examples of equiaxed "dendritic" and "globular" morphologies. (C) Stirred surface quench. (D) Stirred deep quench. Floating grains are visible in all samples except those from the surface of the standard cast.
3.2 Grain Diameters and Shapes
Dark field optical micrographs at 100x magnification of two-dimensional polished and etched planes were used to make grain size and shape measurements. Figure 15A
shows an example unprocessed micrograph, and Figure 15B shows the outlined grains after the image analysis software was used to identify floating grains, separate grains that touch, and record the area and perimeter of each grain. The grain measurements were made based on observable grain boundaries, so grains that appeared to be welded together were counted separately.
00~I
B
Figure 15: Example of grains identified and outlined with image analysis software. The resulting outlines were used to obtain the area and perimeter of each grain. (A) Dark field optical micrograph of floating grains obtained with the deep quenching mold from the stirred ingot. (B) Corresponding outlines of grains identified with image analysis software.
Grains that had been improperly identified by the software were removed from the data set. The total numbers of grains measured were 303, 406, and 209 for the standard deep quench, the stirred deep quench, and the stirred surface quench, respectively.
The measured grain areas were converted to equivalent circular diameters. Figure 16 shows the grain size distribution histograms for floating grains sampled from the standard and stirred casts.
0.16 0.14 0.12 0.1 0.08 0.06 0.04 0.02 0 0.16 0.14 0.12 0.1 0.08 0.06 0.04 0.02 0 0.16 0.14 0.12 0.1 0.08 0.06 0.04 0.02
Standard Deep Quench
A
10 30 50 70 90 110 130 150 170 190
Particle Diameter /pm Stirred Deep Quench
1 30 50 70 90 110 130 150 170 190
Particle Diameter /pm Stirred Surface Quench
10 30 50 70 90 110 130 150 170 190
Particle Diameter /pm
Figure 16: Grain size distributions. (A) Standard deep quench. (B) Stirred deep quench. (C) Stirred surface quench.
1111111212 1 1 a
11
Floating grain diameters range from 15-130pm in both the standard and stirred casts. In the stirred cast, the grain size distributions are shifted toward larger diameters for grains sampled with both the deep and surface quenching molds. The average grain diameters in the stirred cast were 47ym and 52plm for the deep and surface quenching molds, respectively. The grain size distribution from the standard cast is shifted towards smaller diameters relative to the stirred cast. The average measured grain size in the standard cast was 39pm.
The quenched samples were also used to estimate the fraction of solid grains in the measured locations. Area fractions were determined by adding the grain areas for a given micrograph and dividing by the total micrograph area. A 20mm2 region was analyzed on
each sample. The grain area fraction in samples obtained with the deep quenching mold in the standard cast was found to be 0.06. The grain area fractions for the samples from the stirred cast were found to be 0.12 and 0.09 for the deep quenching mold and surface quenching mold, respectively. These area fractions serve as estimates for the volume fraction at each location.
The shape of the grains was analyzed using the two-dimensional form factor proposed by Saltykov.'" This parameter compares the perimeter of a circle of equal area as the grain to the measured grain perimeter. The parameter ranges from 0 to 1, with 1 being a circle. Figure 17 shows the grain shape distribution histograms for each cast.
0.35
0.3 Standard Deep Quench
0.25 0.2 0.15 0.1 0.05 0 0.4 0.8 Shape Factor 0.35
0 Stirred Deep Quench
B
0.25 0.2 0.15 0.1 0.05 0 0 0.4 0.8 Shape Factor 0.35
0 Stirred Surface Quench
S0.25 0.2 0.15 0.1 0.05 0 0 0.4 0.8 Shape Factor
Figure 17: Grain shape factor distributions. (A) Standard deep quench. (B) Stirred deep quench. (C) Stirred surface quench.
The grain shape distributions do not vary significantly for grains sampled with the deep and surface quenching molds from the stirred cast (Figures 17B and 17C). The average form factors were 0.74 and 0.73 for the deep and surface quenching molds, respectively. The grain shape distribution for the standard cast is shifted towards lower form factors (less circular grains) relative to the stirred cast (Figure 17A), with the average form factor being 0.67.
Table 2 summarizes the grain size, shape, and area fraction results. It shows the average grain diameters and grain area fractions as well as the form factors for the entire grain populations and the subset of grains with diameters greater than 40pm. Grains with diameters greater than 40pm made up 35% of the grains captured with the deep
quenching mold in the standard cast, 56% of the grains captured with the deep quenching mold in the stirred cast, and 67% of the grains captured with the surface quenching mold in the stirred cast.
Table 2: Floating grain diameters, form factors, and grain area fraction. Reported error
represents standard deviation from the mean.
Average Grain Grain Saltykov 2D Saltykov 2D
Cast Diameter Area Form Factor Form Factor
(Pm) Fraction (all grains) (grain diameter >40jm)
Standard Cast 39 22 0.06 0.02 0.67 0.18 0.50 0.13 Deep
Quench
Stirred Cast Ded~en Cast47 22 0.12 0.04 0.74 0.13 0.70 0.14 Deep QuenchI Stirred Cast 52 19 0.09 0.04 0.73 0.13 0.70 0.13 Surface QuenchAs shown by the form factors for grains with diameters greater than 40ptm, large grains are generally less spherical than small grains, particularly in the standard cast. The average form factor for grains from the stirred cast decreased to 0.70 for both sampling locations in the stirred cast, and to 0.50 for grains in the standard cast.
3.3 Grain Compositions
Line scan measurements of copper composition were made across several grains obtained from each cast. Figure 18 shows an example line scan for each cast type and an image of the corresponding grain.
-. ~-=~-~==.~- - --- ~---=~---~ -.-- I 0 9 8 7 6 .5 4 3 0 10 9 8 7 6 5 4 3 0
Standard Deep Quench
A
0
50 -40 -30 -20 -10 0 10 20 30 40 5(
Position /pm
Stirred Deep Quench
B
50 -40 -30 -20 -10 0 10 20 30 40 5( Position / pm
-40 -30 -20 -10 0
Position / pm
10 20 30
Figure 18: Line scans showing copper composition as it varies with position in grain. (A) Standard deep quench. (B) Stirred deep quench. (C) Stirred surface quench.
The line scans show that, in both the standard and stirred casts, the floating grains are uniformly depleted in solute. The solute content does not increase gradually moving outward along the radius, and there is an abrupt buildup of solute in the 3-5pm near the grain edges. The line scans have similar profiles regardless of whether the grains are globular (Figures 18A and 18C) or equiaxed dendrites (Figure 18B).
The line scans were used to determine the average and minimum grain compositions for each cast. The average solute concentration includes the buildup of solute observed at the edges of each line scan, while the minimum solute concentration averages only the minimum plateau points. The results are reported in Table 3.
9 8 7 6 .5 4 3 2 0 -L --50
Stirred Surface Quench
C
e
40 50 0
Table 3: Average and minimum solute compositions in the A14.5%Cu standard and stirred ingots. Reported error is the standard deviation from the mean.
Average Minimum
Cast Composition Composition
(wt% Cu) (wt% Cu) Standard Cast 1.40 0.20 1.16 0.09 Deep Quench Stirred Cast Dtree Que h 1.40 0.37 1.04 0.12 Deep Quench Stirred Cast 1.21 0.13 1.09 0.05 Surface Quench
The minimum grain composition in the standard cast ranged from 1.07-1.25wt%Cu, which is a 72-76% depletion from the alloy composition (4.5wt%Cu). The floating grains from the stirred cast do not vary in minimum composition from the grains in the standard
cast. The minimum compositions were 0.92-1.16wt%Cu and 1.04-1.14wt%Cu for the grains obtained with the deep and surface quenching molds, respectively, which is a 74-80% depletion from the alloy composition.
Copper microsegregation in the grain can be observed qualitatively in samples etched with Weck's reagent. Figure 19A and 19B show color etched grains from a sample quenched from the surface of the stirred cast, and Figure 19C shows color etched grains
sampled with the deep quenching mold from the standard cast. A green ring ~3-5pm thick is visible around the edge of the large grains, which is consistent with the region of copper buildup in the line scans. The thickness or intensity of the region of copper buildup does not vary between samples from the stirred or standard cast.
-A--t
Figure 19: Micrographs of samples etched with Weck's reagent and viewed under polarized light. (A, B) Stirred surface quench. (C) Standard deep quench.
3.4 Grain Connectivity
The floating grains obtained from both the standard and stirred casts are found in clusters in the metallographic samples. The scale of agglomerates measured on two-dimensional cross sections was -300pm for the standard cast and -500pm for the stirred cast.
The samples were analyzed using electron backscatter diffraction (EBSD) to differentiate between agglomerated particles and single dendrites based on their crystallographic orientations. In principle, grains that are connected because they are different arms of the same dendrite will have the same crystallographic orientation (and thus the same color in the EBSD map), while individual grains that agglomerated or welded together will not likely have the same crystallographic orientation. Figure 20 shows several EBSD maps on the floating grains quenched from DC cast ingots and corresponding optical micrographs taken at the same location.
;
S 100 p
Figure 20: EBSD maps of grain clusters. (A) Standard deep quench. (B) Stirred deep quench. (C) Stirred surface quench.
The EBSD maps show that in some cases, adjacent grains have the same orientation, but it is rare to find more than two or three grains with the same orientation in a given cluster.
3.5
Coulter Counter Measurements
The coulter counter was inserted into the surface of both the standard and stirred casts. During the stirred cast, no samples were obtained with the coulter counter because the orifice became blocked with solid shortly after insertion of the glass tube. The coulter counter detected particles at the surface of the standard cast. Peak voltage values ranged from 16.7-24.9pV over the background. Assuming solid pure aluminum particles in pure liquid aluminum, these peaks correspond to particles ranging in size from 22-25p.m. The metallographic samples obtained with the surface quenching mold during the standard cast did not show the presence of grains ~25pm in size distinguishable from the fine crystals in the quenched microstructure (Figure 14A). If solid aluminum is nucleating on
TiB2 particles, the total resistivity of the particle would increase (PTiB2-9.OX1O8 m).47
TiB2 particles range from 0.2-6pm, with most particles being less than 2pm in size.3
Assuming that TiB2 grain refiner particles are 2pm and that the resistivity increases
according to the volume fraction TiB2, the total particle diameters would range from
12-13m. Figure 21 shows the average particle size (assuming nucleation on 2pm diameter TiB2 particles) and particle number as a function of cast length.
14 12 - **0e@@@e100 S10 '80 8 -60 6-40 * Particle Diameter 2 -2 *Number of Particles 0 V110 500 1000 1500 2000 2500 3000 Cast Length / cm
Figure 21: Diameter and number of particles measured by coulter counter in standard cast. Particle diameters were calculated assuming that pure aluminum nucleates on TiB2 grain refiner, and particle number reports the total number of particle per sample
4 Discussion
4.1 Floating Grains in Standard DC Cast Ingot
Floating grains were observed in samples obtained with the deep quenching mold from the sump of the standard ingot (Figure 14B). This confirms that free-floating grains exist in the mushy region, and allows for direct measurements of their size, morphology, fraction, and composition at this particular location.
There were no large grains visible in the samples obtained with the surface quenching mold (Figure 14A). Insertion of a thermocouple at the surface sampling location (380mm from the short face as shown in Figure 12B) indicates that the melt temperature is above the liquidus (660-675'C). This is in agreement with ingot temperature measurements from the literature, which report that the melt temperature at this location would not drop below the liquidus until 575-600mm below the metal surface.4 The lack of sampled
grains also indicates that there are no convective flows bringing grains to the surface, as was observed in the stirred ingot. These observations validate the expected grain
concentration of 0 at this location in casting models.
Despite no detection of large floating grains with the surface quenching mold, the coulter counter measured low concentrations of conductive particles when sampling metal from 70mm below the surface. Assuming these are nuclei of aluminum on TiB2 grain refiner particles, the particles would be -12pm in diameter and would be difficult to differentiate from the quenched microstructure.
As expected from the literature, there is a distribution of particle sizes in the ingot.2327 The constant particle diameters used in macrosegregation models in the literature range from 5 to 100pm. 24
,26 The grains measured in the samples obtained from the standard cast
with the deep quenching mold have a distribution of diameters ranging from 15-13Opm and have average diameters of 20-60ym (Figure 16A and Table 2).
Studies of grain size in semi-solid melts show that the particle diameter depends on cooling rate by the same relation as primary dendrite arm spacing.34 The grain
diameters measured from the standard cast can be compared to literature data to estimate the solidification time. For a 20pm particle, the corresponding solidification time is between 10 and 40 seconds. A 60pm particle corresponds to 100-1000 seconds of solidification.
Comparison of the floating grain sizes to the grain sizes measured in the solidified cross section of an ingot cast under the same conditions shows that the grains obtained from the standard ingot with the deep quenching mold are 8-30% of their final grain size. Significant grain growth occurs after the point of sampling, likely once the grains have joined or formed a rigid cohesive network.
Floating grains being solute poor is the basis of the floating grain macrosegregation theory. Measurement of solute (Cu) content on these floating grains confirms that they are solute poor relative to the alloy composition. The leading assumption in