QT Interval Shortening After Bariatric Surgery Depends
on the Applied Heart Rate Correction Equation
Erik K. Grasser1&Barbara Ernst2&Martin Thurnheer2&Bernd Schultes2
Abstract
Background A shortening of electrocardiographic QT interval has been observed in obese subjects after weight loss, but previous results may have been biased by inappropriate heart rate (HR) correction.
Methods Electrocardiography (ECG) recordings of 49 (35 fe-males) severely obese patients before and 12 months after Roux-en-Y gastric bypass (RYGB) surgery were analysed. QT interval (QTc) was calculated by using four different equa-tions, i.e. Bazett, Fridericia, Framingham and Hodges. Results Irrespectively of the used correction formula, QTc inter-val length was reduced after the surgery (QTcBazett−31 ± 18 ms;
QTcFridericia−12 ± 15 ms; QTcFramingham−14 ± 15 ms; QTcHodges
−9 ± 15 ms; all Ps < 0.001), but QTcBazettreduction was signif-icantly greater than the reduction in QTc calculated upon the other three equations (all Ps < 0.001). Moreover, changes in
QTcBazett(P < 0.001) but not in QTcFridericia, QTcFraminghamand
QTcHodges(all Ps > 0.05) were significantly correlated with
con-current changes in HR. Multivariate regression analyses revealed a significant independent association of serum insulin levels with
QTcFridericia, QTcFraminghamand QTcHodgesvalues (all Ps < 0.05)
preoperatively, whilst changes in QTc interval length after the surgery were not consistently associated to concurrent changes in metabolic traits.
Conclusions Our data show that the extent of weight loss-associated QTc interval shortening largely depends on the applied HR correction equation and appears to be overestimated when the most popular Bazett’s equation is used.
Keywords Prolonged QTc . Cardiac hyperpolarization . Morbid obesity . Roux-en Y gastric bypass . Bazett’s formula
Introduction
Obesity is associated with an increased risk for cardiovascular diseases and premature death [1,2]. An abnormal ventricular repolarization, which predisposes to sudden death upon cardi-ac arrhythmia [3], may contribute to the increased mortality risk since obesity has been found to be associated with a high prevalence of a prolonged QT interval in electrocardiographic (ECG) recordings [4]. Furthermore, weight loss, in particular when induced by bariatric surgery, has been found to reduce QT interval (QTc) length in many studies (for overview see Table1) [5–22]. However, the validity of this observation has been challenged by one previous study [9] that demonstrated that the significance of QTc shortening upon weight loss gets lost when the QT interval is corrected for heart rate (HR) by using Fridericia or Framingham correction equation instead of the most commonly used Bazett equation. Indeed, the Bazett equation is known to be most sensitive to biasing effects of HR which appear to be particular important in the context of weight loss since weight loss is often accompanied by a re-duction in HR. It should be noted, however, that the extent of * Bernd Schultes [email protected] Erik K. Grasser [email protected] Barbara Ernst [email protected] Martin Thurnheer [email protected] 1
Department of Medicine/Physiology, University of Fribourg, Fribourg, Switzerland
2 eSwiss Medical and Surgical Center, Interdisciplinary Obesity
Center, St. Gallen, Switzerland
http://doc.rero.ch
Published in "Obesity Surgery 27(4): 973–982, 2017"
which should be cited to refer to this work.
Ta b le 1 Overview on previous studies on the ef fects of weight loss on the length of the corrected QT c interval S tudy Inclu ded subje ct s Interventio n F o llow-up period Ach ieved weight loss Used correction form u la Changes in Q T c interval Changes in hea rt rate (HR) Comment Alpert et al. [ 5 ] n = 3 9 (31 female) wi thou t heart failure (H F ) n = 2 8 (23 female) wi th HF Bariatri c sur gery Nadir of post operati ve weight loss (5.0 ± 0 .6 m o n ths) E st ima te d Δ BM I w as − 10.9 kg/m 2 E st ima te d Δ BM I w as − 13.0 kg/m 2 B azett B azett E st ima te d Δ QT c w as − 34.1 ms E st ima te d Δ QT c w as − 18.2 ms E st ima te d Δ HR was − 0.8 bpm E st ima te d Δ HR was − 0.8 bpm W ei ght loss reduced si gni ficantl y Q T c in se v er ely obese humans w ith and wi tho ut HF . Al-Salameh et al . [ 6 ] n = 2 8 , 25 female Sleeve gastrectomy 3 m o nths after int er v en tion Mean weight loss wa s 2 1±8k g B azett Baze tt − 2 8 ± 1 6 m s N ot mentio ned Sleeve gast re ct omy si gni ficantl y re d uce d Q T c in severely obese humans. P o n tiro li et al. [ 7 ] n = 2 4 , 13 female Gas tric bandi ng vs. hyp ocaloric di et 6 m o n th after gast ric banding Δ BM I w as − 7.5 ± 3.6 kg/ m 2 Not menti oned QT c correlat ed p osit ivel y wi th di astol ic blo od pres sure E st ima te d Δ HR was − 8 bpm W ei ght reduction induced by bariatric sur gery as sociate d w ith recovery of a m o re ph ysio logi ca l au tonomi c con trol of cardiov ascular fun ct ion M u k er jie ta l. [ 8 ] n = 3 9 , 31 female Bariatri c sur gery Nadir of weig ht los s Δ BM I w as − 1 0±2 .7 kg /m 2 B azett Baze tt − 1 8 .2 ± 10.6 ms Δ HR w as − 0.8 ± 2.0 bpm Prosp ec tive cohort study where weight loss in duced chang es o f QT c and le ft ven tricular mass were investigated. Gondon i et al. [ 9 ] n = 2 7 0 , 1 08 fem al e H y pocaloric di et + p hysi ca l act ivit y 23 ± 4 d ay s BMI decreased by 3.1 % B azett F ri dericia F ramin gham Baze tt − 3 m s (s igni ficant decrease) Frid er ic ia +2 ms ( significant in crease) Framingham +2 ms (no n-sign ificant) HR decrea se d b y − 8.3 % Phys ical trai ning and di et did no t relevantly influence Q T c in obese subj ec ts . A la m et al . [ 10 ] n = 1 1, 8 female Gas tric bandi ng (n =6 )a n d bi li opancrea ti c di versio n (n =5 ) 1, 6, 1 2 m o n ths BMI decreased by 24 % at 1 -year fol low -up (both p roc ed ur es combined) B azett F ri dericia Q T c (B aze tt an d Frid er ic ia) did not significantly al ter in resp onse to wei ght loss 12 mont hs after baria tric intervention HR decrea se d si gni ficantl y (− 8.6 bpm) in resp onse to wei ght loss 12 mont hs afte r b aria tr ic intervention Cardiac changes in resp onse to bariatric su rgery depend rat her on w ei ght loss. Russo et al. [ 11 ] n = 1 0 0 , 5 8 fe m ale Bil io-in test inal byp as s 1 2 m onths E sti m at ed Δ BM I w as − 10.4 kg/m 2 B azett Estim at ed Δ QT c w as − 44.6 ms 12 month s after byp as s sur g er y E st ima te d Δ HR was − 10.7 bpm 12 mon ths after by pass sur gery W ei ght loss causes reduction of parameters propo sed to ven tricular repolarization. Bezante et al. [ 12 ] n = 5 5 , 42 female Biliopancreatic di versio n 12 months -61 ± 1 3 % w ei ght lo ss B azett Estim at ed Δ QT c w as − 26 ms 12 months after bariatric intervention QT c w as significantly correla te d w ith HR Biliopancreatic d iversion reduces QT interval in se v er el y obese pati en ts. S ey fe lie ta l. [ 21 ] n = 30 , 2 4 female Convent ional w ei ght loss program 12 weeks Mean weight loss wa s − 14.5 ± 5.0 kg B azett Estim at ed Δ QT c w as − 7m s H R did n o t change Q T c te n ded to be sig nificant ly reduced in res ponse to w ei ght loss but not heart rate . P o n tiro li et al. [ 13 ] n = 4 1 , female 33, hyp er te nsiv es n = 7 5 , female 63, normot ensiv es Gas tric bandi ng 12 months E sti m at ed Δ BM I w as − 8.3 and − 8.0 kg / m 2, respec tively B azett Estim at ed Δ QT c w as − 15.4 ms and − 16 .5 ms, respectively Not mentio ned W ei ght loss significantly reduces QT c. P apaioannou et al . [ 14 ] n = 1 7 , 1 1 female V ertical band gast ropl as ty 8– 10 months Exce ss weigh t loss of 48.7 ± 6.7 % B azett Estim at ed Δ QT c w as − 35 ms E st ima te d Δ HR was − 8 bpm W ei ght loss si gni ficantl y shortened QT c valu es . Gupta et al. [ 15 ] n = 6 3 , 60 female L iqui d protein d iet for 26 weeks 26 weeks Gro up I (n = 57): Estim ated mean Bazett In a subg roup of patie n ts (n = 57), QT c d ec reased
http://doc.rero.ch
Ta b le 1 (continued) Stud y Included su bjects Intervent ion Foll ow-up peri od Achieved wei ght loss Us ed correcti on formula C h an ges in QT c interval C h anges in heart rate (HR) C o mm en t weigh t los s was − 25 k g Group II (n =6 ): Estimated mean weigh t los s was − 28 k g Group I (n = 57): Estimated mean Δ QT c w as − 8m s Group II (n =6 ) Estimated mean Δ QT c w as − 15 ms Group I (n =5 7 ): Estimated mean Δ HR was − 7b p m Group I (n =6 ): Estimated mean Δ HR was − 1 2 bpm si gnifi ca nt ly after weig ht los s. M sh u i et al . [ 16 ] n = 36, 18 fema le Behavioural th er apy combined with very low-calo rie diet 5 y ear 8 % mea n w ei ght loss Baz ett Estimated Δ QT c w as − 11 m s Est imated Δ HR w as 4 bpm W eig ht reducti on sig nificant ly short ened QT c values in obese humans. Pietro belli et al. [ 17 ] n = 30, 15 fema le Bala n ce d formula diet 7 days − 3.9 ± 1.7 kg Baz et t Estimated Δ QT c w as − 7m s, P = 0 .1 1 No measurable ef fect on RR in terval was observed An ameliorat ion of prol onged baseli ne QT c h as bee n observed. Care ll a et al. [ 18 ] n = 522, 41 1 female V ery low-calo ri e diet 26 weeks Me an wei ght lo ss was − 23 k g Baz ett E sti mat ed Δ QT c w as − 10 ms (manually acc es sed) Est imated Δ QT cw as − 10 ms (automa te d acc es sed) Not ment ioned The st udy autho rs concluded th at QT in te rva l sh o rte n s wit h weigh t los s. Doh er ty et al. [ 19 ] n = 1 2 (all female) n = 8 (all female) V ery low-calo ri e diet B ala n ced-de fici t d iet 3, 9, 13, 17, 19 and 45 weeks − 22 .4 kg af ter 4 5 weeks − 14 .5 kg af ter 4 5 weeks Baz ett E sti mat ed Δ QT c w as − 20 ms Est imated Δ QT c w as − 10 ms H R re d u ce d b y − 10 .9 % H R re d u ce d b y − 9.7 % No si gnifi ca n t reducti ons of QT c values in re sponse to weig ht los s Rasmussen et al. [ 20 ] n = 2 2 (all female) Gastro plasty sur gery 6 months Me an weight lo ss was − 28 .4 kg Baz ett E sti mat ed Δ QT c w as − 1m s Not ment ioned W eig ht los s due to gast roplast y sur g er y di d not im pac t o n Q T c. C o rb ie ta l. [ 22 ] n = 6 6 obese women, 30 WHR >0.85 (group A), 36 WHR ≤ 0.8 5 (group B), n = 2 5 nono bese co ntrol w ome n M u lti dis ci pli nary approach (diet, exerc ise, behaviou ra l an d nutri ti onal counsel lin g 6, 12 mont hs Est imated Δ BMI was − 5.0 and 4.6 k g/m 2, respectively Baz et t Decrea se of QT c interval and QT c dis persion w as greater in group A than grou p B (P <0 .0 1a n d P < 0.02, respectively). Not mentioned Decline in weight loss was correlated with decline in QT c.
http://doc.rero.ch
weight loss induced by a hypocaloric diet and exercise in the abovementioned negative study [9] was only moderate, i.e. a BMI reduction of −1.2 kg m−2. Thus, the finding of un-changed QTc interval length after weight loss in this study may not pertain to greater amounts of weight loss as typically achieved by bariatric surgery. Support for this assumption may generate from a recent meta-analysis of 11 studies that investigated QT intervals after weight loss [23]. Here, it was found that the reduction of QTc interval length was more pronounced in the six studies in which the weight loss was achieved by bariatric surgery than in the five studies that used non-surgical measures.
An intriguing previous finding in the context of QTc inter-val investigation after bariatric surgery was that a shortening was already observed 4 weeks after biliopancreatic diversion (BPD) surgery in one study [12]. Moreover, despite a marked progressive weight loss, a further shorting of QTc was not observed thereafter [12]. This finding suggests that QTc inter-val shorting might not only represent a consequence of weight loss [6, 12] but could also result from dramatic metabolic changes as a consequence of bariatric surgery. Insulin may play a particular role in this context, since bariatric surgery has been shown to rapidly reduce circulating insulin levels [24]. Moreover, several previous cross-sectional studies have revealed an independent association between circulating insu-lin levels and QTc interval length [25,26]. Interventional stud-ies, however, have revealed a less consistent picture where intravenous insulin infusion acutely increased QTc interval length in normal weight [27] but not in obese subjects [28] under euglycemic conditions.
Therefore, we addressed two questions in the present study: Firstly, does, and if so to what extent, shorting the QTc interval length after bariatric surgery depends on the used HR correc-tion equacorrec-tion, and, secondly, are changes in QTc interval length related to concurrent changes in circulating insulin levels or other metabolic traits?
Methods
Selection of Patients and Study Design
For the purpose of our study, we extracted data from a large, prospectively maintained database including data from se-verely obese subjects who have undergone bariatric surgery. Inclusion criteria for the study were the existence of an ECG recording within 3 months before and 1 year after bariatric surgery. Exclusion criteria were the intake of any drugs known to affect QTc interval length [29], a known heart disease and any kind of arrhythmia or bundle blocks in the ECG record-ings. We identified 49 severely obese patients who fulfilled these criteria. Concurrent clinical data including anthropomet-ric measures, blood pressure and metabolic blood parameters
were also extracted from the database. Nine (18 %) of 49 obese patients had type 2 diabetes with 5 of them taking oral anti-diabetic drugs alone and 4 of them in combination with insulin.
Surgical Procedure
All procedures were carried out by the same surgeon (Martin Thurnheer). Seven subjects underwent a standard proximal Roux-en Y gastric bypass (RYGB) procedure and 42 subjects a distal RYGB variant as previously described [30].
Clinical Assessments
All subjects underwent a standardized clinical assessment be-fore and 1 year after RYGB surgery. This included a venous blood sampling in the morning (8:00–10:00 h) after overnight fasting, the measurement of body weight, waist circumfer-ence, brachial blood pressure by use of appropriate, arm cir-cumference adjusted cuffs (OSZ 5 Easy, Welch Allyn, Jungingen, Germany), an bioelectrical impedance analysis for determination of body composition (Nutriguard-M, Data-Input GmbH, Darmstadt, Germany) and a 12-lead ECG re-cording (Schiller CS-200, Schiller Medizintechnik GmbH, Germany), which was measured in a supine position after a rest of at least 10 min. Glucose, insulin, triglycerides, low-density and high-low-density lipoproteins and high sensitive C-reactive protein (hsCRP) concentrations were measured in serum samples.
ECG Analyses
Electronically recorded ECGs were analysed in accordance to current recommendations [31]. HR was calculated upon re-spective RR intervals. QTc was measured from the earliest onset of the Q-wave to the latest end of the T-wave. In the presence of a U-wave, the T-wave end was defined by the nadir between the two of them. At least three consecutive beats were analysed and respective QT intervals were aver-aged for further analysis. To avoid inter-observer bias, all analyses of ECG recordings were performed by one examiner (Erik Konrad Grasser).
Correction of QT intervals for HR (RR interval) was per-formed by using the following four established equations: Bazett’s equation (QTc = QT/RR0.5
) [32], Fridericia’s
equa-tion (QTc = QT/RR0.33) [33], Framingham’s equation
(QTc = QT + 0.154 (1000− RR)) [34] and Hodges’s equation
(QTc = QT + 1.75 (heart rate− 60)) [35].
QT dispersion (QTD) was assessed as the difference between the maximum QT interval (QTmax) and the minimum QT inter-val (QTmin) length across the 12 leads. Corrected QT dispersion (QTcD) was calculated by correcting QTmaxand QTminby using the four different equations, i.e. Bazett, Fridericia, Framingham
and Hodges (QTcDBazett, QTcDFridericia, QTcDFramingham and
QTcDHodges), before subtracting respective QTcmin from
QTcmaxvalues.
Calculations and Statistical Data Analysis
The following indices were calculated upon the assessed data: homeostasis model assessment (HOMA), i.e. an estimate of in-sulin resistance (HOMA-IR), was calculated by using the follow-ing formula: HOMA-IR = [fastfollow-ing insulin (μIU mL−1) x fasting glucose (mmol L−1)] / 22.5 [36]. Excessive weight loss (EWL %) was calculated as (preoperative weight minus current weight) / (preoperative weight minus height [cm] + 100) × 100. Total weight loss [kg] was calculated as current weight minus preop-erative weight and relative weight loss [%] as (current weight minus preoperative weight) / (preoperative weight) × 100.
All data are reported as means ± standard deviation (SD). Variables were tested for normality using the D’Agostino Pearson omnibus normality test. Pairwise comparisons were performed using a paired Student’s t test. Repeated measures ANOVA with the Newman-Keuls post hoc testing was used to compare between the four corrected QT intervals and disper-sions. Prevalence of patients with QTc prolongation >440 ms before vs. after RYGB surgery was compared by McNemar test. Pearson correlation analysis was used to assess associa-tions between QTc changes in QTc intervals (i.e.ΔQTc = QTc after RYGB − QTc before RYGB) and other concurrently assessed variables. Multivariate regression analyses were per-formed to detect independent associations. All reported P values are two sided. For all tests, significance was set at P < 0.05.
Results
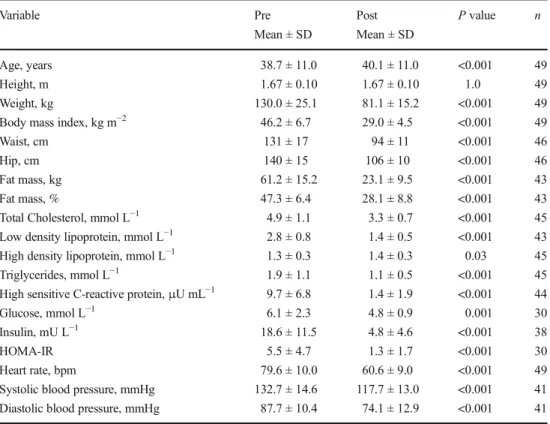
Data on anthropometric, cardiovascular and metabolic vari-ables before and 1 year after the RYGB surgery are provided in Table2. The average weight loss across the 1-year postop-erative period was 48.9 ± 14.8 kg which translates to a relative weight loss of 37.2 ± 6.5 %, a BMI loss of 17.3 ± 4.4 kg m−2 and a EWL of 72.4 ± 18.6 % (all P < 0.001). Body fat mass (FM), percentage FM and waist circumference were also sig-nificantly reduced after the surgery (all Ps < 0.001). Importantly, HR decreased on average by 19.1 ± 10.4 bpm, as did SBP and DBP (all Ps < 0.001).
Metabolic blood variables were markedly improved af-ter the surgery as glucose, insulin, HOMA-IR, hsCRP, tri-glycerides, total cholesterol and low-density lipoprotein levels were significantly lower and high-density lipopro-tein levels significantly higher after than before the surgery (all Ps < 0.05).
QTc Interval Length Before and After RYGB Surgery
QTc values calculated upon the different correction equations before and after the RYGB surgery are provided in Table3. Before the RYGB surgery, QTc intervals calculated upon the Bazett’s equation were significantly longer than calculated upon the three other equations (P < 0.001 for all comparisons). One year after the RYGB surgery, QTcBazettinterval length was on average−30.6 ± 18.2 ms shorter than before the sur-gery (P < 0.001). The extent of QTc shortening was much smaller when the other three correction equations were used
(QTcFridericia−11.5 ± 14.7 ms, QtcFramingham−13.5 ± 14.8 ms,
QTcHodges- 9.0 ± 14.6 ms; all Ps < 0.001 for comparison with
ΔQTcBazett,; Fig.1) but still significant (all Ps < 0.001 for
comparison with corresponding preoperative values). The number of patients showing a QTcBazettinterval length of greater than 440 ms significantly decreased from 14 preop-eratively to 2 postoppreop-eratively (P < 0.001), whilst with the other correction equations, only 3 to 1 patients showed a QTc interval length >440 ms before the surgery and none of the patients after the surgery.
Correlation and Multivariate Regression Analyses Before RYGB Surgery
Preoperative QTcBazettdid not correlate with any other of the assessed variables (P > 0.05), whilst QTcFridericiainversely correlated with body weight (r =−0.40; P = 0.004), hip cir-cumference (r =−0.32; P = 0.03) and waist circumference (r =−0.35; P = 0.02). QTcFraminghaminversely correlated with HR (r =−0.29; P = 0.04), weight (r = −0.42; P = 0.003), hip circumference (r =−0.34; P = 0.02) and waist circumference (r =−0.36; P = 0.01). QTcHodgeswas inversely correlated with weight (r =−0.34; P = 0.02).
Multivariate regression analysis indicated no significant association of any of the assessed variable with QTcBazett be-fore the surgery. In contrast, respective analysis on the other three QTc variables, i.e. QTcFridericia, QTcFramingham and
QTcHodges, showed a very consistent picture with preoperative
values being significantly related to HR and insulin (Table4). Correlation and Multivariate Regression Analyses After RYGB Surgery
In response to RYGB surgery, changes in QTc interval length (ΔQTc) correlated with changes in HR (ΔHR) when using the Bazett’s equation (P < 0.001), which could not be found when using Fridericia’s (P = 0.73), Framingham’s (P = 0.91) or Hodges’s equation (P = 0.88) (Fig. 2). Interestingly, irrespectively of the used correction equation, changes in the QTc interval length (ΔQTc) did not correlate with preopera-tive QTc values (all Ps > 0.09; Fig.3).
Postoperative changes in the QTcBazett interval length (ΔQTcBazett) were significantly correlated with changes in BMI (r = 0.32; P = 0.03), absolute weight loss (r = 0.31; P < 0.05), HR (r = 0.60; P < 0.001) and hsCRP levels (r = 0.38; P < 0.05). Postoperative changes in QTcHodgeswere significantly correlated with changes in total cholesterol (r = 0.37; P < 0.05) and LDL (r = 0.33;
P < 0.05) levels. No bivariate correlations were found be-tween the assessed variables and changes in QTcFridericia and QTcFraminghamvalues.
Multivariate regression analysis revealed that changes in
QTcBazettwere independently associated with changes in HR
(R2= 0.29; B = 0.69; SEM = 0.26; P < 0.05) and changes in
QTcHodgeswere independently associated with changes in total
Table 2 Anthropometric, blood and cardiovascular data of subjects before (pre) and 12 months after (post) Roux-en-Y gastric bypass (RYGB)
Variable Pre Mean ± SD Post Mean ± SD P value n Age, years 38.7 ± 11.0 40.1 ± 11.0 <0.001 49 Height, m 1.67 ± 0.10 1.67 ± 0.10 1.0 49 Weight, kg 130.0 ± 25.1 81.1 ± 15.2 <0.001 49
Body mass index, kg m−2 46.2 ± 6.7 29.0 ± 4.5 <0.001 49
Waist, cm 131 ± 17 94 ± 11 <0.001 46
Hip, cm 140 ± 15 106 ± 10 <0.001 46
Fat mass, kg 61.2 ± 15.2 23.1 ± 9.5 <0.001 43
Fat mass, % 47.3 ± 6.4 28.1 ± 8.8 <0.001 43
Total Cholesterol, mmol L−1 4.9 ± 1.1 3.3 ± 0.7 <0.001 45
Low density lipoprotein, mmol L−1 2.8 ± 0.8 1.4 ± 0.5 <0.001 43
High density lipoprotein, mmol L−1 1.3 ± 0.3 1.4 ± 0.3 0.03 45
Triglycerides, mmol L−1 1.9 ± 1.1 1.1 ± 0.5 <0.001 45
High sensitive C-reactive protein,μU mL−1 9.7 ± 6.8 1.4 ± 1.9 <0.001 44
Glucose, mmol L−1 6.1 ± 2.3 4.8 ± 0.9 0.001 30
Insulin, mU L−1 18.6 ± 11.5 4.8 ± 4.6 <0.001 38
HOMA-IR 5.5 ± 4.7 1.3 ± 1.7 <0.001 30
Heart rate, bpm 79.6 ± 10.0 60.6 ± 9.0 <0.001 49
Systolic blood pressure, mmHg 132.7 ± 14.6 117.7 ± 13.0 <0.001 41
Diastolic blood pressure, mmHg 87.7 ± 10.4 74.1 ± 12.9 <0.001 41
Statistical analysis was performed using a paired students t test, and P < 0.05 was considered as significant difference
n number of patients, SD standard deviation, HOMA-IR homeostasis model assessment of insulin resistance
Table 3 Calculations of average QT and corrected QT intervals (QTc) and presentation of patients
with QTc≥ 440 ms before (pre)
and after (post) gastric bypass surgery using four different equations to calculate QTc (n = 49, 35 females)
QT QTcBazett QTcFridericia QTcFramingham QTcHodges
Pre, ms 374 ± 26 429 ± 21 410 ± 20b 410 ± 18b 409 ± 19b
Post, ms 399 ± 24 398 ± 23 398 ± 19 397 ± 20 400 ± 19
P valuea <0.001 <0.001 <0.001 <0.001 <0.001
Patients≥440 ms – QTcBazett QTcFridericia QTcFramingham QTcHodges
Pre, n (%) – 14 (29 %) 3 (6 %) 3 (6 %) 1 (2 %)
Post, n (%) – 2 (4 %) 0 (0 %) 0 (0 %) 0 (0 %)
P value – < 0.001 – – –
All data are expressed as the mean ± SD, and statistical significance was set at P < 0.05. No changes were found comparing the postsurgery QTc intervals
QTcBazettQTc evaluation using Bazett’s formula (QTc = QT/RR0.5), QTcFridericiaQTc evaluation using Friderica’s
formula (QTc = QT/RR0.33), QTcFraminghamQTc evaluation using Framingham’s formula (QTc = QT + 0.154
(1000− RR)), QTcHodgesQTc evaluation using Hodges’s formula (QTc = QT + 1.75 (heart rate − 60))
a
Comparisons between pre and post conditions were performed using a paired t test
b
P < 0.005, statistical significant difference compared with pre-QTcBazettusing repeated measures ANOVA with
Newman-Keuls post hoc testing
cholesterol (R2= 0.3; B = 16.5; SEM = 4.1; P = 0.001) and LDL (R2= 0.21; B =−14.8; SEM = 5.7; P < 0.05).
QT Dispersion
QTD values did not significantly change after the RYGB sur-gery (before 40.0 ± 14.4 vs. after 41.7 ± 14.5 ms; P = 0.58). This was also true after correcting QTD for HR by using the correction equations (before vs. after; QTcDBazett45.2 ± 16.3 vs. 41.1 ± 14.0 ms; P = 0.19; QTcDFridericia43.3 ± 15.6 vs. 41.0 ± 14.1 ms; P = 0.47; QTcDFramingham40.0 ± 14.4 vs. 41.7 ± 14.5 ms; P = 0.58; QTcDHodges 40.0 ± 14.4 vs. 41.7 ± 14.4ms; P = 0.58). Of note, there were differences between QTcD calculated upon the four different equations neither before nor after the RYGB surgery (all Ps > 0.25).
Discussion
To our best knowledge, we are the first to show a consistent reduction of QTc interval length by using four different QT correction equations in response to excessive weight loss after undergoing a RYGB surgery procedure. However, the extent of QTc interval shortening clearly depends on the applied correction equation with an overestimation when using Bazett’s equation, which also appears to be most sensitive to changes in HR. Furthermore, whilst QTc interval length ap-pears to be cross-sectionally associated with serum insulin levels, postoperative changes in the hormone concentrations as well as in other assessed metabolic variables were not found to be consistently associated with QTc interval shorting re-corded 1 year after RYGB surgery. Taken together, our find-ings clearly support the previous notion of a QTc interval shorting associated with weight loss, the underlying mecha-nisms of which require further investigations.
An abnormal QTc prolongation represents an independent risk factor for sudden cardiac death [3,31]. In our study, 29 % of the severely obese patients showed a QTc interval length above 440 ms when the Bazett formula was used for HR correction. Moreover, the percentage of patients showing a QTc interval length above this cutoff was markedly reduced to 4 % after the RYGB surgery. In light of this finding, it is tempting to conclude that an improvement of ventricular re-polarization could represent a relevant factor for the reduction of mortality upon bariatric surgery that has previously been documented in large-scale observational studies [37, 38]. However, this notion is clearly challenged by our observation of substantial reduced patients showing prolonged QTc inter-vals when a correction equation other than Bazett’s has been used. Moreover, the lack of any correlation between the pre-operative QTc interval length and respective changes after the surgery renders it rather unlikely that the shorting of QTc intervals represents a normalization of a pathological condi-tion associated with the weight loss. Of note, to date it is not even clear whether the obesity-associated QT interval prolon-gation and its reduction after weight loss is overall related to the incidence of cardiac arrhythmia that can result in sudden cardiac deaths. Further studies exploiting technologies for
Table 4 Multivariate regression model with QTcFridericia,QTcFraminghamand QTcHodgesas dependent variable prior to RYGB surgery (n = 49, 35
females)
Heart rate Insulin
R2 B SEM P value R2 B SEM P value
QTcFridericia 0.33 −1.53 0.37 0.001 0.19 0.84 0.34 <0.05
QTcFramingham 0.36 −1.48 0.34 0.001 0.19 0.80 0.31 <0.05
QTcHodges 0.26 −1.28 0.38 <0.01 0.17 0.75 0.34 <0.05
HR heart rate, SEM standard error of the means
Fig. 1 QTc changes in 49 subjects (35 females) (i.e. QTc after RYGB
subtracted by QTc before RYGB =ΔQTc) depicted as scatter dot plot
(means ± SD) using four different QT correction equations (i.e. QTcBazett,
QTcFridericia, QTcFraminghamand QTcHodges). Repeated measures ANOVA
with Newman-Keuls post hoc testing was used to compare changes in QTc between the four equations and statistical significance was set at P < 0.05. **P < 0.01, statistical significant difference between QTcHodgesand QTcFraminghamand ***P < 0.005, statistical significant
difference between QTcBazettand QTcFridericia, QTcFramingham and
QTcHodges
Fig. 2 Linear regression analysis in 49 subjects (35 females) including statistics (Pearson correlation coefficient r and the corresponding P value) for the relation between mean changes in QTcBazett(a), QTcFridericia(b),
QTcFramingham(c) and QTcHodges
(d) to mean changes in heart rate (HR) (i.e. HR after RYGB subtracted by HR before
RYGB =ΔHR). P < 0.05 was
considered as statistical significant
Fig. 3 Linear regression analysis in 49 subjects (35 females) including statistics (Pearson correlation coefficient r and the corresponding P value) for the
relation between QTcBazett(a),
QTcFridericia(b), QTcFramingham(c)
and QTcHodges(d) before RYGB
to their respective mean changes (i.e. QTc after RYGB subtracted
by QTc before RYGB =ΔQTc).
P < 0.05 was considered as statistical significant
continuous cardiac monitoring such as implantable loop re-corders are needed to answer this important question in the future.
The mechanisms underlying QTc interval shortening as a consequence of weight loss remain largely unknown. In our study, we were unable to find a consistent association of any of the assessed metabolic variables with postoperative changes in QTc interval length. In particular, we did not find a correlation between the postoperative decline in circulating insulin levels and the QTc interval shortening. Insulin appeared to be a most likely mediator of the weight loss associated QT interval reduc-tion [39] since the hormone is well known to increase sympa-thetic nervous system (SNS) activity [40] and circulating cate-cholamine levels [41] that strongly affect myocardial repolari-zation. In light of our data, however, it appears rather unlikely that the reduction of circulating insulin levels represent a major factor in this context. Since RYGB surgery is known to induce such a wide range of metabolic changes [42], it appears still likely that specific metabolic or endocrine signals that we have not captured in our study contribute to the observed QTc interval shortening. For instance, free fatty acids (FFAs) may represent a good candidate since one previous study [22] has found a cor-relation between the decline in circulating FFA levels and the QTc interval length reduction after diet-induced weight loss. Also, the adipose tissue hormone leptin may be a good candi-date since it was shown to decline after bariatric surgery along with a marked reduction in SNS activity [43]. Beside these putative hormonal mediators, other mechanisms may also con-tribute to the weight loss associated reduction in QT interval length. For instance, it is well documented that obesity leads to enhanced cardiac fat deposits, which might also impact on ventricular repolarization, but are likely decline with weight loss. Also, a reduction in subclinical ventricular hypertrophy or sleep apnoea/hypopnoea after bariatric surgery that has not been captured in our current study could have an important impact on myocardial repolarization. Putting this forward, fur-ther research is clearly in need to pinpoint the underlying mech-anisms of weight loss associated QT interval length reduction.
QT dispersion did not change after RYGB surgery in our study, i.e. a finding that is in contrast to previous findings. A recent meta-analyses of seven studies [23] investigating QT dispersion after weight loss found a reduction of QT dispersion in six of the studies. Of note, QT dispersion was corrected for HR by using the Bazett’s equation in five of these studies and HR changes associated with weight loss were reported only in four of these studies, with two of them showing a clear reduction in HR. Overall, there is no evidence that QT dispersion depends on HR and it has elegantly been shown that a QT dispersion correction for HR by using the Bazett’s equation can produce invalid results in particular when there is a difference in HR [44]. On the background of our negative finding and the outlined methodological considerations, we believe that it re-mains unclear whether or not weight loss affects QT dispersion.
Several limitations of our study should be mentioned. First, the limited number of patients and the overrepresentation of women did not allow us to test for putative sex differences. Second, since our study includes patients with diabetes, albeit to a very limited percentage, i.e. 18 %, we cannot exclude that established autonomic neuropathy have biased QT interval results in some of the patients. Lastly, we were unable to obtain data on SNS activity, sleep-related disordered breathing and other variables that could contribute to the reduction of QTc interval length after the surgically induced weight loss.
Conclusion
The findings of our study clearly support the previous notion of QTc interval shortening in response to weight loss. However, our finding that the extent of QTc interval changes in response to a bariatric surgery induced weight loss largely depends on the applied HR correction equation calls the clin-ical significance of obesity and weight loss associated QTc interval alterations into question. Thus, our results may stim-ulate other researchers to also apply other than Bazett’s cor-rection equation in future studies and probably also on already existing database, in order to elucidate the important question as to whether the weight loss associated QT interval shorten-ing reduces the risk of cardiac arrhythmia and sudden death in obesity.
Acknowledgment We are very grateful to Dr. Cathriona R. Monnard,
Ph.D. (Department of Physiology/Medicine, University of Fribourg, Switzerland) for improving the English language of this manuscript.
Conflict of Interest The authors declare that they have no conflict of
interest.
Ethical Approval All procedures performed in studies involving
hu-man participants were in accordance with the ethical standards of the institutional and/or national research committee and with the 1964 Helsinki Declaration and its later amendments or comparable ethical standards.
Informed Consent Informed consent was obtained from all individual
participants included in the study.
References
1. Poirier P, Giles TD, Bray GA, et al. Obesity and cardiovascular
disease: pathophysiology, evaluation, and effect of weight loss—
an update of the 1997 American Heart Association scientific state-ment on obesity and heart disease from the obesity committee of the council on nutrition, physical activity, and metabolism. Circulation.
2006;113:898–918.
2. Plourde B, Sarrazin JF, Nault I, et al. Sudden cardiac death and
obesity. Expert Rev Cardiovasc Ther. 2014;12:1099–110.
3. Straus S, Kors JA, De Bruin ML, et al. Prolonged QTc interval and
risk of sudden cardiac death in a population of older adults. J Am
Coll Cardiol. 2006;47:362–7.
4. Frank S, Colliver JA, Frank A. The electrocardiogram in obesity:
statistical analysis of 1,029 patients. J Am Coll Cardiol. 1986;7: 295–9.
5. Alpert MA, Nusair MB, Mukerji R, et al. Effect of weight loss on
ventricular repolarization in normotensive severely obese patients
with and without heart failure. Am J Med Sci. 2015;349:17–23.
6. Al-Salameh A, Allain J, Jacques A, et al. Shortening of the QT
interval is observed soon after sleeve gastrectomy in morbidly
obese patients. Obes Surg. 2014;24:167–70.
7. Pontiroli AE, Merlotti C, Veronelli A, et al. Effect of weight loss on
sympatho-vagal balance in subjects with grade-3 obesity: restrictive surgery versus hypocaloric diet. Acta Diabetol. 2013;50:843–50.
8. Mukerji R, Petruc M, Fresen JL, et al. Effect of weight loss after
bariatric surgery on left ventricular mass and ventricular repolariza-tion in normotensive morbidly obese patients. Am J Cardiol.
2012;110:415–9.
9. Gondoni LA, Titon AM, Montano M, et al. The myth of QT
short-ening by weight loss and physical training in obese subjects with
coronary heart disease. Obesity (Silver Spring). 2011;19:200–3.
10. Alam I, Lewis MJ, Lewis KE, et al. Influence of bariatric surgery on
indices of cardiac autonomic control. Auton Neurosci. 2009;151: 168–73.
11. Russo V, Ammendola E, De Crescenzo I, et al. Effect of weight loss
following bariatric surgery on myocardial dispersion of
repolariza-tion in morbidly obese patients. Obes Surg. 2007;17:857–65.
12. Bezante GP, Scopinaro A, Papadia F, et al. Biliopancreatic diversion
reduces QT interval and dispersion in severely obese patients.
Obesity (Silver Spring). 2007;15:1448–54.
13. Pontiroli AE, Pizzocri P, Saibene A, et al. Left ventricular
hypertro-phy and QT interval in obesity and in hypertension: effects of weight loss and of normalisation of blood pressure. Int J Obes Relat Metab Disord. 2004;28:1118–23.
14. Papaioannou A, Michaloudis D, Fraidakis O, et al. Effects of
weight loss on QT interval in morbidly obese patients. Obes Surg. 2003;13:869–73.
15. Gupta AK, Xie B, Thakur RK, et al. Effect of weight loss on QT
dispersion in obesity. Indian Heart J. 2002;54:399–403.
16. Mshui ME, Saikawa T, Ito K, et al. QT interval and QT dispersion
before and after diet therapy in patients with simple obesity. Proc
Soc Exp Biol Med. 1999;220:133–8.
17. Pietrobelli A, Rothacker D, Gallagher D, et al. Electrocardiographic
QTc interval: short-term weight loss effects. Int J Obes Relat Metab Disord. 1997;21:110–4.
18. Carella MJ, Mantz SL, Rovner DR, et al. Obesity, adiposity, and
lengthening of the QT interval: improvement after weight loss. Int J
Obes Relat Metab Disord. 1996;20:938–42.
19. Doherty JU, Wadden TA, Zuk L, et al. Long-term evaluation of
cardiac function in obese patients treated with a very-low-calorie diet: a controlled clinical study of patients without underlying
car-diac disease. Am J Clin Nutr. 1991;53:854–8.
20. Rasmussen LH, Andersen T. The relationship between QTc
chang-es and nutrition during weight loss after gastroplasty. Acta Med Scand. 1985;217:271–5.
21. Seyfeli E, Duru M, Kuvandik G, et al. Effect of weight loss on QTc
dispersion in obese subjects. Anadolu Kardiyol Derg. 2006;6:126–
9.
22. Corbi GM, Carbone S, Ziccardi P, et al. QT intervals in obese
women with visceral adiposity: effects of sustained weight loss over
1 year. J Clin Endocrinol Metab. 2002;87:2080–3.
23. Omran J, Firwana B, Koerber S, et al. Effect of obesity and weight
loss on ventricular repolarization: a systematic review and
meta-analysis. Obes Rev. 2016;17(6):520–30.
24. Ferrannini E, Mingrone G. Impact of different bariatric surgical
procedures on insulin action andβ-cell function in type 2 diabetes.
Diabetes Care. 2009;32:514–20.
25. van Noord C, Sturkenboom M, Straus S, et al. Serum glucose and
insulin are associated with QTc and RR intervals in nondiabetic
elderly. Eur J Endocrinol. 2010;162:241–8.
26. Brown DW, Giles WH, Greenlund KJ, et al. Impaired fasting
glu-cose, diabetes mellitus, and cardiovascular disease risk factors are associated with prolonged QTc duration. Results from the third national health and nutrition examination survey. J Cardiovasc
Risk. 2001;8:227–33.
27. Gastaldelli A, Emdin M, Conforti F, et al. Insulin prolongs the QTc
interval in humans. Am J Physiol Regul Integr Comp Physiol.
2000;279:R2022–5.
28. Iacobellis G, Curione M, Di Bona S, et al. Effect of acute
hyperinsulinemia on ventricular repolarization in uncomplicated
obesity. Int J Cardiol. 2005;99:161–3.
29. Yap YG, Camm AJ. Drug induced QT prolongation and torsades de
pointes. Heart. 2003;89:1363–72.
30. Thurnheer M, Bisang P, Ernst B, et al. A novel distal very long
roux-en y gastric bypass (DVLRYGB) as a primary bariatric pro-cedure—complication rates, weight loss, and nutritional/metabolic
changes in the first 355 patients. Obes Surg. 2012;22:1427–36.
31. Moss AJ. Measurement of the QT interval and the risk associated
with QT(c) interval prolongation—a review. Am J Cardiol. 1993;72:B23–5.
32. Bazett HC. An analysis of the time-relations of electrocardiograms.
Ann Noninvasive Electrocardiol. 1997;2:177–94.
33. Fridericia LS. Die Systolendauer im Elektrokardiogramm bei
normalen Menschen und bei Herzkranken. Acta Med Scand. 1920;53:469–86.
34. Sagie A, Larson MG, Goldberg RJ, et al. An improved method for
adjusting the QT interval for heart rate (the Framingham Heart Study. Am J Cardiol. 1992;70:797–801.
35. Hodges M, Salerno Q, Erlien D. Bazett’s QT correction reviewed.
Evidence that a linear qt correction for heart rate is better. J Am Coll Cardiol. 1983;1:694.
36. Matthews DR, Hosker JP, Rudenski AS, et al. Homeostasis model
assessment: insulin resistance and beta-cell function from fasting plasma glucose and insulin concentrations in man. Diabetologia.
1985;28:412–9.
37. Adams TD, Davidson LE, Litwin SE, et al. Health benefits of
gas-tric bypass surgery after 6 years. JAMA. 2012;308:1122–13.
38. Sjöström L, Peltonen M, Jacobson P, et al. Bariatric surgery and
long-term cardiovascular events. JAMA. 2012;307:56–65.
39. Maser RE, Lenhard MJ, Peters MB, et al. Effects of surgically
induced weight loss by roux-en-Y gastric bypass on cardiovascular
autonomic nerve function. Surg Obes Relat Dis. 2013;9:221–6.
40. Anderson EA, Hoffman RP, Balon TW, et al. Hyperinsulinemia
produces both sympathetic neural activation and vasodilation in
normal humans. J Clin Invest. 1991;87:2246–52.
41. Kern W, Peters A, Born J, et al. Changes in blood pressure and
plasma catecholamine levels during prolonged hyperinsulinemia.
Metabolism. 2005;54:391–6.
42. Gralka E, Luchinat C, Tenori L, et al. Metabolomic fingerprint of
severe obesity is dynamically affected by bariatric surgery in a
procedure-dependent manner. Am J Clin Nutr. 2015;102:1313–22.
43. Seravalle G, Colombo M, Perego P, et al. Long-term
sympathoinhibitory effects of surgically induced weight loss in
severe obese patients. Hypertension. 2014;64:431–7.
44. Malik M, Camm AJ. Mystery of QTc interval dispersion. Am J
Cardiol. 1997;79:785–7.