Degree Programme
Life Technologies
Major Biotechnology
Bachelor’s thesis
Diploma 2016
Zuber Boris
I
I
s
s
o
o
l
l
a
a
t
t
i
i
o
o
n
n
a
a
n
n
d
d
c
c
h
h
a
a
r
r
a
a
c
c
t
t
e
e
r
r
i
i
z
z
a
a
t
t
i
i
o
o
n
n
o
o
f
f
s
s
e
e
a
a
u
u
r
r
c
c
h
h
i
i
n
n
P
P
.
.
l
l
i
i
v
v
i
i
d
d
u
u
s
s
m
m
i
i
c
c
r
r
o
o
b
b
i
i
o
o
t
t
a
a
f
f
r
r
o
o
m
m
c
c
o
o
e
e
l
l
o
o
m
m
i
i
c
c
f
f
l
l
u
u
i
i
d
d
Professor D r S e r g i o S c h m i d Expert D r A n n a M a r i a P u g l i a Submission date of the reportc f . t h e s i s f o r m ( D D . M M . Y Y Y Y )
Objectives
The identification of the microbiota present in the coelomic fluid of Paracentrotus lividus has been highlighted in order to understand the role of bacteria in the physiology, ecology and aquaculture activities of this echinoderm.
Methods | Experiences | Results
The presence of bacteria into the coelomic fluid of the Mediterranean sea urchin Paracentrotus lividus has been explored. Two different methods of analysis, the culture-based and culture-independent investigations, are described. The dependent culture method based on the growth of bacteria on marine agar and DNA sequencing after the amplification of the 16S rRNA gene, reported a predominance of taxa belonging to Proteobacteria and Bacteriodetes. The analysis of the production of extracellular enzymes and antibacterial compounds has also been performed and reports that the isolated strains produced proteases, lipases and esterases. The independent culture method was performed by the sequencing by minION™ technologies of the metagenomic DNA extracted from the coelomic fluid. This approach reported a predominance of taxa belonging to Proteobacteria, Actinobacteria, Cyanobacteria, Fusobacteria, Thermodesulfobacteria, Ignavibacteria, Firmicutes and Tenericutes. In addition, studies on interactions with marine microorganisms are providing additional tools to understand phenomena of symbiosis, development and morphogenesis.
Isolation and characterization of sea urchin
P.lividus microbiota from coelimic fluid
Graduate
Boris Zuber
Bachelor’s Thesis
| 2 0 1 6 |
Degree programme Life Technologies Field of application Biotechnology Supervising professors Dr SergioSchmid [email protected] Dr Anna Maria Puglia [email protected] PartnerUniversità degli studi di Palermo, STEBICEF Dpt, Scuola delle Scienze di base ed applicate.
Opened sea urchin. Five orange-red gonads bath in the coelomic fluid.
Thesis realised in the Laboratory of Molecular Microbiology and Biotechnology of the STEBICEF Departement, University of Palermo
... Daten_q�r Diplomarbeit
Filière I Studiengang Année académique I Studienjahr No TD!Nr. DA
TEVI 2015/2016 bt\2016\27
Mandant !Auftraggeber Etudiant / Student Lieu d'exécution I Ausführungsorl
D
HES-SO Valais Zuber BorisD
HES-SO ValaisD
Industrie Professeur I DozentD
1 ndustrie[Z] Etablissement partenaire Sergio Schmid [Z] Etablissement partenaire
Pa rtn e rin sti tu fion Pa rtn erins titution
Travail confidentiel ! vertrauliche Arbeit Expert/ Experte {données complètes)
D
oui/ ja 1 [Z] non/ nein Prof Anna Maria Puglia, Università degli Studi di Palermo Titre / Tite/Isolation and characterization of sea urchin P.lividus microbiota from coelomic fluid
Description I Beschreibung
The study of the microbiota is a subject of considerable and growing interest since it is drawing new important perspectives in the life sciences concerning the functional relationships between metazoans and microbial cells. ln fact, it has already shown that the endogenous microbial community affects various physiological activities of multicellular organisms.
The coelomic cavity of echinoderms contains a fluid in which coelomocytes are reported to exert immune functions like phagocytosis, opsonization and production of antimicrobia! agents against marine bacteria. However, up to day nothing is known about the endogenous bacterial population of coelomic fluid. We focused on this issue, and, to this aim, both bacteria! culture-dependent and -independent approaches were adopted By the former approach, we isolated 8 distinct Gram-negative marine bacterial strains identified for their 16S rDNA sequence. lnterestingly, almost ail isolated stra1ns show a considerable extracellular hydrolytic activity. Moreover, one of thern exerts antimicrobial effect against Gram-negative bacteria, including most of the other strains isolated from the coelomic flu1d. Finally, molecular investigation on metagenomic DNA composition confirmed culture-dependent results and give us more information about uncultured bacteria inside coelomic fluid.
This study not only suggests insights on functional interaction between sea urchin and marine microorganisms, but also could provide a nove! source of biochemical diversity for the production of bioactive compounds and enzymes that can find biotechnoloqical ap�_li_ca_t_io_n_s_. __________ _,
Signature ou visa I Unterschrift oder Visum Responsable de l'orientation / filière �eiter.d�:·. �����u�1�! Studiengang: 1 Etudiant I Student : .'J
-�{eq
v-.... b.., v-....v-....v-....v-... .
---·· ···---·----Délais/ TermineAttribution du thème I Ausgabe des Auftrags: 02.05.2016
Fin des travaux de diplôme dans les laboratoires de l'école/ Ende der Dîplomarbeiten in den Labors.der Schule:
Remise du rapport I Abgabe des Sch/ussbe1ichts: 28.10.2016
Expositions I Ausstellungen der Oiplomarbeiten.
Défense orale I Miindliche Verfech/ung:
dès la semaine 44 I ab Woche 44
---···---··-�-.. -···---� Par sa signature, l'éludian/-e s'engage à respecter strictement la directive 01.1.2.02.07 /iée au travail de diplôme.
Acknowledgements
It is a real pleasure for me to acknowledge the help of each people who were instrumental for the realisation of my bachelor thesis. To begin, I would like to thank Prof Sergio Schmid who told me about the opportunity to achieve this study in Palermo and encouraged me in this sense, for his teaching in molecular biology and his good preparation that made me able to realise the practical part of this work, and also for his support and lecture as supervisor of this thesis.I would like to express my gratitude to Prof Anna Maria Puglia and Prof Giuseppe Gallo for the access to the Laboratory of Molecular Biology and Functional Genomics of the University of Palermo, for them advice and support during all my stay in Palermo. It was a good experience for me to work with a marine organism and improve my knowledge in microbiology, molecular biology and Italian speaking. I truly enjoyed working in a research environment that stimulates new thinking and initiative. Thank also to Prof Vincenzo Cavalieri for his expertise and knowledge about the sea urchin P.lividus.
I would also like to acknowledge the valuable input of Dr Claudio Tripodo and Dr Walter Arancio, from the AIRC laboratory of the Polyclinic of Palermo, for the sequencing of the genomic sample by minION® technology and for them contribution to understand this novel technology and the results obtained.
These 6 months in Sicily would not realise without the financial support of the MOVE organisation, which give me a scholarship for this period and help me for all administrative registrations in Palermo.
These acknowledgements would not be complete without mentioning my research lab colleagues, I have learned a lot from them, and I hope that I have been able to impart also my knowledge to contribute to the sharing. A special thank for Francesco Ardizzone, Paolo Cinà and Pasquale
Alibrandi for the unforgettable moments lived with them during this thesis at work and especially
during the free time. “Alla grande compà” My deepest appreciation belongs to my family for their encouragement, patience and love without this experience would be more difficult. To answer to the questions about my future from my professors, family and friends I shall use the words of Peter Drucker: “The best way to predict the future is to create it”.
viii
Table of contents
Acknowledgements ... vii 1 Introduction ... ‐ 1 ‐ 1.1 Microbiota ... ‐ 1 ‐ 1.2 Marine organisms microbiota ... ‐ 2 ‐ 1.3 Sea urchin P.lividus ... ‐ 4 ‐ 2 Materials and Methods ... ‐ 7 ‐ 2.1 Dependent culture method ... ‐ 7 ‐ 2.1.1 Marine Agar (MA) and Marine Broth medium (MB) ... ‐ 7 ‐ 2.1.2 Sea urchin and coelomic fluid harvesting ... ‐ 7 ‐ 2.1.3 Colony PCR ... ‐ 7 ‐ 2.1.4 Gel electrophoresis ... ‐ 9 ‐ 2.1.5 Purification of amplified DNA ... ‐ 9 ‐ 2.1.6 Sequencing ... ‐ 10 ‐ 2.1.7 Bioinformatics analysis ... ‐ 10 ‐ 2.1.8 Strain glycerol stock (SGS) ... ‐ 11 ‐ 2.1.9 Protease analysis ... ‐ 11 ‐ 2.1.10 SDS‐Page ... ‐ 12 ‐ 2.1.11 Cellulase analysis ... ‐ 13 ‐ 2.1.12 Esterase analysis ... ‐ 14 ‐ 2.1.13 Lipase analysis ... ‐ 14 ‐ 2.1.14 Antimicrobial assay ... ‐ 14 ‐ 2.2 Independent culture method ... ‐ 15 ‐ 2.2.1 DNA extraction ... ‐ 15 ‐ 2.2.2 DNA Quantification ... ‐ 15 ‐ 2.2.3 Amplification of the 16S rRNA gene ... ‐ 16 ‐ 2.2.4 Sequencing by minION™ technology ... ‐ 17 ‐ 3 Results ... ‐ 18 ‐ 3.1 Dependent culture method ... ‐ 18 ‐ 3.1.1 Isolation of bacterial strains from coelomic fluid of P.lividus ... ‐ 18 ‐ 3.1.2 Colony PCR ... ‐ 20 ‐ 3.1.3 Purification of amplified DNA ... ‐ 21 ‐ 3.1.4 Sequencing and bioinformatics analysis ... ‐ 21 ‐ 3.1.5 Zymographic analysis ... ‐ 26 ‐3.1.6 Native SDS‐Page ... ‐ 27 ‐ 3.1.7 Assay of cellulase activity ... ‐ 27 ‐ 3.1.8 Assay of esterase activity ... ‐ 28 ‐ 3.1.9 Assay of lipases activity ... ‐ 29 ‐ 3.1.10 Antimicrobial assay ... ‐ 29 ‐ 3.1.11 Summary of the results ... ‐ 30 ‐ 3.2 Independent culture method ... ‐ 31 ‐ 3.2.1 DNA extraction ... ‐ 31 ‐ 3.2.2 Amplification of the 16S rRNA gene ... ‐ 31 ‐ 3.2.3 Sequencing by minION™ technology ... ‐ 32 ‐ 4 Discussion and conclusion ... ‐ 33 ‐ References ... ‐ 35 ‐
x
List of abbreviations
APS : Ammonium PerSulphate mA : milliAmper atm : atmosphere (unit of pressure) bp : base pairs CMC : CarboxyMethyl Cellulose °C : Celsius degree conc. : Concentration DNA : DesoxyriboNucleic Acid dNTP : desoxyNucleotide Tri‐Phosphate DMSO : DiMethyl SulfOxyde E : East EDTA : EthylenDiamineTetraAcetic acid h/min/s : hour/minute/second µg/mg/g : microgram/milligram/gram G : Gravity force µL/mL/L : microLiter/milliLiter/Liter LB : Luria Broth medium MA : Marine Agar MB : Marine Broth medium MM : Master Mix nm/µm/cm/m : nanometer/micrometer/centimetre/meter M, mM and µM : Molecular weight [mol/L], [mmol/L] and [µmol/L] N : North NFW : Nuclease‐Free Water PCR : Polymerase Reaction Chain pH : “potential Hydrogene” (‐log*[H+]) rx : reaction rpm : revolutions per minute RNA/rRNA : RiboNucleic Acid/ ribosomal RiboNucleic Acid RT : Room Temperature SDS : Sodium Dodecyl Sulphate TAE : buffer Tris‐Acetate‐EDTA TEMED : TEtraMEthylethyleneDiamine UV : UltraViolet V : Volt Vol. : Volume (v/v) and (w/v) : (volume/volume) and (weight/volume) W : Watt WIMP : What’s In My Pot?List of Figures
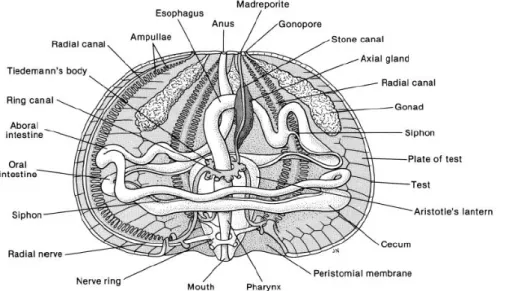
Figure 1: Human gut microbiota [6] ... ‐ 1 ‐ Figure 2: Sampling of sea urchin P.lividus ... ‐ 4 ‐ Figure 3: bottom side (oral pole) of light violet Paracentrotus lividus [45] ... ‐ 4 ‐ Figure 4: Upper side (aboral pole) of dark violet Paracentrotus lividus [45] ... ‐ 4 ‐ Figure 5: Internal anatomoy of sea urchin P.lividus. The coelomic fluid is not represented but all of the internal organs bathed in this liquid [49]. ... ‐ 5 ‐ Figure 6: Opened sea urchin. Five orange gonads from adult [45]. ... ‐ 5 ‐ Figure 7: Amplified region on the 16S rDNA [64] ... ‐ 8 ‐ Figure 8: Diminution of the MA thickness after 3 weeks at 30°C. ... ‐ 18 ‐ Figure 9: Isolation of the strain from the coelomic fluid on MA. (A) No dilution, (B) 1/10 dilution and (C) 1/100 dilution. ... ‐ 18 ‐ Figure 10: Pure colony on MA isolated from coelomic fluid after 5 days at 30°C. ... ‐ 19 ‐ Figure 11: Electrophoretic analysis of colony PCR products (1%, 100V for 1h) ... ‐ 20 ‐ Figure 12: Electrophoretic analysis of colony PCR products (1%, 100V for 1h) ... ‐ 20 ‐ Figure 13: Electrophoretic analysis of colony PCR products after purification. ... ‐ 21 ‐ Figure 14: Phylogenetic tree of the isolated strains from the coelomic fluid of P.lividus ... ‐ 22 ‐Figure 15: Phylogenetic tree zoomed to show the affiliation of the isolated strain 11 to the genus Marinobacter ... ‐ 23 ‐
Figure 16: Phylogenetic tree zoomed to show the affiliation of the isolated strain 9 to the genus Balneola ... ‐ 23 ‐
Figure 17: Phylogenetic tree zoomed to show the affiliation of the isolated strain 10 to the genus Oceanibulbus ... ‐ 24 ‐
Figure 18: Phylogenetic tree zoomed to show the affiliation of the isolated strains 1‐8 and 12 to the genus Vibrio ... ‐ 25 ‐
Figure 19: Zymographic analysis of the isolated strains. Migration parameters: 100 W, 160 V and 15/25 mA ... ‐ 26 ‐
Figure 20: Native SDS‐Page of the isolated strains. Migration parameters: 100 W, 160 V and 15/25 mA ... ‐ 27 ‐ Figure 21: Cellulase assay. Migration parameters: 100 W, 160 V and 15/25 mA ... ‐ 28 ‐ Figure 22: Esterases assay on agar plate containing ester myristate after an overnight incubation at 37°C. ... ‐ 28 ‐ Figure 23: Lipases assay on MA containing rhodamine‐B and olive oil after 10 days of incubation at 30°C. ... ‐ 29 ‐ Figure 24: Antimicrobial assay with a Gram‐negative strain (E.coli) in soft agar. Incubation overnight at 37°C. ... ‐ 29 ‐
Figure 25: Antimicrobial assay with a Gram‐positive strain (K.rhizophila) in soft agar. Incubation overnight at 37°C. ... ‐ 30 ‐
Figure 26: Electrophoretic analysis of the DNA extracted from the coelomic fluid of P.lividus (1%, 100V for 60 min). ... ‐ 31 ‐
Figure 27: Electrophoresis analysis of the amplified products of extraction (1%, 100V for 1h) ... ‐ 31 ‐
Figure 28: Phylogenetic tree and relative abundance of each strain obtained after the sequencing, by minION™ technologies ... ‐ 32 ‐
‐ 1 ‐
1
Introduction
1.1 Microbiota
Complex organisms (like plants and animals) cannot live without interaction with their environment and microorganisms. They live in a complex community and need some interactions to growth, produce energy and protection. Moreover, microorganisms are not only a source of contamination and disease but also serve for a correct development. The microbiota is the set of microorganisms (bacteria, yeasts, fungi and virus) that live in symbiosis with other organisms (such as animals or plants). This set can be found inside or outside (like on the skin for animal) to the host organism. The first approach of this term for human was realised by J.Lederberg with the terms microbiome, “to signify the ecological community of commensal, symbiotic, and pathogenic microorganisms that literally share our body space” [1]. To determine the population of the human microbiota and to evaluate the capacity of the bacterial microbiota to growth in vivo, an analysis of the relatively well‐ conserved 16S rRNA gene was performed with a mixture of organisms [2]. Results showed that 40% to 80% of microorganisms are cultivable, others organisms (depending on the body site and complex interactions) are uncultivable. For this reason, the population and the number of microorganisms are probably underestimated [3]. The human genome
contains about 20’000 different genes and the bacterial gut metagenome meanwhile contains more than 3 million genes (cells ratio is about 1:10 between eukaryotes and prokaryotes cells) [4]. This difference is not negligible and helps to understand why the microbiota plays an important role during the live and for the health of each host organism [5]. The gastrointestinal track is the most important region of the animal body where this amount of
microorganisms is present and can be considered like an independent organ. The intestinal microbiota (Figure 1) can perform trophic, metabolic, digestive and also protective and adaptive processes to the host organism [7]. Nevertheless, the microbiota of the buccal cavity, vagina and skin are important too to regulate and protect the body against external contamination and should not be overlooked [8]. The symbiotic micro‐organisms are able to respond to changes in our behaviour but also to the environment and therefore can affect our health: may contribute to the pathogenesis of certain diseases such as arthritis [9], cirrhosis and liver disease [10], pneumonia in HIV‐infected individuals [11], type 2 diabetes [12] and obesity [13].
For plants, the microbiota is also important and is involved in vital function such as plant nutrition, nitrogen assimilation, vitamins and hormones production and endurance of these to biotic and abiotic stresses. Leaves (phyllosphere) and roots (rhizosphere) are two different possibilities to be in contact with their environment and contribute in a different way to the symbiosis. Roots are directly in contact with soil, one of the biggest microbial ecosystems on Earth, but not all types of bacteria are good for one plant species. Members of the phyla Bacteroidetes, Actinobacteria, Proteobacteria and Firmicutes are mostly represented in soil sample [14]. Figure 1: Human gut microbiota [6].
That is why plants need to do a selection for choosing by molecules secretion, such as salicylic acid or ethylene production, the good species of bacteria to live in symbiosis. The molecular secretion can be realised directly in a specific zone by root secretion or in a large zone by leaves diffusion. The promotion of animal and plant health by microorganisms has been described for many decades and demand again more studies to understand the complexity of differentiation carried out by the host organism to live in symbiosis and not in pathogen way. The Earth is also called the blue planet because more than 70% of the surface is covered with water. About 95% of this water is contained between ocean and sea. The seawater has a pH between 7.5 and 8.4, and is a slightly alkaline mixture with solids, gases and dissolved organic matter, the concentration of which varies according to region and temperature. At the beginning of the life on Earth (3.5 billion years ago), microorganisms were the only living form and this for about 3 billion years. So the development of life on Earth and its environment depend on the past and present activities of marine bacteria. During the twentieth century, a lot of experiment (metagenomics studies) were realised with sea samples, for several reasons. As described above, water covers a surface biggest than continents and then microbial water life has an important role in the regulation of Earth ecosystems. It’s a natural resource. The environment of marine niches is particular and demands to the microorganisms to be resistant against salts concentration, temperature, sun UV rays. Some new genes and expressed proteins can be found and used for biotechnological processes; this part is fast growing. The change of the marine microbial diversity is directly affected by their environment and can be used as a detector for ecosystem sustainability [15]. The discovery of abundance microbial life in this environment has confirmed the old theories on the vital role of marine microorganisms for the maintenance of life on the Earth [16]. The sea microbiota is studied in coastal regions over the world but the comparison between studies is difficult because the conditions and environment of each location are too different. Furthermore, these studies are mostly concentrated in the photic zone (superficial water) while the aphotic zone (more than ‐200m) of the ocean is biggest. This second zone contains the life of the ocean, with fishes and mammalian animals, and brings the essential part of nutrients that needs the superficial zone [17]. The first results about the diversity of sea microbiota show that the micro‐organism density decreases with depth [18]. However, some results obtained in another study show that aphotic zone contains more micro‐ organisms than the other part of the ocean and that this community is more productive than earth microorganisms [19, 20]. The nutrient cycle of Deep Ocean bring essential nutrients for the photic and terrestrial zone and then microorganisms’ communities of these two zones are dependent on the aphotic zone microbiota [20].
1.2 Marine organisms microbiota
The study of interactions between marine organisms and their microorganisms is providing interesting insights into phenomena of symbiosis and pathogenicity. In fact, it is known that even in the marine environment the bacteria establish relationships with guests and in some cases organisations promoting the acquisition of nutriment, tissue development or immune system [21]. Symbiotic microbial communities are common in marine invertebrates and include several species of bacteria, microalgae virus and archaea [22]. The prokaryotic microbiota of marine invertebrates is constituted, for the most part, by obliged symbionts [23] but there are also optional [24] and many of them produce specific extracellular compounds.
‐ 3 ‐ The microorganism symbiotic also plays a critical role in ensuring the normal growth of the host organism, through the supply of nutrients and the production of secondary metabolites having protective activity against predators. For example sponges, corals and sea squirts, carry out their activities nutrient suppliers, through carbon fixation, that comes from photosynthetic symbionts [25]. The structural and functional diversity of microbial community symbionts, in fact suggests that invertebrates guests create microbial niches that contribute to the biodiversity and to vary the nutrient cycle in the marine ecosystem of the coasts [26]. The specific microorganisms which live in microbial niches include bacteria, archaea and single eukaryotic cells, make up about 40% of the total volume of the sponge [27]; the cyanobacterial symbionts, provide up 50% of energy needed to tropical sponges [28], other strains produce metabolites directly active against predators [29] which are also useful not only for pharmaceutical uses but seems to contribute in determining the development of the sponge [30]. The sponge symbiotic microorganisms are responsible for the synthesis of vitamin B1 that these animals must necessarily obtain from the nutrient [31]. Today there is increasingly focused on the fact that the sponges contain their specific microbiota and through pyrosequencing of different species have been identified, Proteobacteria, Acidobacteria, Actinobacteria, Chloroflexi are the mostly present [32]. The synthesis of secondary metabolites by symbiotic microorganisms contributes, as we said, for the chemical defences of marine invertebrates [33], the strategy will be useful for organisms who need fixation to a support to growth (sessile organisms) to discourage predators, avoid getting trapped in sly contexts and for the substrate competition [34]. It is to underline the fact that many of these secondary metabolites are useful in the pharmaceutical field and in the biotechnological applications [35].
Many studies on the microbiota of sea squirts focus their attention on cyanobacteria isolated from the cloacal cavity (meeting point of the excretory ducts of the urinary and reproductive apparatus with the end of the intestinal canal) or the host organism tunic (protection layer for the host organism)[36]. Cyanobacteria of the strain Prochlon generally provide UV absorbent molecules to their guests. Bacterial symbionts were also isolated from bivalves as Tyasira flexuosa. The micro‐ organisms were isolated from tissue of gills and some of these oxidise sulphates [37]. Another micro‐ organism named Calyptogena soyoae was also isolated from bivalves and help the host organism for the fixation of carbon source [38]. A substantial number of studies report the presence of intestinal micro‐organisms in aquatic invertebrates. The most common genra reported as symbionts of the gastrointestinal tract of marine invertebrates are: Pseudomonas, Vibrio, Micrococcus, Aeromonas, Flavobacteria.
Among the ecologically and commercially important invertabrates, the sea urchin deserves considerable attention, both for its use as a culinary delicacy [39], both as a model organism for the study of biological systems of primary importance such as embryogenesis, development and studies focusing on the dynamics of chromatin [40]. Recently, studies were also made regarding the intestinal microbiota of Lytechinus variegatus sea urchin [41] and designated a potential role for the health of the animal, helping its absorption of nutrients activities [42]. However, a little attention has been given to the determination of a possible microbial communities existing in coelomic fluid of the sea urchin, more precisely for the species Paracentrotus lividus, which could also provide ecologically important information and sheds light on a possible biological role of these microorganisms in the growth and survival of this species.
The isolation and characterization of the microbiota contained in the coelomic fluid of P.lividus is essential to understand how this organism live and share in a sea environment as well as found new enzymes produce by this microbiota usable for biotechnological processes.
1.3 Sea urchin P.lividus
The sea urchin Paracentrotus lividus is also known as the rock sea urchin or purple sea urchin [43]. However, the colour of this species (Figure 4) can vary between brown (dark and light), olive green and violet (dark and light). It belongs to the phylum Echinodermata (Echinoidea); it’s a benthic organism (lives fixed to a solid substrate) and lives principally in the eastern Atlantic Ocean and the Mediterranean Sea. It’s subtidal species (species that lives in a zone situated below the variation of the sea’s tide because it needs to be always immersing). It lives fixed to a rock pool (boulders) or in meadows of seagrasses at a depth up to 20 meters but can be found until 80 meters when the temperature of the upper water exceeds 29°C (living temperature between 4°C to 29°C). This organism is principally herbivore and eats different kinds of algae like R.verruculosa, C.nodosa and P.pavonica [44]. It moves outsides rock cavity during the night to eat and still hide the rest of the time.
The reproduction period for P.lividus is between February and July; during this period, which corresponds to the algal production, the gonads are biggest and contain gametes (sperms and eggs) [46]. The fecundation of eggs is external. Eggs and sperms are ejected in the sea in the same moment, during the night; the fusion of the gametes is realised with some adhesive protein in sperm and specific receptors on eggs surface [47]. It is not possible to determine if the sea urchin is a female or a male before to open it.
P.lividus is comestible and is particularly appreciate in Europe (principally in Italy, Spain and France) and in Japan for its gonads. During these last few years, the fishery has grown too fast and becomes dangerous for the population of this species (also for fish species), despite it is the most widespread species of the Mediterranean Sea [48]. For example between 1996 and 2000, a mean of 500,000 tonnes per year were fished in Spain Atlantic Ocean. This quantity has been reduced to a mean of 100,000 tonnes per year between 2001 and 2011 [49]. This reduction is a good beginning but not sufficient to recover the initial world population of sea urchin.
Figure 4: bottom side (oral pole) of light violet Paracentrotus lividus [45]. Figure 3: Upper side (aboral pole) of dark
violet Paracentrotus lividus [45]. Figure 2: Sampling of sea urchin
‐ 5 ‐ So it’s important to understand how this organism lives and shares with its environment in order to control the aquaculture conditions; which correspond only to 0.9% of the world production, and not lose this species definitively in natural habitat. The organic pollution has a little effect on the growth of P.lividus and seems in contrast to increasing the density population of the species near the discharge point [50].
However, pollution from oil spills has caused 100% mortality of sea urchin (P.lividus and P.miliaris) population, three weeks after “Ericka” incident at Piriac‐sur‐Mer (France). It took about three years to recover the initial density [51].
The body structure (named test, Figure 5) of P.lividus is composed of five symmetric calcareous plates and the epidermis. The form of this animal is spherical for the top and flattened on the bottom
and the maximum test
diameter is about 7
centimetres [52]. It is covered by movable spines and podia with which it can move vertically and horizontally. The spines are fixed on the shell by muscles and serve also as
protection against the
predator and to catch and hold the nutrients. The weight of spines on healthy sea urchin corresponds to 50% of the total weight. The podia serve principally for oxygen absorption, body cleaning or covered the body with pieces of algae, shell and rocks as a camouflage (named spine canopy). The mouth is situated on the bottom surface (oral pole, Figure 2) and is called Aristotle’s lantern, it is composed of five triangular plates with the tooth at the end. The sea urchin P.lividus also uses this strong mouth to create some protection cavities in the rock against predators and Sea/Ocean current. The mouth is connected to the test by a peristomial membrane; this membrane allows the mouth to move up, down and on the sides. The mouth is following by the pharynx, the oesophagus, two intestines (oral and aboral) and finish by the anus on the aboral surface (on the top, Figure 3). The digestive system is directly associated to the
gonads by hemal and mesenterial strands. The gametes and excrements are released into the sea by the anal pole. Inside the coelomic cavity (cavity forms by the test) you can also find five gonads (reproductive organs, Figure 6) disposed radially on the test. The colour of desirable gonads can be varied between yellow‐orange and orange‐red due to carotenoid pigments if the gonads present different colours (black, brown, green or white) it is a sign of healthy problem.
Figure 6: Opened sea urchin. Five orange gonads from adult. Figure 5: Internal anatomoy of sea urchin P.lividus. The coelomic fluid is not
The weight of healthy gonads corresponds to 10‐14% of the adult’s body but can be smallest [53]. Two major cell types are present in the gonads: germinal cells and nutritive phagocytes, which give the energy and nutrients necessary for the development of the gametes [54‐55]. The most important circulatory medium of sea urchins is then the coelomic fluid enclosed in the body cavity (test). This internal fluid contains a mixture of organic molecules and living cells that control essential functions (as nutrient transport or immune activity) [56‐57]. The coelomic fluid is not in contact with the surrounding seawater environment and in direct contact with internal tissues. This is why this liquid is composed by immunocytes that respond to pathogen challenge and producing antibacterial molecules [58‐59]. Therefore, the coelomic fluid could be considered as a complex tissue that mediates responses against injury and microbial infections by different approaches such as coagulation, opsonization, phagocytosis and encapsulation [60]. In a second case, the coelomic fluid of P.lividus has been supposed to be a microorganism‐free compartment. Only recently, a report describing the identification of a bacterial microbiota associated with the coelomic fluid of P.lividus [61], was carried out in the Laboratory of Molecular Microbiology and Biotechnology (where the practical part of this thesis was realised).
In the present study, the presence of bacteria into the coelomic fluid of the sea urchin Paracentrotus lividus from a geographical area different from that considered in the first report has been explored. Two different methods of analysis, the culture‐based and culture‐independent investigations, are described. The dependent culture method based on the growth of bacteria on marine agar (MA) and DNA sequencing after the amplification of the 16S rRNA gene, reported a predominance of taxa belonging to Proteobacteria and Bacteriodetes. The analysis of the production of extracellular enzymes has also been performed and reports that the isolated strains produced proteases, lipases and esterases. This kind of biomolecules can be useful for biotechnological processes but needs to be characterised because only qualitative approaches have been done. The independent culture method was performed by the sequencing by minION™ technologies of the metagenomics DNA extracted from the coelomic fluid. This approach reported a predominance of taxa belonging to Proteobacteria, Actinobacteria, Cyanobacteria, Fusobacteria, Thermodesulfobacteria, Ignavibacteria, Firmicutes and Tenericutes. The identification of the microbiota present in the coelomic fluid of sea urchin Paracentrotus lividus have been highlighted in order to understand the role of bacteria in the physiology and ecology and aquaculture activities of this echinoderm. Moreover, this research could allow the discovery of new bioactive compound useful for biotechnological processes.
‐ 7 ‐
2 Materials and Methods
2.1 Dependent culture method
2.1.1 Marine Agar (MA) and Marine Broth medium (MB)
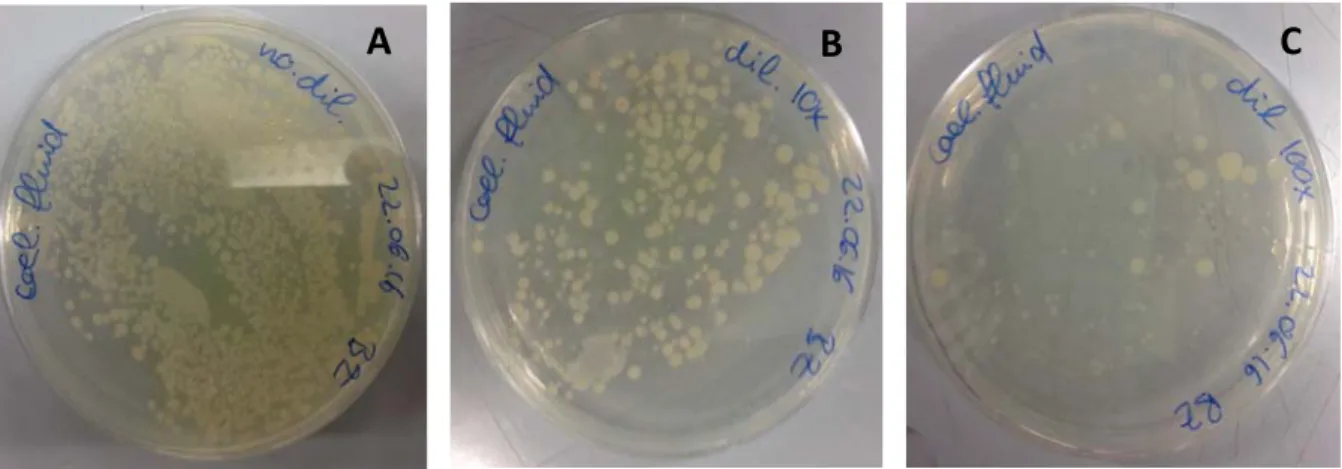
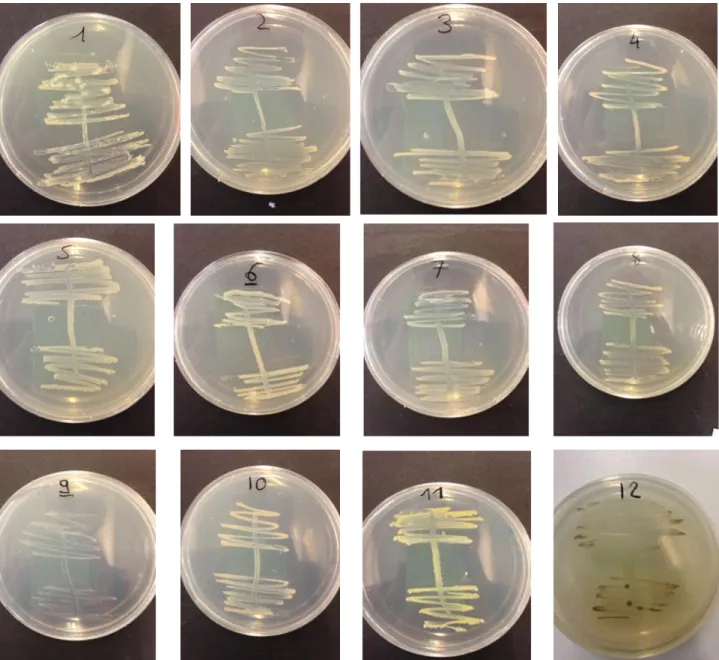
40.20 g (balance BC1500, ORMA, n°33888) of marine broth (Conda pronadisa, n°1217.00) was suspended in 1.0 L of distilled water. Well mixed and dissolved by heating in a water bath with frequent agitation. The preparation was boiled one minute in the microwave (Electrolux M8, n°EMS21400S) until complete dissolution. After the temperature was below than 30°C, 15.00 g of BactoAgar (BD, n°214010) was added and the medium was sterilised at 121°C, 1 atm during 20 minutes (autoclave Carlo Erba, n°5991). The prepared medium may present a light precipitation. Plates were prepared before the solidification of the medium and under biological laminar flow with UV lamp. The plates were conserved at 4°C until the use. The marine broth medium (MB) was prepared following the same instruction without the addition of bactoAgar. After the sterilisation, the bottle of the medium was conserved at RT. 2.1.2 Sea urchin and coelomic fluid harvesting The sea urchin samples used for this thesis were collected from the coastal region of Palermo, from the coast of women’s island (Isola delle Femmine, 38°12’00’’N and 13°15’00’’E), during the months of June and July 2016. The P.lividus samples were taken during the early hours of the morning and immediately transported to the Laboratory of Molecular Microbiology and Biotechnology of the University of Palermo, in optimal conditions of temperature and humidity, such as to ensure an analysis as accurate as possible and corresponding with natural conditions. It was then externally sterilised by heat (burned with a Bunsen the external calcareous shell urchin). The harvesting was realised under a biological laminar flow. Sterile syringe (BD plastipak, n°300865) with a needle were used for the harvesting of coelomic fluid. The needle was inserted through the animal's peristomial membrane around the mouth (Aristotle’s lantern) and the liquid is pumped off.
The coelomic liquid extracted was mixed with 100 µL of 0.5 M EDTA (Sigma, n° E6758) to prevent coagulation of protein, placed into sterile tubes of 10 mL and kept on ice. The coelomic fluid was plated containing MA as described below: ‐ 20 µL of native sample ‐ 20 µL of 10x diluted sample ‐ 20 µL of 100x diluted sample The MAs were incubated overnight at 30°C. All the different strains were then selected and plated on fresh MA. The new plates were incubated overnight at 30°C. If there was one strain on the plate, this one was stored at 4°C until the use. If there was more than one colony, one fresh MA was used for each colony and incubated overnight at 30°C. This final step was realised until to obtain a pure clone. 2.1.3 Colony PCR Cells of the strains isolated from pure cultures were directly taken from their culture medium under sterile conditions with a toothpick and suspended in 25 µL of TE buffer (10 mM Trizma (Sigma, n°T1503), 1 mM EDTA (Sigma, n° E6758), pH adjusted at 8).
The bacterial suspensions were boiled in water bath for 5 minutes, immediately after placed on ice for 5 minutes and finally centrifuged (minispin, Eppendorf, n°5452) at 15000 G for 5 minutes (centrifuge mini spin Eppendorf, n°5452). 1 µL of the supernatant containing the DNA of the selected strain was used as a template for the PCR reaction.
The primers used for the PCR reaction of the 16S rRNA gene are listed in the Table 1.
Table 1: Oligonucleotide used for the amplification of 16S rRNA gene.
Name Sequences Lenght Information
16S_27F 5’‐ AGAGTTTGATCMTGGCTCAG ‐3’ 20 PCR primer
16S_1492R 5’‐ TACGGYTACCTTGTTACGACTT‐3’ 22 PCR primer
Primer 16S_27F (Invitrogen, Q8181A07 ); Primer 16S_1492R (Invitrogen, n°Q8181A08) [62].
The region amplified by the primers used is visualised on the Figure 7. This PCR reaction can be named as “16S long” amplification [63].
Figure 7: Amplified region on the 16S rDNA [64].
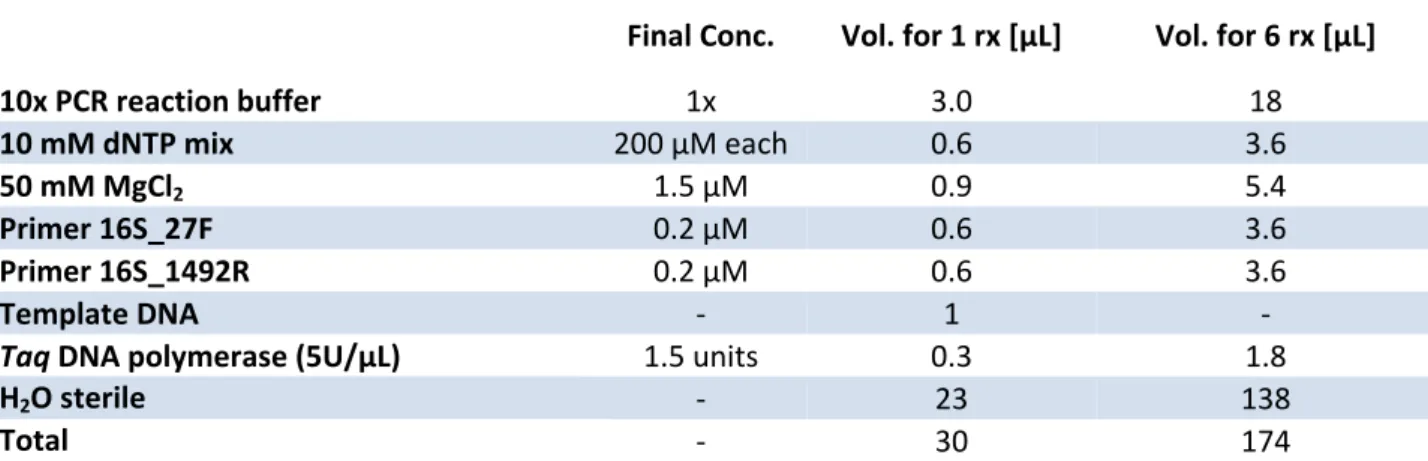
The amplification reaction was carried out in a total reaction volume of 50 μL, using the following quantities of reagents (Table 2): Table 2: Master Mix used for the colony PCR. Final Conc. Vol. for 1 rx [µL] Vol. for 5 rx [µL] Vol. for 15 rx [µL] 5x PCR reaction buffer 1x 10 50 150 10 mM dNTP mix 200 μM each 1 5 15 50 mM MgCl2 1.5 μM 1.5 7.5 22.5 Primer 16S_27F 0.2 μM 1 5 15 Primer 16S_1492R 0.2 µM 1 5 15 Template DNA ‐ 1 ‐ ‐ Tfi DNA polymerase (5U/µL) 5 units 1 5 15 H2O sterile ‐ 33.5 167.5 502.5 Total ‐ 50 245 735 Tfi DNA polymerase, 5x PCR reaction buffer and 50 mM MgCl2 (Invitrogen, n°30342‐052); dNTP set
(Invitrogen, 10297‐018). NFW was used as negative control and genomic DNA from S.coelicolor as positive control (University sample gave by A.Vassallo).
‐ 9 ‐ The programme used for the amplification (Master cycler personal Eppendrof, n°5332 01037) is the following (Table 3): Table 3: Program used for the colony PCR. Temps Temperature [°C] Initial Denaturation 3 min 94 Denaturation 45s 94
Annealing 1 min 50 30 cycles
Extension 1.5 min 72 Final extension 10 min 72 The duration of this program is about 2.2 hours. 2.1.4 Gel electrophoresis To observe the result of the amplification, a 1% (w/v) agarose gel was prepared. 0.5 grams (balance JJ100, FALC, n°630201001) of agarose (Eurx, n°E0301‐500) were added in 50 ml of TAE buffer 1x (4.84 g Trizma (Sigma, n°T1503), 1.14 ml acetic acid 100% (Sigma, n°33209), 2 ml 0.5 M EDTA (Sigma, n° E6758) completed until 1000 ml with demineralised water, pH adjusted at 8). The solution was boiled with a microwave (Electrolux M8, n°EMS21400S) until complete dissolution of the agarose. 1 µL of ethidium bromide (Sigma, n°E1510) was added to the solution before the pouring of the gel. Let the gel solidified before the use.
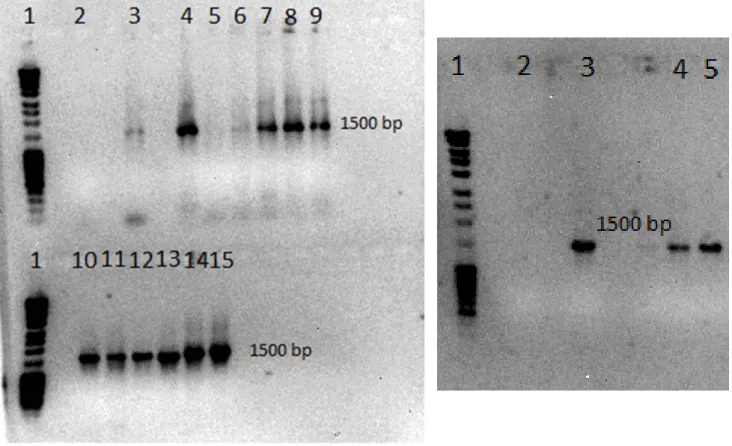
5 µL of ladder (MassRuler DNA ladder mix, Thermo Scientific, n°SM0403 or DNA ladder, Roche, n°14833221) was loaded for each run. 2 µL of sample mixed with 1 µL of loading buffer (DNA gel loading dye 6x, Thermo Scientific, n°R0611) was loaded per well. The run conditions were 100 mA and 100 V (electrophoresis power supply Elvi tipo18, n°877) and the run duration was about 1 hour. Results acquisition was performed with the program AlphaDigiDoc RT2 connected to a trans‐ illuminator UV (Alpha innotech corporation UV lamp, n°0610193).
2.1.5 Purification of amplified DNA
The following method originates from the NucleoSpin® gel and PCR clean‐up kit by Macherey‐Nagel (n°740609.250).
The purification step was realised from a 1% agarose gel. 1.2 grams (balance JJ100, FALC, n°630201001) of agarose (Eurx, n°E0301‐500) were added in 120 mL of TAE buffer 1x (4.84 g Trizma (Sigma, n°T1503), 1.14 ml acetic acid 100% (Sigma, n°33209), 2 mL 0.5 M EDTA (Sigma, n° E6758) completed until 1000 mL with demineralised water, pH adjusted at 8). The solution was boiled with a microwave (Electrolux M8, n°EMS21400S) until complete dissolution of the agarose. 2.5 µL of ethidium bromide (Sigma, n°E1510) was added to the solution before the pouring of the gel. Let the gel solidified before the use. 5 µL of ladder (MassRuler DNA ladder mix, Thermo Scientific, n°SM0403) was loaded for each run. 48 µL of sample mixed with 3 µL of loading buffer (DNA gel loading dye 6x, Thermo Scientific, n°R0611) was loaded per well. The run conditions were 100 mA and 100 V (electrophoresis power supply Elvi tipo18, n°877) and the run duration is about 2.75 hours.
After the run, the gel was placed on a trans‐illuminator UV 312 nm (Vilber Lourmat, model TFX 20M) and the expected band (1500 bp) was excised with a clean scalpel. The weight of the cut band was determined (balance JJ100, FALC, n°630201001) and transferred to a tube of 1.5 ml. 200 µL of buffer NT1 (Macherey‐Nagel, n°740609.250) was added for each 100 mg of agarose gel. The sample was incubated 10 min at 50°C (thermobloc BBD2, Grant Boekel, n°7W9906001) with vortexing every 3 minutes until the gel slice was completely dissolved. A column from the kit was placed into a collection tube (2 mL) and a maximum of 700 µL of sample was charged. The whole was centrifuged (minispin, Eppendorf, n°5452) for 30 seconds at 11,000 G. The flow‐through was discarded and the column was placed back into the collection tube. If the sample volume was more than 700 µL, the centrifugation step was repeated. 700 µL of buffer NT3 (Macherey‐Nagel, n°740609.250) was added to the column and centrifuged for 30 seconds at 11,000 G. The flow‐through was discarded and the column was placed back into the collection tube. This step was realised twice. The silica membrane of the column was dried by centrifugation for 1 minute at 11,000 G and incubation at 70°C for 5 minutes. The column was placed into a new tube of 1.5 mL and 50 µL of demineralised water is added for the elution. The whole was incubated at RT for 1 minute and centrifuged for 1 min at 11,000 G. The elution step was realised twice.
After the elution and to confirm the purification step, 1 µL of the sample was charged on a 1% (w/v) agarose gel as described in the section 2.1.4.
2.1.6 Sequencing
The sequencing of amplicons was performed by the company Macrogen EU (Meibergdreef, Amsterdam, The Nederlands), according to the Sanger method.
2.1.7 Bioinformatics analysis
2.1.7.1 FinchTV
The chromatograms obtained for the sequencing of amplicons were analysed by bioinformatics software FinchTV 1.4.0. This application is free and was developed by Geospiza Inc. (2004‐2006). FinchTV allows determining the correct allocation of the positions of the nucleotide bases, and then manually modifying the sequence to then be exported in FASTA format, so it can be used in the subsequent analyses.
2.1.7.2 BLAST
The Basic Local Alignment Search Tool (BLAST) is an online software who finds regions of local similarity between sequences. The program compares nucleotide sequences to sequence databases and calculates the statistical significance of matches using a heuristic algorithm. BLAST can be used to infer functional and evolutionary relationships between sequences as well as help identify members of gene families [65].
The sample sequences were compared with the 16S ribosomal RNA sequences (Bacteria and Archaea) database of the program to find the most similar strains. The 10 first similar sequences found in this database were used to build the phylogenetic tree.
‐ 11 ‐ 2.1.7.3 MEGA 7 Molecular Evolutionary Genetics Analysis (MEGA) is an integrated tool for managing automatic and manual sequence alignment, mining web‐based databases, deducting phylogenetic trees, evaluating rates of molecular evolution, and testing evolutionary hypotheses. To access this software connect to the Windows systems [66]. 2.1.8 Strain glycerol stock (SGS) The strains isolated from pure cultures were directly taken under sterile conditions with a platinum loop and added in 5 mL of marine broth medium. The cultures were stored overnight at 30°C and 220 rpm. 0.5 mL of the culture is mixed with 0.5 mL of sterile 40% (v/v) glycerol (Sigma, n°G5516) to arrive at a final concentration of 20% (v/v) of glycerol. The SGS was conserved at ‐20°C. 2.1.9 Protease analysis 5 µL of SGS was added in 5 mL of MB and incubated overnight at 30°C and 220 rpm. The culture was centrifuged (Thermo Scientific SL16R, n°75004030) at 1800 G during 20 minutes at 4°C. 10 µL of the supernatant was mixed with 10 µL of native buffer 2x (100mM Tris‐HCl (Sigma, n°T5941), 4% (w/v) SDS (Sigma, n°62862), 20% (v/v) glycerol (Sigma, n°G5516) and 0.2 % (w/v) bromophenol blue (Bio‐ Rad, n°133538A)). 15 µL of the obtained solution was charged per well in the stacking gel. 8 µL of the pre‐stained ladder (SeeBlue® Plus2, novex, n°LC5925) was charged in the well. The conditions for the samples migration were the following: 100 W, 160 V and 15 mA until the samples were entered in the resolving gel after the current was raised to 25 mA (electrophoresis power supply EPS601, n°56327481). For one analysis the gel was prepared using the following reagents (Table 4): Table 4: Preparation of the entire gel for the protease analysis. Resolving gel [mL] Stacking gel [mL] H2O demineralised 1.15 0.68 Gelatine stock solution 0.45 ‐ 30% Acrylamide mix 2 0.17 1.5 M Trizma pH 8.8 1.3 ‐ 1 M Trizma pH 6.8 ‐ 0.13 10% SDS 0.05 0.01 10% APS 0.05 0.01 TEMED 0.002 0.001
Gelatine (Sigma, n°G7765); 30% Acrylamide mix (Sigma, n°A3574); Trizma (Sigma, n°T1503); SDS (Sigma, n°62862); APS (Sigma, n°A3678); TEMED (Sigma, n°T9281).
The concentration of the resolving gel was usually 12% of acrylamide. The gelatine stock solution had a concentration of 6 g/L. The two last components must be added just prior to casting for the both gel. The resolving gel corresponded to the lower part of the entire gel and the stacking gel to the upper part. The migration of the samples was realised inside the running buffer (25 mM Trizma (Sigma, n°T1503), 192 mM glycine (Sigma, n°G8898) and 0.1% SDS (Sigma, n°62862)) [67].
After the migration of the samples, the gel was washed with the washing buffer (2.5% Triton X‐100 (Sigma, n°T9284) and 0.02% NaN3 (Serva, n°30175)) during 10 minutes at RT. The gel was then
treated for the staining with the activation buffer (1.5% Triton X‐100 (Sigma, n°T9284), 0.02% NaN3
(Serva, n°30175), 2 mM CaCl2 (Carlo Erba, n°433381) and 50 mM Trizma (Sigma, n°T1503), pH was
adjusted at 7.5) for 1 hour at 50°C. The staining was carried out overnight with the colorant R250 (0.25% (w/v) Coomassie blue (Merck, n°12553), 45.5% (v/v) methanol (Sigma, n°32213) and 9% (v/v) acetic acid (Sigma, n°33209)).
The destaining was then realised in three steps of 1 hour with fresh destaining buffer (5% (v/v) methanol (Sigma, n°32213) and 7.5% (v/v) acetic acid (Sigma, n°33209)). The destained gel was conserved in demineralised water.
2.1.10 SDS‐Page
5 µL of SGS was added in 5 mL of MB and incubated overnight at 30°C and 220 rpm. The culture was centrifuged (Thermo Scientific SL16R, n°75004030) at 1800 G for 20 minutes at 4°C. 2 mL of the supernatant was recovered and lyophilised (lyphilisator VaCo 2‐E, Zirbus technologie, n°2366) overnight. The lyophilisate was dissolved with 150 µL of demineralised water and vortexed gently. 10 µL of the obtained solution was mixed with 10 µL of native buffer 2x (same preparation as section 2.1.9). 15 µL of the obtained solution was charged per well in the stacking gel. The ladder used and the condition of the migration has been carried out as the protease analysis (section 2.1.9). For one analysis the gel was prepared using the following reagents (Table 5): Table 5: Preparation of the entire gel for the SDS‐Page analysis. Resolving gel [mL] Stacking gel [mL] H2O demineralised 1.15 0.68 30% Acrylamide mix 2 0.17 1.5 M Trizma pH 8.8 1.3 ‐ 1 M Trizma pH 6.8 ‐ 0.13 10% SDS 0.05 0.01 10% APS 0.05 0.01 TEMED 0.002 0.001 30% Acrylamide mix (Sigma, n°A3574); Trizma (Sigma, n°T1503); SDS (Sigma, n°62862); APS (Sigma, n°A3678); TEMED (Sigma, n°T9281). The concentration of the resolving gel was usually 12% of acrylamide. The two last components must be added just prior to casting for the both gel. The resolving gel corresponded to the lower part of the entire gel and the stacking gel to the upper part. The running buffer used is the same than in section 2.1.9. After the migration of the samples, the gel was washed with milliQ water during 5 min at RT. The gel was then fix with the destaining solution (40% (v/v) methanol (Sigma, n°32213), 10% (v/v) acetic acid (Sigma, n°33209), 50% (v/v) demineralised water) for 25 min at RT. To eliminate the residue of acid acetic the gel was rinsed 3 times during 45 min at RT and overnight with demineralised water. The gel was sensitised with the solution S (0.08% (w/v) sodium thiosulfate (Sigma, n°S6672)) for 5 min at RT and then rinsed two times with demineralised water for 1 min (each).
‐ 13 ‐ The gel was incubated in chilled silver solution (0.4% (w/v) silver nitrate (Sigma, n°31630)) at 4°C for 60 min and then rinsed two times with demineralised water during 1 min (each). The gel was developed with the developing solution (0.04% (v/v) formaldehyde (Sigma, n°F8775), 2% (w/v) sodium carbonate (Sigma, n°31432)) until to see the coloration expected (grew‐brown colour) and then the staining was stopped immediately with the quench solution (1% (v/v) acetic acid (Sigma, n°33209). The gel was stored in the quench solution at 4°C.
2.1.11 Cellulase analysis
The preparation of the samples, the ladder used and the condition of the migration has been carried out as the SDS‐Page analysis (section 2.1.10). For this analysis, as positive control, a cellulase from Aspergillus niger (Sigma, n°22178) had added to a final quantity of 8 µg per lane. For one analysis the gel was prepared using the following reagents (Table 6): Table 6: Preparation of the entire gel for the cellulase analysis. Resolving gel Stacking gel [ml] H2O demineralised 1.15 mL 0.68 CMC 0.01 g ‐ 30% Acrylamide mix 2 mL 0.17 1.5 M Trizma pH 8.8 1.3 mL ‐ 1 M Trizma pH 6.8 ‐ 0.13 10% SDS 0.05 mL 0.01 10% APS 0.05 mL 0.01 TEMED 0.002 mL 0.001 CMC (Sigma, n°C5678); 30% Acrylamide mix (Sigma, n°A3574); Trizma (Sigma, n°T1503); SDS (Sigma, n°62862); APS (Sigma, n°A3678); TEMED (Sigma, n°T9281).
The concentration of the resolving gel was usually 12% of acrylamide. The CMC added had a concentration of 0.2 % (w/v). The two last components must be added just prior to casting for the both gel. The resolving gel corresponded to the lower part of the entire gel and the stacking gel to the upper part. The running buffer used is the same than in section 2.1.9. After the migration of the samples, the gel was washed with the washing/activation solution (0.1M sodium succinate (Sigma, n°S2378), pH adjusted at 5.8) twice for 6 minutes at RT. The gel was then treated for the staining with the washing/activation solution for 40 minutes at 50°C. The staining was carried out with the colorant Congo red (0.1% (w/v) in water solution, (Sigma, n°C6277)) for 20 minutes at RT. The destaining was then realised in three steps of 1 hour with fresh destaining solution (1 M NaCl (Sigma, n°S7653)). To enhance the visualization of the band, 0.1% (v/v) of acid acetic (Sigma, n°33209) was added in the destaining solution for the last step. The gel destained was conserved in demineralised water.
2.1.12 Esterase analysis
The esterase activity assay was tested qualitatively on ester myristate agar plate (0.14% (w/v) 4‐ nitrophenyl myristate (Sigma, n°BCBP9506V); 1.5 % (w/v) BactoAgar (BD, n°214010), pH adjusted at 7.0). The myristate was dissolved in DMSO, filtrated with a 0.20 µm filter and then added after the autoclaving of the medium and before the pouring of the plate. The sample was plated as a drop and the agar plate was incubated at 37°C during 24 hours. The esterase reaction was observed through the formation of a clear halo after incubation. A 15 µL drop of MB has been used as negative control. 2.1.13 Lipase analysis The determination of the lipase activity was assessed qualitatively by the growth of bacterial cultures for 10 days at 30°C on plate containing marine broth, 0.001% rhodamine‐B (gave by the department of chemistry), 1% olive oil (Fratelli Madonia, n°L.267/15/extra c) and 1.5% Bactoagar (BD, n°214010). The solution of rhodamine‐B and olive oil were filtrated at 0.20 µm, and then added after the autoclaving of the medium and before the pouring of the plate. 5µL of SGS was deposed as a drop on the plate. The protocol performed allows to evaluate, through the use of rhodamine‐B dye, such bacterial strains are able to activate the enzyme for the use of olive oil. In fact, the bacteria that possess the lipase is capable to hydrolysed fats, animal and vegetable oils (such as olive oil) and free fatty acids (saturated and unsaturated such as oleic acid). The liberation of fatty acids due to the decrease of pH is visible by the change in colour of rhodamine‐B. The positivity of the test is given by the presence of an orange‐pink fluorescence exposure under UV light following the incubation. 2.1.14 Antimicrobial assay The first day, isolated strains were plated on MA and incubated overnight at 30°C to have a dense layer of culture. The same day, some plates were prepared with a small layer (7 ml) of LB agar (25.0 g/L of Luria Broth base (Invitrogen, n°12795‐084) and 1.5% (w/v) of BactoAgar (BD, n°214010). The medium was before sterilised at 121°C, 1 atm for 20 min. The second day, some cells of Escherichia coli and Kocuria rhizophila (gift of P. Cinà) were added in 5 mL of demineralised water (two different tubes, one for E.coli and one for K.rhizophila) and the
absorbance OD600 (Spectrophotometer Jasco, ubest‐50, n°2332) of the suspensions were measured. Then 100 µL of the suspension (OD600 is between 1.0 and 1.2) was added in 5.0 mL of sterilised soft agar at 45°C (25.0 g/L of Luria Broth base (Invitrogen, n°12795‐084) and 0.7% (w/v) of BactoAgar (BD, n°214010) and poured on the plate containing the small layer of LB agar. The plates containing the soft agar were let until solidification. A plug with a diameter of about 2 cm was cut from MA plates of each dense bacterial layer and put on the soft agar containing E.coli or K.rhizophila. The plates were incubated overnight at 37°C.
‐ 15 ‐
2.2 Independent culture method
2.2.1 DNA extraction
The following method originates from the genomic DNA purification kit by Thermo Scientific (n°K0512).
The coelomic fluid from P.lividus was extracted as described in the chapter 2.1.1. After the harvesting and collection in 10 mL sterile tubes (Sarstedt, n°62.9924.284), each sample was centrifuged (Thermo Scientific SL16R, n°75004030) at 2800 G for 10 minutes. The pellet was suspended in 200 µL of TE buffer (10 mM Trizma (Sigma, n°T1503), 1 mM EDTA (Sigma, n° E6758), pH adjusted at 8). The sample was mixed with 400 µL of lysis solution (from the kit) and incubated at 65°C for 5 minutes. 600 µL of chloroform (Sigma, n°32211) was immediately added and the solution was gently mixed by inversion (5 times) and centrifuged at 11,000 G for 2 minutes. Precipitation solution was made by mixing 720 µL of sterile demineralised water with 80 µL of 10x concentrated precipitation solution (from the kit). The upper aqueous phase containing DNA was transferred into a new tube and 800 µL of freshly prepared precipitation solution was added. The solution was gently mixed by serval inversion at RT and centrifuged at 11,000 G for 2 minutes. The supernatant was completely removed and the DNA pellet was dissolved in 100 µL of NaCl solution (from the kit). To eliminate the RNA present in the sample, a RNAse A solution (TermoFisher Scientific, n°EN0531) was added to a final concentration of 0.2 mg/mL, mixed by vortexing and incubated at 37°C for 10 minutes. 300 µL of cold ethanol (Fluka, n°02860) was added for the precipitation of DNA and the sample was stored for 10 minutes at ‐20°C. Ethanol was removed and the pellet was washed once with a solution of 70% cold ethanol. The DNA pellet was dissolved in 100 µL of sterilised water by gentle vortexing. 5 µL of the products of extraction were charged on a 1% agarose gel (preparation of the gel is describe in section 2.1.4) and separated by electrophoresis. 2.2.2 DNA Quantification To determine the DNA concentration and quality of the samples, the spectrophotometer NanoDrop (Nanodrop ND‐1000, n°Ed1/0207/152) was used. This instrument is a UV‐Visible spectrophotometer and need only 1 µL of sample for the analysis. It quantifies very accurately by measuring the optical density of the sample. The Nanodrop uses a technology based on surface tension of small liquid volume that exert when it is placed between two neighbouring surfaces. Thus the drop of sample placed on the reading plate, creates a liquid column directly in contact with two optical fibres, this analysis is very simple and fast. The wavelength used to measure the concentration of DNA is 260 nm.
The Nanodrop also provides the degree of purity of the sample, by providing the relationships between:
260/280: indicates the contamination by proteins if the ratio is bigger than 1.8.
260/230: indicates the contamination by carbohydrates and phenol. The optimal value is 2.2 and lower values indicate contamination.
![Figure 3: Upper side (aboral pole) of dark violet Paracentrotus lividus [45].](https://thumb-eu.123doks.com/thumbv2/123doknet/14940440.666514/14.892.99.727.489.707/figure-upper-side-aboral-pole-violet-paracentrotus-lividus.webp)
![Figure 7: Amplified region on the 16S rDNA [64].](https://thumb-eu.123doks.com/thumbv2/123doknet/14940440.666514/18.892.103.792.500.692/figure-amplified-region-on-the-s-rdna.webp)