Publisher’s version / Version de l'éditeur:
Journal of Glaciology, 36, 123, pp. 188-198, 1990
READ THESE TERMS AND CONDITIONS CAREFULLY BEFORE USING THIS WEBSITE. https://nrc-publications.canada.ca/eng/copyright
Vous avez des questions? Nous pouvons vous aider. Pour communiquer directement avec un auteur, consultez la première page de la revue dans laquelle son article a été publié afin de trouver ses coordonnées. Si vous n’arrivez pas à les repérer, communiquez avec nous à [email protected].
Questions? Contact the NRC Publications Archive team at
[email protected]. If you wish to email the authors directly, please see the first page of the publication for their contact information.
NRC Publications Archive
Archives des publications du CNRC
This publication could be one of several versions: author’s original, accepted manuscript or the publisher’s version. / La version de cette publication peut être l’une des suivantes : la version prépublication de l’auteur, la version acceptée du manuscrit ou la version de l’éditeur.
Access and use of this website and the material on it are subject to the Terms and Conditions set forth at
A Model for scaling avalanche speeds
McClung, D. M.
https://publications-cnrc.canada.ca/fra/droits
L’accès à ce site Web et l’utilisation de son contenu sont assujettis aux conditions présentées dans le site
LISEZ CES CONDITIONS ATTENTIVEMENT AVANT D’UTILISER CE SITE WEB.
NRC Publications Record / Notice d'Archives des publications de CNRC:
https://nrc-publications.canada.ca/eng/view/object/?id=6955f276-60f0-4742-bb46-815cd7fb22f1
https://publications-cnrc.canada.ca/fra/voir/objet/?id=6955f276-60f0-4742-bb46-815cd7fb22f1
S e r
T H 1
N 2 1 d
N.
1 6 9 3
National Research
Conseil national
'
'
*
1
Council Canada
de rechemhes Canada
c,2
BLRG.
- - - -
Institute for
lnstitut de
Research in
recherche en
Construction
construction
A Model for Scaling Avalanche Speeds
by D.M. McClung
Reprints are reproduced by permission of the
International Glaciology Society
October 1990
Reprinted from
Journal of Glaciology
Vol. 36, No. 123
pp. 188-198
(I RC Paper No. 1693)
NRCC
32363
- NRC-
CISTIL I B R A R Y
* +I
MRR
28
iggi
'
1
L'auteur pr6sente un modele de pr6vision des vitesses sur la pente bas6 sur la
vitesse et la distance de glissement des avalanches de neige ainsi que sur la notion
d'6coulement granulaire dense. Les mesures sur le terrain effectuks indiquent que
les vitesses et les distances de glissement sont presque ind6pendantes de la pente du
parcours, une fois choisie la longueur de mise 2I 6chelle. L'auteur explique ces
r6sultats 2I I'aide de la notion d'ecoulement granulaire. La caract6ristique la plus
importante du modele (et des donn6es sur la vitesse) est le fort gradient de vitesse
dans la zone de glissement. Ces resultats montrent qu'il faut prbvoir la distance de
glissement avec une grande prbcision lorsqu'on envisage d'Qiger des constructions
ou des ouvrages de d6fense.
Journal of Glaciology, Vol. 36, No. 123, 1990
A
MODEL
FOR SCALING AVALANCHE SPEEDS
B y D.M. MCCLUNG
(Avalanche Research Centre, Institute for Research in Construction,
National Research Council of Canada, Vancouver, British Columbia V6S 2L2, Canada)
ABSTRACT. Snow-avalanche speeds, run-out distances,
-
and the concepts from dense granular flows are combined in a model for prediction of speeds along the incline. Field measurements indicate that speeds and run-out distances are nearly independent of path steepness once a length is chosen to scale them. Application of granular-flow concepts explains these results. The most important feature of the model (and the speed data) is the steep gradient of speeds in the run-out zone. These results emphasize the need for high precision in run-out prediction when construction or defences are contemplated.of speeds in the deceleration phase is very steep. Therefore, friction is very high at the end of the run-out and speeds there are very sensitive to stop position. Examples are given in this paper which show that it is difficult to match (and therefore predict) speed data unless a stop position is chosen.
In this paper, the second part of the problem, that of speed definition, is developed. Since choice of a run-out position is necessary before speed calculations are attempted in the model, this topic is briefly reviewed first.
PART I. AVALANCHE RUN-OUT DISTANCES INTRODUCTION
The two important elements for land-use planning in snow-avalanche terrain are prediction of avalanche run-out and expected avalanche speeds along the path. Avalanche run-out predictions are used to define safe areas and to aid in decisions on placement of structures. When structures must be built, estimates of avalanche speeds are essential for calculating design impact pressures. In some appli- cations, defences are used to slow, stop, or deflect avalanche debris and the height and design of these barriers is very sensitive to the approach speed of the avalanche mass. These applications combine to make avalanche run-out and speed prediction among the most important topics in avalanche research.
The early attempts to define the engineering aspects of land-use planning and structure placement in avalanche terrain consisted of solving for avalanche speeds and run- out positions simultaneously by selecting friction coefficients for an avalanche-dynamics model. However, McClung and Lied (1987) gave an alternative method for definition of speeds and run-out positions. We proposed that the problem be divided into two parts: run-out prediction and speed definition.
There are good reasons to solve the problem in two stages. Of primary importance is the fact that calculation of avalanche speeds is physically and mathematically very difficult. The complex problem of flowing snow interacting with complicated terrain features is not likely to be solved soon. For the most part, the mechanical properties (including
-
density) are unknown as well as the boundary conditions. Given these uncertainties, it is highly unlikely that presently available dynamics models can be used to predict where avalanches will stop with any certainty. However, there are methods available to define run-out distances independent of the dynamics problem. Once the run-out distance is predicted or found from field evidence, the dynamics problem can be simplified enough to make it possible.When a stop position is defined (methods are given below), the path geometry is completely specified for the dynamics problem. This enables calibration of the dynamics model using avalanche-speed data scaled according to a (then known) path-length parameter and it enables definition of the mean value of the basal friction parameter over the entire length of travel of the avalanche. These considerations make it possible to attack the dynamics problem. There is also an additional advantage in defining the stop position first: avalanche-speed measurements show that the gradient
In practice, the most common methods of determining avalanche run-out distances are by field inspection at the sites for evidence of destructive effects from previous avalanches or by collection of long-term data on avalanche run-out at sites. When these methods are not available, I believe that statistical prediction (based upon terrain features) represents the most promising quantitative method thus far presented. Unlike physical models, statistical prediction allows run-out distance uncertainties to be defined in standard statistical terms.
The pioneering efforts in statistical run-out prediction (Bovis and Mears, 1976; Lied and Bakkehoi, 1980; Bakkehai and others, 1983) were based on regression analyses of topographic parameters collected for a set of avalanche paths in a mountain range. However, McClung and others (1989) and McClung and Mears (in press) analyzed data from five mountain ranges and concluded that avalanche run-out distances obey a Gumbel (extreme value) distribution. I believe this approach is superior and I have employed it in this paper. However, some avalanche workers still use the regression approach and it could be employed as well in the first part of the model proposed in this paper.
The procedures for fitting a set of data points to an extreme-value distribution are well known but previous work of mine documents one of the simplest: fitting a linear regression line through a set of plotting positions defined from a data set of run-out distances. The parameter fitted to the distribution is defined as a dimensionless run-out ratio:
Ax tan B - tan a
-
.zX B
tan a-
tan 6where a, 4, 6 are three angles defined for each avalanche path in the data set and Ax,
Xg
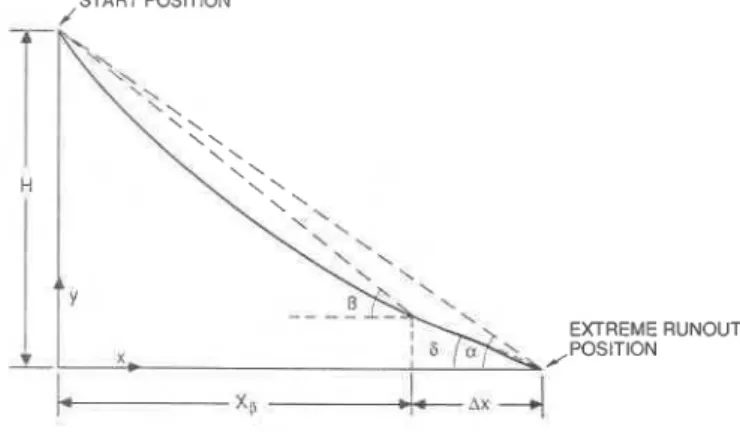
are two horizontal distance measurements defined in Figure 1. The angle a is defined by sighting from the extreme point reached by avalanches in the past to the start position; B is obtained by sighting froom the position where the slope angle first declines to 10 to the starting point; 6 is defined by sighting between the positions marked for a and B.The position defined by B (the B point) is taken as a reference point from which to calculate run-out. The run- out distance (Ax) (time-scale
-
100 years) is the horizontal reach from the B point to the extreme run-out position.START POSITION J
1L
Y
EXTREME RUNOUT
Fig. 1 . Definition of geometry to describe extreme avalanche
I
run-out.I
The length ( X B ) is the horizontal distance between the starting point and the B point.Given a data set for which these parameters are measured for a given mountain range, it becomes possible to predict the run-out ratio as a function of the non- excedance probability, p, of the Gumbel distribution. Let x Ax/XB, then if f(x) is the probability density function, p = Pr(x d xp) where
Given a value, xp, lOOp (Yo) values of x in the distribution have values less than xp. In Equation (2), u and b are the location and scale parameters for the distribution. For the extreme-value distribution, the equation of the regression line through the plotting positions is defined by:
tends to make the flowing material appear as a body of low-density material moving like a turbulent fluid. However, in almost all cases there is a dense core of material at the base and it is the internal deformation of this core and its interaction with the sliding surface which I believe dominates the motion resistance of large avalanches to determine their speeds.
Field observations and measurements show that avalanche speeds and run-out are quite sensitive to the physical condition of the surface over which the avalanche flows. Soft or wet surfaces introduce high friction which reduces avalanche speeds and run-out. In this paper, only one type of avalanche is modelled: one characterized by minimum friction, maximum run-out (time-scale
-
100 years) and maximum speed. For this reason, effects such as plowing into new snow or flow over a wetted surface are not accounted for explicitly. Also, entrainment and deposition of snow as the avalanche travels along the path are not explicitly included; the present knowledge about these effects is too meager to introduce them without-
speculative assumptions.In practical usage, simple models which do not attempt
-
to describe the internal deformation of the flowing material-
or which do not call for precise boundary conditions have.
been dominant for 35 years. Since the mechanical propertiesof flowing snow have not been measured and the boundary conditions for avalanche flow can only be speculated about, it is clear that any of the more complicated models (e.g. Norem and others, 1987) must rely upon assumptions rather than data for model calibration.
The approach here is to develop a method for scaling speeds similar in scope to the popular models of the past (Voellmy, 1955; Perla and others, 1980). The scaling pro- cedure is based upon trends expected from results on dense, granular flows including both the general form of the boundary conditions at the upper and lower flow boundaries and the deformation properties of dense granular materials. Using these results, the parameters in the model are determined from speed measurements and run-out distances. Since no attempt is made to describe the internal deformation or detailed physics of avalanche motion (see e.g. Norem and others (1987) for a more detailed model), the flow depth of the avalanche is not predicted and only the transport speed of the avalanche is given. My model is so simple there is no difference between the frontal speed and the center-of-mass speed.
Previous papers (McClung and others, 1989; McClung and Mears, in press) give values for u (0.084.37) and b (0.07-0.21) for five individual mountain ranges including more than 500 avalanche paths.
From Equation (3), it is possible to define a mapping of run-out distances for a given avalanche path as a function of p. For example, with u and b determined for a given range, the position defined by ( A x / X ~ ) ~ , ~ ~ = u
+
4.6b, gives a run-out position which 99% of avalanche run-out ratios in the data set will not exceed (usually a fairly safe location).Once a run-out position (or a mapping of distances) is determined by one of the methods above, the path geometry is completely determined and the dynamics problem can be tackled by applying Part 11 of the model discussed below, which constitutes the main thrust of this paper.
PART 11. ESTIMATION O F AVALANCHE SPEEDS
ALONG THE INCLINE
I
PROBLEM DEFINITION AND PHYSICAL DESCRIPTIONLarge dry-snow avalanche flows have a dense core of flowing material in contact with the bed over which they flow. Experience and field data (e.g. McClung and Schaerer, 1985) show that this type of avalanche produces the combination of highest impact pressures and longest run-out. Such a flow is called a dry-flowing avalanche: the design avalanche for a placement and design of structures.
Often for dry-flowing avalanches, the dense core of material at the base is obscured from view by material suspended in the air by turbulent eddies around the periphery of the avalanche. This material (called powder)
TRENDS FROM GRANULAR-FLOW RESULTS
Field observations of avalanche deposits show that significant heat is generated by particle collisions in the flow. Often, large dry avalanches have moist snow in their deposits. The small amounts of moisture present subsequently freeze to produce very hard snow in the deposit. The simple observations that mean particle size becomes smaller (due to fracturing and abrasion) the further the avalanche travels and, that the snow from dry avalanches can be moist in the deposit, strongly indicate that the volume fraction filled by particles is high in flowing avalanche snow. Simple arguments from avalanche speed and impact- pressure measurements were given by McClung and Schaerer (1985) to estimate roughly the volume fraction filled by solid material in the flowing snow. These estimates indicate
-
that the volume fractions filled by snow particles and air are the same order of magnitude and therefore particle collisions are expected to be the dominant mechanism of momentum transport within and at the lower boundary of'
the flowing mass.In flowing snow avalanches, the density of the mixture of air and solid particles in the core is high and the effects of the air can be entirely neglected in a mechanical description. There are two reasons for this: (1) large density ratio between the particles and the air (10~-10~); (2) presence of particles even in small amounts (Ackermann and Shen, 1978) will suppress any turbulence in the interstitial air. For dry-avalanche flows, the particles are a mixture of ice and air with densities that must range from about 200 kg/m3 for the larger particles (McClung and Schaerer, 1985) to 917 kg/m3 (ice) for the smallest fragments. Except for the initial stage of motion, I believe that the core of a
dry flowing avalanche can be described as a dense granular flow. A dense granular flow is one in which the fraction of the flow volume filled by the grains (called the volume fraction, v , here) is high enough that particle collisions dominate the motion resistance within the flow and at a solid boundary over which the material flows. A list of
relevant properties from dense granular-flow models
(including computer studies) and laboratory measurements is given in Appendix A as they are used as a basis for the model developed.
The granular-flow results (Appendix A ) may be
interpreted along with field observations of avalanches to produce a rough qualitative picture of how friction might vary as an avalanche moves down-slope. In chronological order, the sequence is expected to be: (1) initial bed surface drops below static values to a low value by propagation of shear fractures underneath the slab to produce low friction initially (McClung, 1987); (2) break-up of slab material into particles and blocks of irregular shape and a distribution of sizes by destructive collisions with the roughness elements along the path and by particle-particle collisions; (3) as the
-
material moves down-slope over steep terrain, granular flowbecomes possible, the rate of deformation (basal shearing)
.
increases, causing basal friction to increase; (4) at some'
point when low slope angles are traversed, locking begins to occur in the upper part of the flow; this effect forces the deformation to be contained in a narrower band at the base
i of the flow to maintain high shear rate and high friction
I there (e.g. Savage and Jeffrey, 1981) as locking moves
I towards the base; (5) at a low slope angle, the transport
speed slows, the rate of basal shearing decreases, and rubbing friction emerges as the volume fraction increases in the basal region. This causes the friction to increase towards a high static value. No theories or data are available to describe precisely when one phase of motion stops and another begins.
The discussion above suggests that basal friction is generally expected to increase as the avalanche moves down-slope if the flowing material behaves as a dense granular flow. If shear and normal forces are strongly coupled throughout the core (including the basal region), avalanche-speed data are also consistent with this picture (shown in a later section).
CENTER O F MASS MODEL WITH GRANULAR DRAG AND CENTRIPETAL EFFECTS
I believe the present knowledge about avalanche speeds
and flow properties from field observations and
measurements is only sufficient to describe the motion of the transport speed (either center of mass or frontal speed) of the mass along the incline. In my model, the flowing mass is treated as a continuum initially (in Appendix B) and then the formulation is collapsed to a simpler model in which only the transport speed is specified. Earlier models (Voellmy, 1955; Salm, 1979; Perla and others, 1980) of the
same class as the present model were developed by
specifying friction parameters on a largely ad hoc basis
without sufficient attention to boundary conditions. The resulting model in this paper appears mathematically similar to the earlier models but the physical assumptions, the final
mathematical formulation, and the assumed boundary
conditions are entirely different. I believe it is important to develop the equations from a continuum approach to emphasize the differences between this and the earlier
models. The equation to describe (see derivation in
Appendix B) the center of mass speed u is:
I
t(du2/ds) = g(sin J, - pcos J,) - Douz. (4)In Equation (4), d S is an element of path length, J, is local
slope angle, and g is acceleration due to gravity. The
friction terms are: (1) p(S), speed-dependent drag from granular flow at the base of the flow, and (2) Do(S) is the sum of two terms: turbulent air/dust drag at the top of the flow and drag due to centripetal forces for motion on a curved path. Specifically,
where r(S) is radius of curvature of the path,
p
is mean value of density in the core of the avalanche, pt is density (air/snow) at the top of the core, h is flow depth, and Cf is a drag coefficient for turbulent air/dust drag at the top of the core (see further details in Appendix B).Equation (4) is mathematically similar to one derived by Salm (1979) and Perla and others (1980), henceforth called the PCM model. There are, however, important differences: only one drag term (granular) is assumed at the bottom of the flow and this is strongly coupled to the normal force there. Also, since p is taken to vary with S ,
it describes speed-dependent drag; since p = p(S) and
u = u(S), it is implied that p = p(u). McClung and Schaerer (1983) showed that taking p and Do constant (the usual assumptions for applying the PCM model, Salm's model, or
Voellmy's model) makes it impossible to explain
avalanche-speed data.
A second difference in the present model is that turbulent (air/dust) drag is assumed only at the top of the flow. In the formulations of PCM, Salm or Voellmy, a drag term independent of normal force and proportional to uZ was included (on an ad hoc basis) to account for turbulent drag at the base of the flow or around the upper periphery. This drag term is negligible for a description of dense granular flow at the base of a flowing avalanche: the presence of particles in significant numbers will prevent turbulence from forming and the high volume fraction filled by solids will guarantee that shear and normal forces are transferred through collisions.
The PCM model also included a drag term proportional to u2 to account for plowing into new snow. The present model could account for plowing i/ the resistive forces are coupled in a Coulomb type of relationship (Equation (Bll)). Because the value of p is the mean value over the length of the flow, plowing could be interpreted as implying higher mean basal resistance due to conditions at the front of the avalanche. Since my model is calibrated from field
measurements of maximum speed and run-out, plowing
effects of the type described above are implicitly included. The same remark applies to entrainment and deposition of snow and air into the moving avalanche: these effects are
not included explicitly; however, since the model is
calibrated from field data, they are implicitly included.
Even though Equation (4) appears mathematically
similar to the PCM model, the physical and mathematical differences (outlined above) are crucial for calculating avalanche speeds (see McClung and Schaerer (1983) for a further discussion). The continuum development in Appendix B clarifies and emphasizes these differences.
QUANTITIES USED IN MODEL CALIBRATION
Once a run-out distance is selected by one of the methods given in Part I, it is possible to estimate two quantities necessary to calibrate the model: maximum speed and mean value of basal friction.
Consider an avalanche which reaches maximum speed,
um, after traversing a length of path Sl (acceleration
phase). Integration of Equation (4) ( p = p(S), r = r(S), Do = Do(S)) from 0 to S1 gives
-
where is the mean value of g(sin J,
-
pcos J,) and D~U: is the mean value of Dou2 over S1.Similarly, integration over the deceleration phase (S1 to So) where So is total path length to the stop position gives
-
-
f ~ &
= - y-(s0-
s,)+
D,u~(s, - s,) (7)-
where
7-
and D,U? are mean values over the decelerationphase.
Elimination of S, from Equations ( 6 ) and (7) gives
where the constant C is a function of the constants
7-,
K ,
DT,
andDZ
with (so)+ (a known quantity). Equation (8) is useful in two ways: (1) it gives a rough upper limit on design maximum speed for an avalanche path with known run-out once an upper-limit value for C is determined, and (2) the upper- limit value for C is used to calibrate the speed model in the present paper (in a later section).
From Figure 1, with sin $ = dy/dS and cos $ = dx/dS,
H vertical drop, integration of Equation (4) from 0 to So
gives
-
p = t a n a
[
1?rill
(9)-
where is the mean value over the range 0 to So.
Equation (9) restates a well-known result: if drag terms due to centripetal force and turbulent air/dust are negligible, the mean value of p is defined by tan a (a known quantity in the present model). The results of Equations (8) and (9) will be used to calibrate the model in a later section.
TURBULENT AIR/DUST DRAG
Dry avalanche flows are usually surrounded by a dust cloud of material over the dense core which contacts the sliding surface. I measured impact pressures using small load
cells through the vertical cross-section of avalanches
(McClung and Schaerer, 1985). The results show that the frequency of particle impacts decreases with height above the sliding surface. At the top of the core, the pressure cells recorded only sporadic impacts which suggests that the top of the core consists of saltating particles. It is likely that the effective surface roughness may be appreciable for turbulent snow dust interacting with saltating particles at the top of the flow.
For turbulent flow over a rough surface, Schlicting (1979, p. 653-59) gave an expression for the drag coefficient
where Lo is length and k is roughness height. Mellor (1968)
suggested a value Cf = 2 x from estimates of drifting
snow over a smooth surface. With Lo = lOOm (length of
avalanche flow) and k in the range 0.1-1 m, Equation (10) suggests that Cf can be an order of magnitude larger than that expected for a smooth surface.
From impact experiments, McClung and Schaerer (1985) estimated the average density for dry flowing avalanches to be -100 kg/m3, and for a powder avalanche we estimated
p
to be near 10 kg/m3. From these results, an upper limit on the ratio (pt/F) can be taken to be about 0.1 i n Equation(5). Given that large avalanches have flow depths,
h = 2-5 m, an approximate maximum value for Do can be
estimated from the quantities above (pt/jS = 0.1, Lo/k =
Cf = 1.2 x lo-', h = 2 m ) to give D,-' = 3333m. Using this rough estimate, it is evident from Equation (4) that turbulent drag at the upper surface of flow is not usually expected to have much effect until speeds are near 30 m/s. The product D0Sp must be greater than
f
for this drag term to have a significant effect on speeds. Since virtually all applications of speed models are in the run-out zone where speeds are less than 30 m/s, turbulent air/dust drag is expected to have minor importance in most engineering applications. In applications, it is recommended to input a value of Do as constant all along the path; the determination of p as a function of position is the mostimportant part of the model offered here. Due to
uncertainty in the air-drag coefficient (Equation (lo)), it is most suitable to calculate speed profiles with no air drag and with maximum expected air drag in applications. These two solutions then give upper- and lower-bound estimates for the speed profiles on a given avalanche path.
CENTRIPETAL DRAG TERM
Avalanches often move on curved paths (usually
concave on overall shape). The term in Equation (18) from centripetal acceleration is derived by depth-averagin
the normal force Equation (B7) The term
$uz
simplified by assuming a fairly blunt velocity profile and a depth-averaged density throughout the depth of flow to give Do in Equation (5). In view of the uncertainties, and rough approximations, I feel it is sufficient to input a constant value z / r for this drag term over the entire length of path. A simple method to calculate r is to fit a curve to the
avalanche profile (see Fig. I), for example: y =
ax2
+
bx+
c and then determine the radius of curvature by (negative if convex):When the length r / z becomes comparable to about one-half the total path length traversed, it will influence tbe avalanche speeds in the model. For steep profiles ( B > 40 ),
this term can reduce speeds in the middle section of the path by 10% or more. For avalanche terrain, r generally
increases with distance down-slope and, since the centripetal
.
term is multiplied by u2, the centripetal term usually has little or no effect on speeds in the run-out zone.
NUMERICAL SOLUTIONS
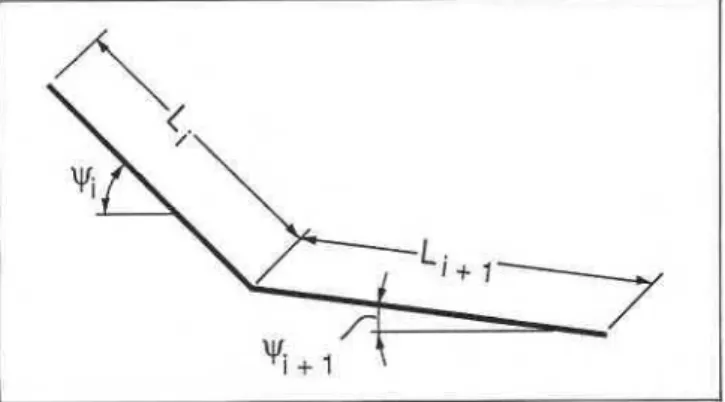
Perla and others (1980) gave a simple method for solving Equation (4). By dividing the slope into small
segments so that $ can be taken constant over each
segment, numerical solutions are easy to obtain. Each segment is assigned an angle $i, a length Li, and friction
I I
Fig. 2. Definition of segments of length Li and slope angle $i for numerical solutions.
values pi = tan bi, Doi. If the speed at the beginning of a segment is up, then the speed u? at the end of the ith segment is given by (see Fig. 2):
where yi = g(sin $i - tan bi cos $i) and Xi = 2Li/DOi. If the avalanche stops before the end of a segment, the distance from the beginning of the segment is:
Equations (12) and (13) are easily programmed for numerical solutions. It is of interest that software developed
by Cheng and Perla (1979) may be used in the general case
.
by replacing their mass to drag parameter with
(l/Doi) and pi with tan bi on each segment.
GRANULAR-FRICTION SCALING MODEL
In order to complete the dynamics model, values for LL
and Do must be specified all along the incline. My approach to the solution of Equation (4) consists of specifying a constant value of Do (curvature and air drag) for a high-speed dry avalanche and the definition of p = tan @(S) at each position on the path. From the analysis of the air-drag term and Equation (lo), variations in p along
the incline dominate the motion resistance almost entirely when speeds are less than about 30 m/s (large avalanches).
Specifying the variation of granular-flow friction along the path is the crux of the model presented here. The formulation must be consistent with the descriptive aspects of avalanche flows, avalanche-speed and run-out distance data, and the mechanics of rapid granular flows. It is tempting to try formulating constitutive equations relating fi
to transport speed, and granular-flow parameters (v, coefficients of restitution, overburden, depth of shearing). However, I believe such a relationship is still somewhat in the future even for engineering applications. Also, the complexity of such a relationship would not be appropriate for the model here which is intended to be as simple as possible.
From avalanche-speed measurements, field observations, and the granular-flow results, I expect that
r
will generally increase as the avalanche moves down-slope. The initial value of friction, po, is expected to be very low. Visual observations of avalanches confirm the trends in speed measurements (e.g. Salm and Gubler, 1985) that the initial-
acceleration is very rapid. The final value of I.L must approach high values close to the static limit in the.
deceleration phase. Avalanche-speed measurements show that deceleration is very rapid near the end of the run-out; this implies very high friction in the final stage of motion.In the middle parts of the path, intermediate values of friction seem likely. In the acceleration phase (with slip at the basal boundary), as the rate of basal shearing builds up, v should decrease at the boundary to increase the dynamic friction. As the descent continues, the speed will reach a maximum (when driving force and drag forces are in balance). From granular-flow results (e.g. Campbell and Brennen, 1985a), it is possible that basal drag might decrease as
v
increases with decreasing slope angle to produce an inflection point in p(S). However, oncev
increases to produce a significant rubbing component on the grains, static friction will begin to emerge and p will
! increase. Therefore, it is possible that the magnitude of p(S)
I may oscillate, but I believe that p must generally increase ' down-slope and I will ignore any inflection point of the
I
relationship r(S). Calculation of such an inflection point will involve precise knowledge of locking mechanics. The analysis by Savage and Jeffrey (1981) shows one possible scenario implying that an inflection point may not exist. By ignoring an inflection point, a simple two-parameter equation relating 1 and S provides an adequate starting point:From Equation (lo), a value for is available once run-out is specified:
I
Elimination of K from Equations (14) and (15) gives Given an approximate initial value (I(,) (or a small range of values), n is the only parameter left to complete definition of the model. Run-out distances and avalanche--
speed data provide the necessary information to estimate n. I expect that d r / d S 2 0 due to the assumption that I(increases in the down-slope direction. The condition d2p/ds2 4 0 implies that friction increases asymptotically as motion proceeds to approach a limiting value (static value) at the stop position. Application of these conditions together implies 0 4 n 4 1. The value n = 0 defines a high friction limit:
r = j i . (17) In practice, a small initial value may be needed to initiate notion for n = 0. Physically, this limit implies that friction jumps to a high value almost immediately. The low friction limit is given by n = 1:
Further justification for the limits 0
<
n<
1 is provided in the next section where data for maximum speed and run-out distances are used to find values of n as a function of B and p.If air and centripetal drag are ignored, data from western Norway (McClung and Lied, 1987) suggest that j7
(or tan a) ranges from 0.325 to 1.15 for the data 2et. If Equation (17) applies to the steepest prffile ( a = 49 ) and Equation (18) for the gentlest (a: = 18 ), limits on p are implied in the range 0.2 to 1.15. Given that initial values of p are expected to be below granular-flow values, this is a reasonable range based on granular-flow models (e.g. Campbell and Gong, 1986) for a material with a fairly low coefficient of restitution.
Estimates of static values for fi for alpine snow are also of interest. Slow laboratory shearing experiments (McClung, 1987) show that the friction angle (ratio of peak shear stress to normal stress at failure) is in the range 1.19-5.67 for alpine snow. Avalanche-slope failure angles imply the ratio is in the range 0.47-1.43. Neither of these ranges will apply precisely to the physical problem here: a locked mass slowing by sliding over a rough surface. Granular-flow models (McTigue, 1978; Savage and Jeffrey, 1981) for hard spheres predict p = 0.85 under rapid shearing when the granular temperature is zero. Static values are expected to exceed this value because the rubbing friction would add to it.
DEFINITION O F MODEL FRICTION COEFFICIENTS FROM RUN-OUT AND SPEED DATA
Once the run-out distance and a value for Do are specified, the values of j7 and So are determined in Equation (16). Analysis of initial avalanche-speed data shows that
ro
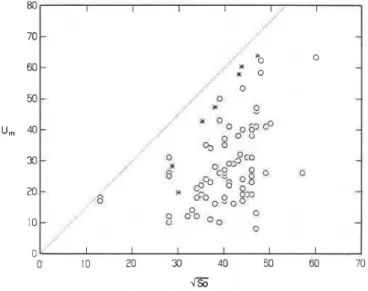
= 0.2 is an adequate approximation. Gubler (personal communication) suggests a value even less than 0.2. Therefore, in order to specify completely the friction along the path, the only parameter left to specify in Equation (16) is the power n. This parameter may be defined using Equation (8) and data from avalanche speeds. The procedure is to calibrate the model using the upper envelope of maximum avalanche-speed data scaled as a function of So. This will allow values of n to be determined as a function of path steepness and run-out position for the design avalanche: the one with minimum friction and maximum speed in the middle part of the pathFigure 3 gives um versus (sol1 for avalanches from Canada (Roger's Pass, B.C.), Switzerland, and Norway. The data collection represents frontal speeds of avalanches with differing mass and mechanical properties moving over terrain with varying surface characteristics and topographic features (Schaerer, 1975; McClung and Schaerer, 1983).
Fig. 3. Maximum speed versus (so)+ for avalanches from Canada (o), Switzerland, and Norway (*). The envelope um = 1.5(so)+ is shown.
Since the data from Canada are obtained from single estimates in the middle of the path, many will not represent precise estimates of maximum speeds. Also, the data set contains estimates from small avalanches, wet avalanches, and ones with less than optimum surface-friction conditions. Therefore, t$e upper limit envelope (shown in Figure 3) um = 1.5(So)r is chosen to calibrate the model (the design case). F r o q the data, the ratio U,/(S~)~ has a range of 0.17-1.38 mT s-' (mean 0.70; standard deviation 0.28).
Rank correlation coefficients, Rs, were calculat d for
f
the Roger's Pass data. Correlation of um with (So) gave 0.437 for the dry avalanches in the data set and this value
changes very little if all 72 avalanches are used
(R, = 0.469).
The value of Rs for correlation of u,/(s,)~ with
respect to a is -0.34 for the sub-set of 50 dry avalanches and it is insignificant for the full data set (-0.13). Since tan a is the average slope all along the path, it is an index of path steepness. Correlation of um/(S0)+ with tan a gave a value 0.09 for the full data set and -0.08 for the sub-set of 50 dry avalanches. This important result suggests that maximum avalanche speeds are nearly independent of profile steepness once a suitable length scale (solf is chosen for
scaling. The result seems paradoxical but it may be
consistent with granular-flow results: steeper paths have higher driving force during acceleration but the rate of shearing at the base of the avalanche may be faster to produce higher dynamic friction which compensates so that maximum speed does not increase.
In order to determine the value of n (Equation (16)) in a fairly general manner, I have used a geometrical model of avalanche paths from western Norway derived by McClung and Lied (1987). The model consists of definition of the constants (a, b, c) in the equation y = ax2
+
bx+
c as a function of path steepness (geometry; Fig. 3). Run-out along the curve is defined by a mapping of values of the non- excedence probability p (0.5<
p<
0.99). Using Weibull plotting positions, a regression analysis gave u = 0.14, b =0.08 using the data set from western Norway as a n example (see Equation (3)).
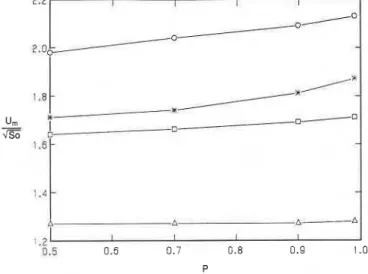
By constraining maximum speed to match closely the
maximum value of u,/(s,)~ (from speed data) independent
of path steepness (B), a set of values for n was derived as a function of path steepness (Table I). Figure 4 shows pre- dictions of the parameter U ~ / ( S ~ ) + as a function of path steepness and run-out position. This result shows that path steepness gives the major influence, so that in my model B is the only parameter used to determine n. Therefore, the values in Table I are recommended as guidelines for use in applications.
From Figure 4, the values of u,/(.S,)~ exceed the
value 1.5 for the steepest profile (B = 50 )o and they are less than 1.5 for the gentlest profile (B = 20 ). This is due to steepness in the initial parts given by the geometrical model. The initial slope angle increases with B in the geometrical model (29 for B = 20'; 6 6 " for B = 50'). These values of initial slope angle are near the extremes measured for avalanche starting-zone angles (e.g. Perla, 1976). In this sense, the limits of 1.12
<
U,/(S,)~ 6 2.13 inFigure 4 can be regarded as extreme limits: n = 0 implies 1.98 6 um/(S )I
<
2.13 (B = 50 O ) and n = 1 gives1.12
<
u,/(s:)* C 1.28 ( 8 = 20') for p in the range 0.50-0.99.Calculations with actual avalanche profiles near the
extremes of steepness gave a closer match to the
upper
limit o t the field data: Ruby Peak, Colorado ( a =016.7
,
B
;
23 , So = 2300 m) and PS-67, Norway(7
= 49 , B =51 , S = 1600 m) gave respectively U ~ / ( S ~ ) ~ = 1.45 and 1.88 in comparison with the extreme limits estimated from
'TABLE I. SUGGESTED VALUES O F fl0 AND n AS A
FUNCTION O F PATH STEEPNESS (R)
Fig. 4 . Predictions of U,/(S~)* versus probability (p) and
1
path steepness (B) for a geometrical terrain model
(McClung and Lied, 1987) develoged from run-ou! data
-
in western Norway. o, (B = 50 );
*.
(B = 40 ); 0,(B = 3 0 " ) : A (B = 20').
the geometrical model (Fig. 4 The recommendations of
Table I put the value um/(S0$ = 1.5 mt s-I in the middle (most of common values of path steepness).
The values in Table I are derived by neglecting the turbulent air/dust drag and centripetal force. I expect that
this approximation will suffice in most engineering
applications. T o include these terms, I suggest estimating Do
and then reducing L( in Equation (9) while retaining the
value of n appropriate to path steepness (B) from Table I. Using an iterative procedure, the stop position (known) can be matched to give the solution for speeds all along the incline. Including air drag and centripetal drag will reduce the estimates of maximum speed produced by application of the values in Table I, but these terms may not be important in most run-out zone applications.
The high friction limit for the model produces over- estimates of maximum speed for the asteepest profiles. Such profiles are rare in practice (B = 50 ). The path-steepness range for the Rogers Pass speed data is fairly broad, but most data are concentrated around the mean. It is entirely possible that there are not enough speed data to illustrate
adequately path-steepness extremes because the data
represent avalanches at differing mass and mechanical properties moving over paths with varying topography and surface friction. As well, steep paths represent the class which is most likely to be subjected to centripetal drag effects. If centripetal forces are included in the model calibration, a better match to the maximum speed envelope will be obtained.
COMPARISON WITH FIELD MEASUREMENTS O F
AVALANCHE SPEEDS
Recently, data have been published for speeds of large avalanches all along the incline (Norem and Kristensen,
1985, 1986; Norem and others, 1985; Salm and Gubler,
'
1985; Gubler and others, 1986). Comparison with these data requires care: the data represent frontal speeds but the assumptions in the model ignore the distinction between frontal and centre of mass speed. In addition, the run-out position for the model is taken as the extreme position (tip) of the debris. The model assumptions (ignoring differences between centre of mass and frontal speed) may not be accurate enough in some applications. In addition, the model predictions are intended for the rare design avalanche (=I00 year); therefore, particular examples will not entirely match optimum friction conditions and model predictions will exceed measured speeds in most cases.
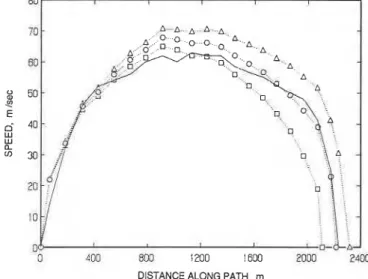
A complete speed profile for a large dry azalanche w p reported by Salm and Gubler (1985) (B = 22 , a = 18 ). Sensitivity with respect to values of air drag is shown in
800 ! El0 :600 2000 2iOO
DISTANCE ALONG PATH, rn DISTANCE ALONG PATH, rn
:
Fig. 5 . Model predictions versus measured speeds (Aulta Fig. 7 . Predicted speed profiles as a function - of stopavalanche path, Switzerland). ( - measured: (O), position (variations in ) for po = 0.2, n =
i,
p 0 = 0 . 2 , n = f , D o - ' = 3 3 3 3 m ; (*). p 0 = 0 . 2 , n = + , Do-' = 3333 m for the same measured speed profile in
Do-' = 0 . Figure 6 . (-), measured: ( A ) , ji = 0.27; (o), ji = 0.32;
( n ) , ji = 0.37.
Figure 5. This figure shows that po = 0.2, n = 1/2 provides a good match to the data in the acceleration and deceleration phases. Addition of the air-drag component reduces the speeds in the region of maximum speed to provide a closer match to the data for po = 0.2, n = 1/2.
Data for an avalanche with a shorter, steeper path, the Magergrond from Switzerland (or = 31 O), were measured by
Gubler and others (1986). They provide profiles for three avalanches with maximum speeds 19.7, 28.1, and 42.7 m/s. In Figure 6, model predictions are compared with the fastest of these for p = ji, po = 0.2, n = 1/4, and
po = 0.2, n = 1/2. Figure 6 clearly shows that p =
ji
produces speed values which underestimate the measured ones for a path of this steepness. The pair po = 0.2,
n = 1/4 provides an excellent match to the data except in the early deceleration phase, when both the pairs po = 0.2,
n = 1/4 and po = 0.2, n = 1/2, Do" = 3333 m give speed
predictions exceeding the measured ones. Again, addition of an air-drag term provides a closer match to measurements in the high-speed regions.
Variations of stop position
(2
with po = 0.2, n = 1/2,Do-' = 3333 m are shown in Figure 7 for the avalanche in Figure 5. This figure shows the importance of specifying the stop position in order to estimate closely speed profiles.
Since the speed data show very rapid deceleration, it would not be possible to match speed data closely using the model without specifying a stop position. Since avalanche speeds are very sensitive to stop position, the model must also display such behaviour.
Data from Ryggfonn path, Norway ( 8 = 28'1, provide an indication that avalanche speeds are very sensitive to mechanical properties of flowing snow and the conditions of the sliding surface. Data for two large avalanches (April 1982, April 1983) are given in Figure 8 (from Norem and Kristensen, 1985; Norem and others, 1985). The 1982 avalanche was dry but the lower part of the path had a wet surface. The 1983 avalanche had partly wet snow in the flowing material and the surface was wet in the run-out zone. These conditions deviate from the model assumptions.
Also shown (Fig. 8) are the model predictions for
lo 0.2, n = 1/2, n = 3/4, D ~ - ' = 3333 m, for Ryggfonn. Maximum speed is within about 15% of that measured. Again, the model speeds are too high in the deceleration phase but the wet sliding surface there could explain part of the difference. The 1982 avalanche fits the model assumptions more closely but, even for it, the comparison is not ideal. Except for the early high peak in speed (path length 800 m), the model does agree with data from both
DISTANCE ALONG PATH, m DISTANCE ALONG PATH, rn
Fig. 8 . Predicted speed pro/iles versus measured speeds for Fig. 6 . Predicted speed profiles versus measured speeds two avalanches of differing mechanical properties (Madergrond avalanche path, Switzerland). (-), measured; (Ryggfonn avalanche path, Norway). (El), 1982 avalanche; (01, p = b(, Do-' = 0; (*). po = 0.2, n = %, Do-' = 0 ; (-). 1983 avalanche; (+), po = 0.2, n = f , Do-' = 3333 m ;
speed profiles that generally the speeds accelerate for about 1500 m along the incline. It is interesting that Perla and others (1984) attributed the early peak in the speed data to a possible spurious effect for the 1982 avalanche. It is not known whether this is true.
Figures 5-8 illustrate a number of complicated effects in the speed profiles that were measured under conditions of the design high-speed avalanche described by the speed model. The model does, however, reproduce the major features of the data. In addition, the model has a much stronger physical basis (granular-flow concepts) than the
earlier models of the Voellmy-PCM class which were
constructed in an ad hoc fashion instead of being developed from a continuum approach.
SUMMARY AND DISCUSSION
The model proposed consists of two parts: (1)
definition of extreme avalanche run-out distance using statistical methods, field observations or a combination of these, and (2) calculation of approximate expected speeds along the incline for one type of avalanche: the one characterized by minimum friction and maximum speed. Since the model requires avalanche run-out as input and since it is calibrated from field measurements of maximum avalanche speed, it is (by definition) consistent with these field measurements.
The speed model appears mathematically similar to simple models of the past (Voellmy, 1955; Perla and others, 1980) but its application is entirely different: the run-out distance is used to define the mean value of granular (speed-dependent) friction and avalanche-speed data are used to determine the value of n in Equation (16). Application
of the model consists of a suitable choice of po and n for
the given path-steepness parameter ( B ) from Table I. For a
given run-out distance, So and
1
are then determined tocomplete Equation (16) which is applied in numerical solutions on the path broken into path-length segments and slope angles.
Equation (17) may be regarded as the high friction limit for the present model (excluding air drag and centripetal effects). McClung and Schaerer (1983) showed that this is the low friction limit for models of the PCM- Voellmy class. We also provided some speed data which exceed the model speed limit (low friction limit) for the PCM class of models. A further example is provided in this paper (Fig. 7). These examples emphasize an undesirable characteristic of the PCM-Voellmy models. If constant mean values are used for the two friction coefficients in the models, then measured speeds can exceed the model speed limit. If both parameters are allowed to vary along the path
(instead of taking constant mean values), then it is
impossible to determine the parameters from currently available speed data and the predictions are arbitrary.
In the present model, no attempt is made to predict the flow depth. This is a quantity which engineers are anxious to know. In order to predict flow depth, the internal deformation of the avalanche flow must be defined. Until the mechanical properties and boundary conditions for flowing snow are determined, I do not believe flow-depth predictions are possible with any certainty. However, it should be possible to estimate roughly flow depths as a
function of path-confinement geometry if an initial
geometry (slab thickness and dimension) is specified for the flowing mass unless the avalanche entrains significant amounts of snow during descent (see e.g. Salm, 1979).
The simplicity and approximate nature of the model must be kept in mind. The true complexity of the
avalanche-dynamics problem prevents solutions with the
precision sought in many consulting applications for this and other models. Since the speed predictions are developed from scaling rather than a physical model, they must be integrated with as much information as possible collected in the field when applications are attempted.
ACKNOWLEDGEMENTS
This paper would not have been possible without speed data from the collections of P. Schaerer, NRCC; H. Gubler,
Swiss Federal Institute for Snow and Avalanche Research; and H. Norem, Norwegian Geotechnical Institute. I am grateful for their contributions.
REFERENCES
Ackermann, N. and H.T. Shen. 1978. Flow of granular
material as a two-component system in continuum
mechanical and statistical approaches in the mechanics of
granular materials. In Continuum and statistical
approaches in the mechanics of granular materials.
Sendai, Japan, US.-Japan Seminar, Preprint, 9-16.
Bakkehei, S., U. Domaas, and K. Lied. 1983. Calculation of
snow avalanche runout distance. Ann. Glaciol., 4, 24-29. Batchelor, G.K. 1967. An introduction to fluid dynamics.
Cambridge, Cambridge University Press.
Bovis, M.J. and A.I. Mears. 1976. Statistical prediction of snow avalanche runout from terrain variables in Colorado.
Arct. Alp. Res., 8(1), 115-120.
Campbell, C.S. and C.E. Brennen. 1983. Computer simulation
of shear flows of granular material. In Jenkins, J.T. and
;
M. Satake, eds. Mechanics of graitular materials: new
models and coizstitutive equations. Amsterdam, Elsevier,
313-326.
Campbell, C.S. and C.E. Brennen. 1985a. Chute flows of
granular material: some computer simulations. Trans.
A.S.M.E., J. Appl. Mech., 52, 172-178.
Campbell, C.S. and C.E. Brennen. 1985b. Computer
simulation of granular shear flows. J. Fluid Mech., 151, 167-188.
Campbell, C.S. and A. Gong. 1986. The stress tensor in a two-dimensional granular shear flow. J. Fluid Mech., 164, 107-125.
Cheng, T.T. and R.I. Perla. 1979. Numerical computation o f
avalartche motion. Ottawa, Inland Waters Directorate.
National Hydrology Institute. (NHRI Paper 5.)
Dent, J.D. 1986. Flow properties of granular materials with large overburden loads. Acta Mech., 64, 11 1-122.
Gubler, H., M. Hiller, G. Klausegger, and U. Suter. 1986.
Messungen urtd Fliesslawine~~. Weissfluhjoch/Davos,
Eidgenossisches Institut fiir Schnee- und Lawinen-
forschung. (Mitteilungen 41 .)
Hanes, D.M. and D.L. Inman. 1985a. Experimental
evalulation of a dynamic yield criterion for granular fluid flows. J. Geophys. Res., 90(B5), 3670-3674.
Hanes, D.M. and D.L. Inman. 1985b. Observations of flowing granular-fluid materials. J. Fluid Mech., 150, 357-380.
Lied, K. and S. Bakkehai. 1980. Empirical calculations of snow-avalanche run-out distance based on topographic parameters. J. Glaciol., 26(94), 165- 177.
McClung, D.M. 1987. Mechanics of snow slab failure from
a geotechnical perspective. International Association o f
Hydrological Sciences Publication 162 (Symposium at
Davos 1986
-
Avalanche Formation. Movement andE f f e c t s ) , 475-508.
McClung, D.M. and K. Lied. 1987. Statistical and
geometrical definition of snow avalanche runout. Cold
Reg. Sci. Technol., 13(2), 107- 119.
McClung, D.M. and A.I. Mears. In press. Extreme value prediction of snow avalanche runout.
McClung, D.M. and P.A. Schaerer. 1983. Determination of
avalanche dynamics friction coefficients from measured
-
speeds. Ann. Glaciol., 4, 170- 173.
McClung, D.M. and P.A. Schaerer. 1985. Characteristics of :
flowing snow and avalanche impact pressures. Ann.
Glaciol., 6, 9- 14.
.
McClung, D.M., A.I. Mears, and P.A. Schaerer. 1989.
Extreme avalanche run-out: data from four mountain ranges. Aizn. Glaciol., 13, 180-184.
McTigue, D.F. 1978. A model for stresses in shear flow of
granular materials. In Continuum and statistical
approaches in the mechanics o f granular materials.
Sendai, Japan, US.-Japan Seminar, Preprint, 123-128. Mellor, M. 1986. Avalanches. CRREL Monogr. 111, A3d. Norem, H. and K. Kristensen. 1985. The Ryggfonn Project
avalanche data from the winter 1982/1983. Oslo,
Norwegian Geotechnical Institute. (Report 58120-6.) Norem, H. and K. Kristensen. 1986. The Ryggfonn Project
Norwegian Geotechnical Institute. (Report 58120-7.) Norem, H., T. K v i s t e r ~ y , and B.D. Evensen. 1985. Meas-
urement of avalanche speeds and forces: instrumentation and preliminary results of the Ryggfonn Project. Ann.
Glaciol., 6, 19-22.
Norem, H., F. Irgens, and B. Schieldrop. 1987. A continuum
model for calculating snow avalanche velocities.
International Associatiorz of Hydrological Sciences
Publication 162 (Symposium at Davos 1986
-
AvalancheFormation, Movement and Effects), 363-378.
Perla, R. 1976. Slab avalanche measurements. In Proceedings
o f 29th Canadian Geotechnical Con Jerence. Vancouver, B.C.,
Pt VII, 1-15.
Perla, R., T.T. Cheng, and D.M. McClung. 1980. A two-
parameter model of snow-avalanche motion. J. Glaciol.,
26(94), 197-207.
Perla, R., K. Lied, and K . Kristensen. 1984. Particle simulation of snow avalanche motion. Cold Reg. Sci.
Technol., 9(3), 191 -202.
.
Salm, B. Unpublished. Fliessiibergange und Auslaufstreckenvon Lawinen. Weissfluhjoch/Davos, Eidgenbssisches Institut
fiir Schnee- und Lawinenforschung. (Interner Bericht
566.)
* Salm, B. and H. Gubler. 1985. Measurement and analysis of
the motion of dense flow avalanches. Ann. Glaciol., 6,
26-34.
Savage, S.B. and K. Hutter. 1989. The motion of a finite mass of granular material down a rough incline. J. Fluid
Mech., 199, 177-215.
Savage, S.B. and D.J. Jeffrey. 1981. The stress tensor in a
granular flow at high shear rates. J. Fluid Mech., 110,
255-272.
Schaerer, P.A. 1975. Friction coefficients and speed of
flowing avalanches. Iiiternational Association o f
Hydrological Sciences Publication 114 (Symposium at
Grindelwald 1974
-
Srzow Mechanics), 425-432.Schlichting, H. 1979. Boundary-layer theory. New York, McGraw-Hill Book Company.
Voellmy, A. 1955. o b e r die Zerstbrungskraft von Lawinen.
Schweiz. Bauzfg., 73(12), 159- 162; 73(15), 212-217;
246-249; 73(19), 280-285.
Walton, O.R. 1983. Particle-dynamics calculations of shear
flow. In Jenkins, J.T. and M. Sateke, eds. Mechanics of
granular materials: new models and constitutive relations.
Amsterdam, Elsevier, 3 13-326. APPENDIX A
RESULTS FROM THEORETICAL AND EXPERIMENTAL WORK ON GRANULAR FLOW
The following basic properties of dense granular flows are expected to have relevance to avalanche-dynamics models and they form part of the basis for the simple theory developed in this paper. In what follows, the symbol v is used to denote the volume fraction filled by solid material in the flow.
(1) Shear and normal forces are strongly coupled throughout the flow (including the basal region); the local ratio of shear to normal forces, p, may be used to characterize either the basal or internal friction (Hanes and Inman, 1985a, b).
(2) Conditions at the base of the flow depend crucially on
the boundary conditions. If slip occurs at the boundary,
such as for a hard, smooth surface, a region of low
v
andhigh granular temperature can develop there. For a
completely rough surface, this effect disappears (Campbell and Brennen, 1985b).
(3) For simple shear, dynamic friction (p) increases as
v
decreases (in contrast to static friction); v decreases as the rate of shearing increases (Campbell and Brennen, 1983; Hanes and Inman, 1985b).
(4) When
v
approaches a high limiting value, rubbingfriction enters and the friction increases rapidly toward a high static value.
(5) For chute flows, locking commences when the slope angle decreases to some low value; locking occurs first in the upper part of the flow, leaving a rapidly deforming region at the base (Campbell and Brennen, 1985a).
(6) As the coefficient of restitution of the particles
decreases, the velocity profile of the flow becomes blunt and the flow is plug-like. Values of solid fraction at the sliding boundary increase as the coefficient of restitution there decreases; there is less dilation of the flow at low coefficients of restitution (Campbell and Brennan, 1985a). (7) As the overburden increases, the rate of basal shearing decreases and v increases there; this implies dynamic friction decreases with increasing overburden (Dent, 1986). If the overburden is kept constant but flow height is varied, no change in conditions at the basal boundary is predicted for simple shear flows (Campbell and Brennen, 1983).
(8) For chute flows with slip at the boundary, higher slope
angles imply
v
is lower near the boundary than in theinterior of the flow. This should produce a high effective dynamic friction coefficient at the boundary to counter- balance the increased driving shear stress at high slope angles (Campbell and Brennen, 1985a).
(9) When a rapidly sheared granular mass contains particles of different sizes, the smaller particles tend to percolate to the bottom and the larger particles are forced upward. Computer simulations indicate that this effect occurs during the initial stages of the flow when the mass has traversed a short distance down-slope (Walton, 1983). Since the shearing deformation will be most vigorous at the base of the flow, if slip occurs the destructive collisions which are expected for flowing snow can enhance the effect to make it even more likely to find small particles at the base of the flow. (10) Laboratory shearing experiments on granular materials show that slip at the boundary is almost inevitable. A completely rough (no-slip) condition is difficult to achieve.
APPENDIX B
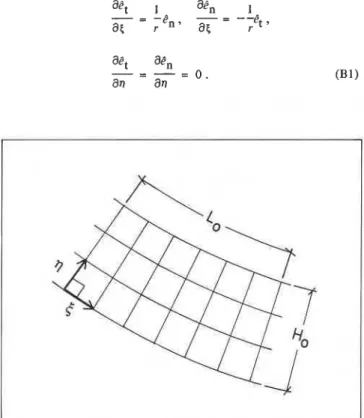
CONTINUUM DERIVATION
Consider the motion of an avalanche modelled as a continuous body along a curved incline with local radius of curvature r (positive for concave shape) (Fig. 9). Similar to the Cartesian continuum description of Savage and Hutter (1989), a simple curvilinear coordinate system for in-plane
motion is defined (coordinates
5
tangential and t,perpendicular to the incline). With this system, if 6 and Cn
are unit vectors in the
t
and t, directions, the followingdefinitions hold for motions in the t , n plane:
act
atn
- = 0