Automatic Syllable Detection for Vowel Landmarks
by
Andrew Wilson Howitt
B.A. Mathematics, Stonehill College (1982)
B.S.E.E., University of Notre Dame du Lac (1983)
M.S. EECS, Massachusetts Institute of Technology (1987)
Submitted to the Department of
Electrical Engineering and Computer Science
in partial fulfillment of the requirements for the degree of
Doctor of Science
MASSACHUSETTS INSTITUTE
at the
OF TECHNOLOGYMassachusetts Institute of Technology
OCT 2 3
2000
July
2000
LIBRARIES©Massachusetts Institute of Technology 2000. All rights reserved.
Author ...
Department of Electrical Engineering and Computer Science
25 July 2000
Certified by ...
...
Kenneth N. Stevens
Clare
J
g Professor of Electrical Engineering
'h~es
Supervisor
Automatic Syllable Detection for Vowel Landmarks
by
Andrew Wilson Howitt
Submitted to the Department of Electrical Engineering and Computer Science on 25 July 2000 in partial fulfillment of the requirements for the degree of
Doctor of Science
Abstract
Lexical Access From Features (LAFF) is a proposed knowledge-based speech recognition system which uses landmarks to guide the search for distinctive features. The first stage in LAFF must find Vowel landmarks. This task is similar to automatic detection of syllable nuclei (ASD).
This thesis adapts and extends ASD algorithms for Vowel landmark detection. In addition to existing work on ASD, the acoustic theory of speech production was used to predict characteristics of vowels, and studies were done on a speech database to test the predictions. The resulting data guided the development of an improved Nowel landmark detector (VLD). Studies of the TIMIT database showed that about 94% of vowels have a peak of energy in the F1 region, and that about 89% of vowels have a peak in F1 frequency. Energy and frequency peaks were fairly highly correlated, with both peaks tending to appear before the midpoint of the vowel duration (as labeled), and frequency peaks tending to appear before energy peaks. Landmark based vowel classification was not found to be sensitive to the precise location of the landmark. Energy in a fixed frequency band (300 to 900 Hz) was found to be as good for finding landmarks as the energy at F1, enabling a simple design for a VLD without the complexity of formant tracking.
The VLD was based on a peak picking technique, using a recursive convex hull algorithm. Three acoustic cues (peak-to-dip depth, duration, and level) were combined using a multi-layer perceptron with two hidden units. The perceptron was trained by matching landmarks to syllabic nuclei derived from the TIMIT aligned phonetic transcription. Pairs of abutting vowels were allowed to match either one or two landmarks without penalty. The perceptron was trained first by back propagation using mean squared error, and then by gradient descent using error rate. The final VLD's error rate was about 12%, with about 3.5% insertions and
8.5% deletions, which compares favorably to the 6% of vowels without peaks. Most errors
occurred in predictable circumstances, such as high vowels adjacent to semivowels, or very reduced schwas. Further work should include improvements to the output confidence score, and error correction as part of vowel quality detection.
Acknowledgements
My first and foremost acknowledgements go to Professor Ken Stevens, who has taught me
more than anyone else about speech science, and devoted his time and effort to advising this thesis. He has been an inspiration and role model for me, an example of insight, patience and understanding to me and to generations of students, and he has fostered the laboratory and community of scientists where I have learned and grown. He also provided the funding which made this work possible. Thank you, Ken - for all these reasons, I couldn't have done it without you.
Thanks to my thesis readers, Dr. Jim Glass and Professor Carol Espy-Wilson, who have been invaluable sources of insight and critical advice, and shaped both my work and my outlook. Special thanks and rememberances to my third reader, Professor Jon Allen, who offered me valuable instruction and counsel before his passing in April 2000. Jon will be missed by all of us in the Research Laboratory of Electronics.
Many of the staff and students of the Speech Communication Group have helped me with information and suggestions large and small. Stephanie Shattuck-Hufnagel, Sharon Manuel, Elizabeth Choi, Marilyn Chen, and all the members of the Lexical Access team have provided feedback and discussion. Arlene Wint and Seth Hall have kept the wheels turning. Majid Zandipour, Melanie Matthies, Lorin Wilde, and lots of others have offered encouragement and advice.
Many of my friends have given me vital assistance (and, when necessary, distraction!). My lover Lee Steele has been a wonderful source of support and encouragement. My friends David, Lyman, Marek, and many other of my friends and family have all helped me stay healthy and sane through this work.
Last and most important, I offer my deepest thanks and blessings to Mother Earth and Father Sky for the world They carry between them, and the strength and wisdom that underlies all we do. I also thank and bless my spirit guides, Dolphin and Horse, and all the powers great and small that weave through the world that is home to all of us.
Contents
1
Introduction: LAFF and Vowel Landmarks 1.1 Motivation ...1.1.1 Thesis scope ... 1.2 The LAFF paradigm ...
1.2.1 Landmarks and Segments ... 1.2.2 Distinctive Features ...
1.2.3 Matching landmarks to the lexicon ...
1.3 Issues facing Robust Speech Recognition . . . .
1.3.1 Sources of speech variability . . . .
1.3.2 Lexical vs. acoustic representations . . . .
1.3.3 Statistical vs. knowledge based recognition . . . 1.3.4 Modular vs. integral architecture . . . . 1.4 Theoretical and practical implementation issues . . . .
1.4.1 Definition of a Vowel landmark . . . . 1.4.2 Design goals . . . . 1.4.3 Optimization criteria . . . .
2 Background of Automatic Syllable Detection (ASD) 2.1 How Vowel landmarks relate to ASD . . . . 2.2 Early work, mostly knowledge based . . . . 2.3 The ARPA SUR project and its aftermath . . . .
16 16 . . . . 17 . . . . is . . . . 19 20 . . . . 21 . . . . 21 . . . . 21 . . . . 23 . . . .26 . . . . 28 . . . . 29 . . . . 29 . . . . 30 . . . . 31 35 35 37 38
2.3.1 Results of the ARPA SUR project . . . .
2.3.2 Impact of the ARPA SUR project . . . . 2.4 Recent work, mostly statistically based . . . .
2.5 Sum m ary . . . .
2.5.1 Detectable characteristics of vowels . . . .
3 Statistical Study of Database Vowels
3.1 Predictions of F1 behavior in vowels . . . .
3.1.1 (1) Presence of F1 peaks in the vowel . . . . 3.1.2 (2) F1 amplitude and frequency peak together . . . .
3.1.3 (3) F1 peak is better than midpoint for vowel quality .
3.1.4 (4) F1 peak can be approximated without formant tracking .
3.2 Corpus... ...
3.3 M ethodology . . . .
3.4 Signal processing . . . . 3.4.1 Form ant tracking . . . . 3.4.2 Amplitude computation . . . . 3.4.3 Peak detection . . . . 3.4.4 B asic data . . . .
3.5 Experiment 1: Presence of F1 Peak in Vowels . . . .
3.5.1 M ethodology . . . .
3.5.2 Experiment 1A : Amplitude peaks against context . . . .
3.5.3 Experiment 1B: Frequency peaks against context . . . . 3.5.4 Conclusions to Experiment 1 . . . .
3.6 Experiment 2: Coincidence of Amplitude and Frequency Peaks in V
3.6.1 M ethodology . . . .
3.7 Experiment 3: Vowel quality better at F1 peak than midpoint . . . 3.7.1 M ethodology . . . . 3.7.2 K Nearest Neighbors (KNN) Classification . . . .
45 46 48 50 50 53 53 55 55 55 56 56 56 57 57 59 60 . . . . . 61 . . . . . 68 . . . . 69 . .. 70 . . . . 91 els . . 91 . . . . 92 . . . . 104 . . . . 105 . . . . 107 ow
3.8 Experiment 4: Fixed energy band is comparable to formant tracking .
3.8.1 M ethodology . . . . 3.8.2 Conclusions . . . .
3.9 Conclusions of the statistical study . . . .
3.9.1 (1) Presence of F1 peaks in the vowel . . . . 3.9.2 (2) F1 amplitude and frequency peak together . . . .
3.9.3 (3) F1 peak compared to midpoint for vowel quality . . . .
3.9.4 (4) F1 peak can be approximated without formant tracking.
4 Vowel Landmark Detector (VLD) Implementation
4.1 The Baseline VLD... 4.1.1 Front end processing 4.1.2 Feature extraction A 1 . .D t . . . . 4.1.4 Post processing . . . . 4.2 Experimental Issues . . . . 4.2.1 Failure modes . . . . 4.2.2 Scoring technique . . . . 4.2.3 Corpus . . . . 4.3 Baseline Experiment . . . . 4.4 Combination of Acoustic Measurements ...
4.4.1 Using intuitive nonlinear combinations . 4.4.2 Using Neural Networks . . . . 4.5 Incorporating Neural Network into Vowel Landmark 4.5.1 Issues . . . .
4.5.2 Implementation and validation . . . .
4.5.3 Training algorithm . . . . 4.5.4 Training results . . . . Detector 4.6 Error characterization . . . . 15 5 113 114 123 123 123 124 125 125 126 127 128 128 129 131 131 131 132 134 135 138 139 139 147 147 150 150 151 . . . . . . . . . . . .
4.6.1
4.6.2 4.6.3
Canonical error categories . . . . Modified error categories . . . . Additional modification: Skewed detections in consonants . 4.6.4 Conclusions . . . .
4.7 Examples from the TIMIT database . . . . 4.8 Conclusions . . . .
5 Implications and Future Work
5.1 Enhancements to Vowel Landmark detection
5.1.1 Further improvements for VLD . . . . 5.1.2 Error characterization . . . .
5.1.3 Adaptability to other databases . . . .
5.1.4 Vowel classification schemes . . . .
5.2 Confidence scores . . . .
5.2.1 Generation of confidence scores . .
5.2.2 Validation of confidence scores . . . . .
5.2.3 Example: Hybrid confidence score .
5.3 System integration issues . . . .
5.3.1 Optimization criteria . . . .
5.3.2 Lexical contact and error recovery . . . 5.4 System design issues . . . . 5.4.1 Acoustic cues and Information content 5.4.2 Representation of Distinctive Features 5.4.3 Calibration of Feature Values... 5.4.4 Landmark and Feature Hierarchy .
5.4.5 Lexical Matching and Phonetic Rules
. . . . 157 .158 . . . . 164 . . . . 169 . . . . 169 . . . . 174 175 175 .... 175 176 177 178 179 .... 179 . . . . 180 181 182 182 183 . . . . 185 . . . . 186 187 . . . . 188 190 191
List of Figures
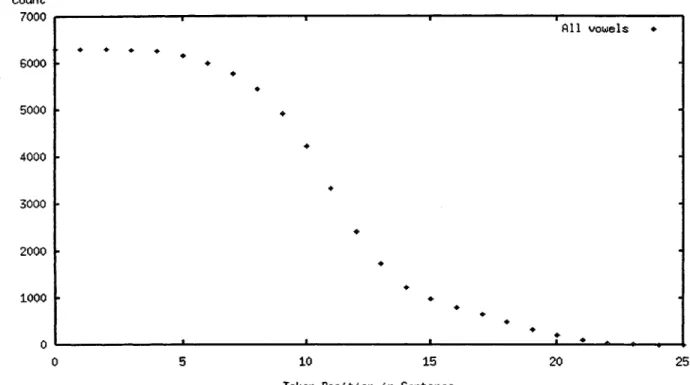
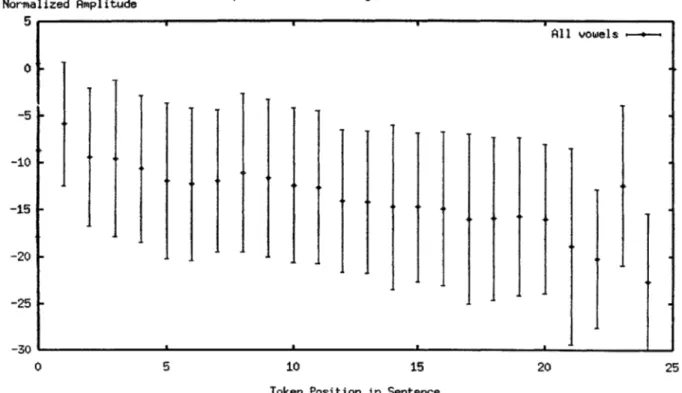
1-1 Receiver Operating Characteristic. The curve shows the performance of a Likelihood Ratio Test as a function of its threshold value. Different threshold values can be chosen by different decision rules (dotted lines). . . . . 32 3-1 Vowel duration histogram . . . . 62 3-2 Token Counts by Sentence Position . . . . 65 3-3 Amplitude Statistics by Sentence Position. A slight downward trend is
noti-cable for all positions except the first (at zero). . . . . 66
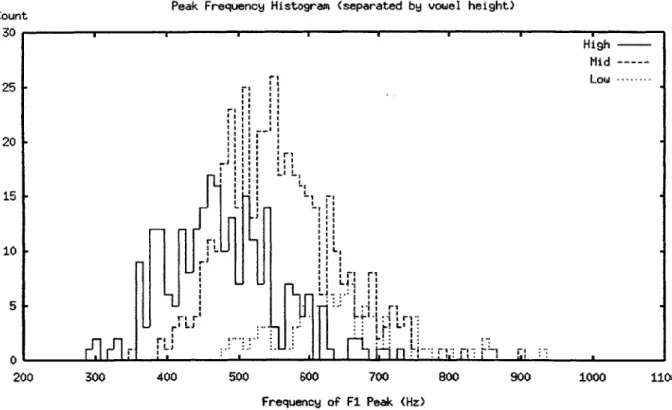
3-4 Vowel Amplitude Histogram by Sentence Position . . . . 67 3-5 Beginning Peak Frequency Histogram. This plot shows the frequency of the
peak of the F1 track, for vowels with the peak at the beginning, separated
by vowel height. Some few tokens are outside the frequency bounds of this
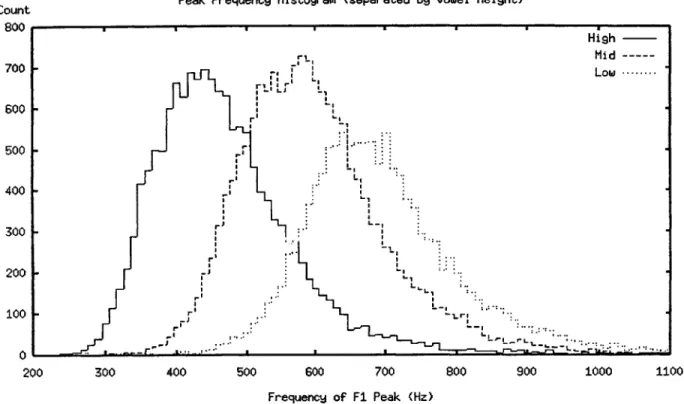
histogram . . . . 82 3-6 Middle Peak Frequency Histogram. This plot shows the frequency of the peak
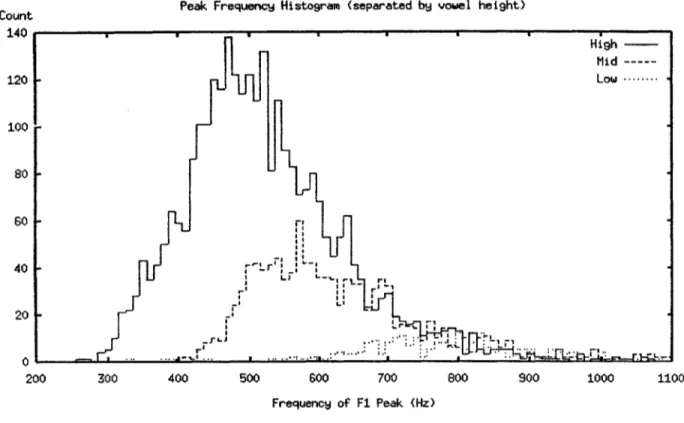
of the F1 track, for vowels with the peak in the middle, separated by vowel height. Some few tokens are outside the frequency bounds of this histogram. 83 3-7 End Peak Frequency Histogram. This plot shows the frequency of the peak of
the F1 track, for vowels with the peak at the end, separated by vowel height. Some few tokens are outside the frequency bounds of this histogram. .... 84
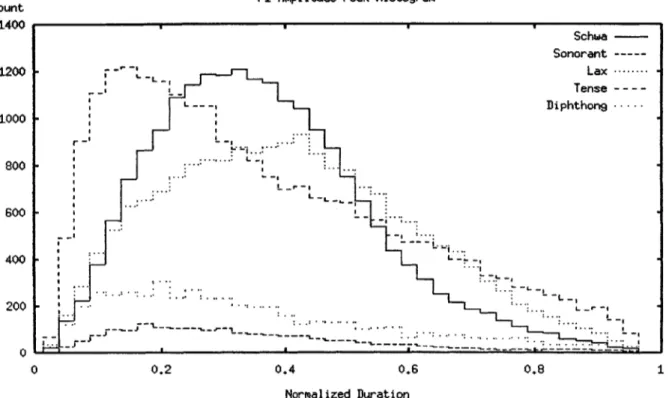
3-8 F1 Amplitude Peak Histogram. The data include all vowels in table 3.18. The horizontal axis is the amplitude peak location, normalized against the
3-9 F1 Frequency Peak Histogram. The data include all vowels in table 3.18. The horizontal axis is the frequency peak location, normalized against the duration of the vowel. The histogram is dithered to avoid crenellation artifacts. ... 95 3-10 F1 Amplitude and Frequency Peak Cross Histogram. The data include all
vowels in table 3.18. The horizontal axes are amplitude and frequency peak locations, respectively, normalized against the duration of the vowel. . . . . . 96 3-11 Schematic of expected histogram of F1 peaks on the difference diagonal. . . . 97 3-12 F1 Peak Difference-Diagonal Histogram. The data include all vowels in
ta-ble 3.18. The horizontal axis is the difference between frequency and am-plitude peak locations, normalized against the duration of the vowel. The vertical axis is the number of tokens per bin. . . . . 98 3-13 F1 Peak Difference-Diagonal Histogram. The data, include all vowels in
ta-ble 3.18. The horizontal axis is the difference between frequency and ampli-tude peak locations, in milliseconds. The vertical axis is the number of tokens per bin . . . . . 99
3-14 Schematic of expected assumption violations among F1 peaks on the difference diagonal. . . . . 100 3-15 Assumption Violation Difference-Diagonal Histogram. The data, include all
vowels in table 3.18. The horizontal axis is the difference between frequency and amplitude peak locations, normalized against the duration of the vowel. The vertical axis is the average number of assumption violations per token, for tokens in that bin. . . . . 101 3-16 F1 Peak Sum-Diagonal Histogram. The data include all vowels in table 3.18.
The horizontal axis is the sum of frequency and amplitude peak locations, normalized against the duration of the vowel. The vertical axis is the number of tokens per bin. . . . . 102
3-17 F1 Peak Sum-Diagonal Histogram, Voiceless and Voiced Context. The data
include all vowels in table 3.18 which are preceded by stop consonants. The horizontal axis is the sum of frequency and amplitude peak locations, nor-malized against the duration of the vowel. The vertical axis is the number of tokens per bin, computed separately for vowel tokens preceded by voiceless
and voiced stop consonants. . . . 103
3-18 Trapezoidal window for weighting . . . 115
3-19 Performance as a function of LowerFrequency . . . 118
3-20 Performance as a function of UpperFrequency . . . 119
3-21 Performance as a function of LowerWidth . . . 120
3-22 Performance as a function of UpperWidth . . . 121
4-1 Convex hull algorithm (after Mermelstein). See the text for a. description of the procedure... ... 129
4-2 Experiment 5 MLP Performance by number of hidden units . . . 142
4-3 Experiment .5 MLP network weights. These weights result from training us-ing back propagation on a sum-of-squares error criterion. See the text for interpretation of the values. . . . 144
4-4 Hyperbolic tangent, which is used as saturating nonlinearity for MLP units. 145 4-5 MLP Training - Distance from Starting Point . . . 153
4-6 MLP network weights, final version. These weights result from training using gradient descent on an error rate criterion. See the text for interpretation of the values. . . . 156
4-7 Histograms of percent vowel deletions as a function of sentence position. The horizontal axis is the vowel count, counting from the beginning of the sen-tence(upper) and from the end of the sentence (lower). . . . 165
4-8 Scatter plot of skewed detections in consonants, plotting the time between the landmark and the segment boundary against the duration of the consonant segment. Most of the segments are fairly short, and most of the landmarks are close to the segment boundary. . . . . 168
4-9 TIMIT Vowel-semivowel example. The sentence is SX9 "Where were you while we were away" uttered by male talker PCSO. Skewed detections occur at 0.64 s ("you") and at 1.04 s ("we"), and two-sided skewing occurs at 1.28 s and 1.42 s (first two vowels in "were away"). . . . 171 4-10 TIMIT Vowel-vowel example (page 1). The sentence is SX172 "The
tri-umphant warrior exhibited naive heroism" uttered by female talker EARO. VV deletions occur at 0.60 s (the second vowel in "triumph-") and 1.40 s (the second vowel in "warrior" and the first vowel of "exhibited"), each appears as a shoulder on the adjacent vowel. . . . . 172
4-11 TIMIT Vowel-vowel example (page 2). The sentence is SX172 "The tri-umphant warrior exhibited naive heroism" uttered by female talker EARO. Correct detection of two vowels in sequence occurs at 2.30 s ("naive") and epenthetic insertion of a vowel occurs at 3.00 s (final nasal in "heroism"). . . 173
5-1 Translation scheme for Distinctive Features, showing how continuous values (derived from acoustics) relate to discrete values (represented in the lexicon). The acoustic Value is plotted on the vertical axis, and the acoustic Confidence is plotted on the horizontal axis . . . . 189
List of Tables
2.1 Knowledge Based Syllable Detectors . . . . 39
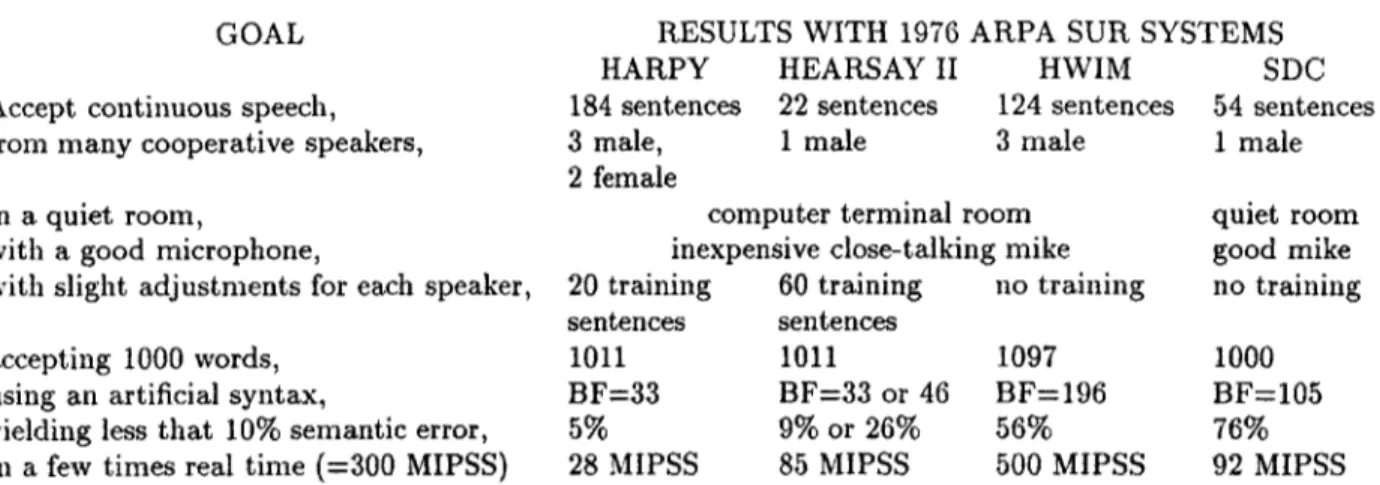
2.2 Goals and Final (1976) System Results for the ARPA SUR Project . . . . . 46
2.3 Statistically Based Syllable Detectors . . . . 49
3.1 Experiment vowel labels and categories . . . . 58
3.2 Experiment vowel categories, counts and mean durations. . . . . 61
3.3 Crystal & House data on vowels, counts and mean durations. This figure reprints the vowel duration data from the publication, Table 1. Syllable du-ration data are not reprinted here. . . . . 64
3.4 Experiment 1 classes for vowel contexts. . . . . 69
3.5 Experiment 1A statistical results. For each category, the preceding context is shown on the vertical axis, and the following context is shown on the horizontal axis. Results which violate theoretical predictions are shown in emphatic typeface. . . . . 71
3.6 Experiment 1A assumption violations, labeled by hand. . . . . 73
3.7 Experiment 1A assumption violations, labeled automatically. ... 74
3.8 Experiment 1A residual assumption violations, labeled by hand. The Talker and Sentence identify the utterance, and the Index identifies the vowel in question, numbered sequentially from the beginning. The vowel length is in milliseconds. The vowel in question is capitalized in the Orthographic fragment. 76
3.9 Experiment 1B statistical results. For each category, the preceding context is shown on the vertical axis, and the following context is shown on the horizontal axis. Results which violate theoretical predictions are shown in emphatic typeface. . . . . 78 3.10 Experiment lB statistical results, female talkers only . . . . 80 3.11 Experiment 1B statistical results, male talkers only . . . . 81 3.12 Vowel height classes. Schwas, diphthongs, and syllabic sonorants are not
in-cluded, because their acoustic manifestation of height is liable to be uncertain or am biguous. . . . . 81 3.13 Experiment lB statistical results, by vowel height . . . . 82 3.14 Experiment lB statistical results for truncated vowels. For each category, the
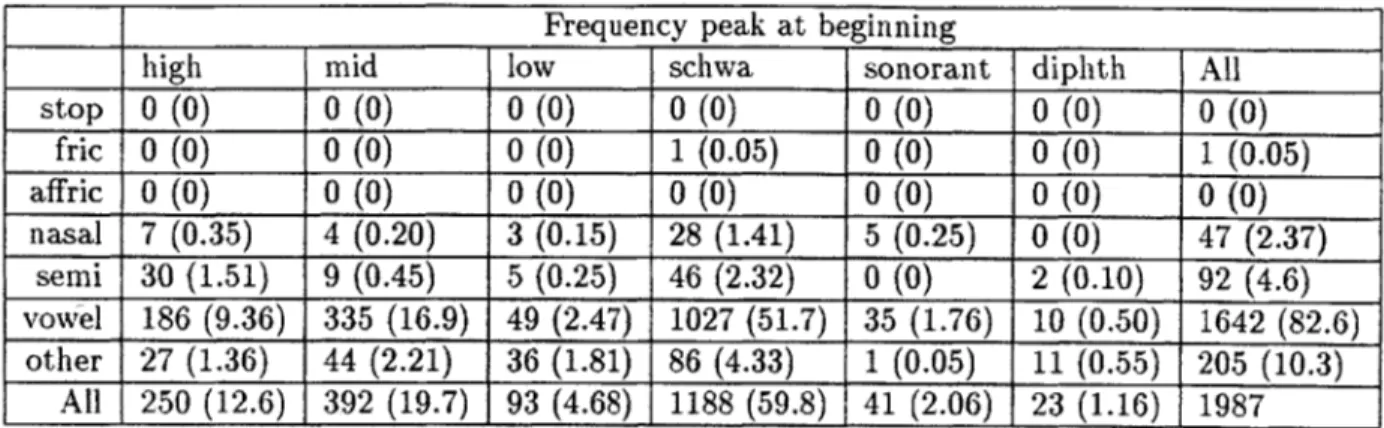
preceding context is shown on the vertical axis, and the following context is shown on the horizontal axis. Results which violate theoretical predictions are shown in emphatic typeface. . . . . 87 3.15 Experiment lB context statistics, for frequency peaks at beginning of segment.
Columns show the class of the vowel token, and rows show the manner of the preceding segment. Each entry shows the token count followed by the percent in parentheses. . . . . 88 3.16 Experiment lB context statistics, for frequency peaks at end of segment.
Columns show the class of the vowel token, and rows show the manner of the following segment. Each entry shows the token count followed by the percent in parentheses. . . . . 89 3.17 Experiment lB assumption violations, labeled automatically. . . . . 90 3.18 Experiment 2 vowel categories and counts. For each category, these data are
counts of all vowels with amplitude and frequency peaks both in the middle of the vowel. . . . . 92 3.19 Experiment 3 vowel categories and counts. . . . . 106
3.20 Experiment 3 vowel recognition rates by height, using non-interpolated
for-mant tracks. Diphthongs are not included in these statistics. . . . . 110 3.21 Experiment 3 vowel recognition rates by height, using interpolated formant
tracks. . . .. . . ... . . . . .111
3.22 McNemar Test results. The measurements made at the F1 peak are separated
on the vertical axis, and the measurements made at the midpoint are separated on the horizontal axis. . . . . 112
3.23 Experiment 4 statistical results, for the canonical parameters. For each
cat-egory, the preceding context is shown on the vertical axis, and the following context is shown on the horizontal axis. Results which violate theoretical predictions are shown in emphatic typeface. . . . 117
4.1 Parameters for Vowel Landmark Detector, with typical values. . . . . 127
4.2 Scores by frequency range, with and without fricative detection. The "broad-1)and" condition is Mermelstein's original frequency range (500 Hz - 4 kHz), and the "F"' range is 0 - 650 Hz. . . . . 137
4.3 Scores by vowel stress. In general, less stressed vowels are more difficult to detect. The exception is lax vowels, which are easier to detect in context (because they are always followed by consonants). . . . . 137
4.4 Basic statistics for the Vowel Landmark Detector, using very lenient parame-ters to minimize deletion errors. . . . . 141 4.5 Training results for the VLD using MLP for decisions, for the first eight
an-nealing runs. Token Error Rate (TER) is as defined in section 4.3. Distances are Euclidean distances in coordinate space. . . . . 152
4.6 Training results for the VLD using MLP for decisions, showing the ten points with best TER. performance, out of 64 training runs. . . . . 154 4.7 Training results for the VLD using MLP for decisions, showing the results of
4.8 Test results for the final VLD using canonical error categories. Percentages are relative to vowel count. Error rate is insertions plus deletions. . . . . 157
4.9 Test results for the final VLD using modified error categories. Percentages are relative to vowel count. Error rate is all insertions plus simple deletions. 159
4.10 Category statistics of detected vowels, using the same vowel categories as in table 3.1. . . . . 161
4.11 Manner characteristics of segments with LM insertions. . . . . 161
4.12 Statistics of stops with LM insertions. The percentages are relative to the total number of LM insertions in stops. . . . . 162
4.13 Statistics of fricatives with LM insertions. The percentages are relative to the total number of LM insertions in fricatives. . . . . 163
4.14 Vowel categories of deletion errors, using the same vowel categories as in table 3.1. . . . . 163
4.1.5 Test results for the final VLD using modified error categories, including skewed detection in consonants. Percentages are relative to vowel count. Error rate is all insertions plus simple deletions. . . . . 166
4.16 Manner characteristics of LMs for skewed detections in consonants. . . . . . 167
4.17 Vowel categories of vowels which show skewed detections in consonants, using the same vowel categories as in table 3.1. . . . . 167
Chapter 1
Introduction: LAFF and Vowel
Landmarks
This chapter is an introduction to the LAFF paradigm and the concept of Vowel land-marks. It includes discussion of the problems which a Vowel landmark detector must face, metholodogies for testing and validation of a Vowel landmark detector, and the basic theory that underlies the definition of Vowel landmarks.
1.1
Motivation
A primary motivation for this thesis is to detect Vowel landmarks as part of the front end
of a LAFF speech recognition system. LAFF [84] is a knowledge based approach to speech recognition, in which landmarks (indicating vowels, consonants, or glides) are detected in the speech signal, and phonetic features are detected and attached to the landmarks. Therefore,
landmark detection is a crucial first step in LAFF processing. Landmark detectors for Consonants [54] and Glides [86] have already been developed, leaving only Vowel landmarks yet to be done.
In addition, there are many other uses for automatic syllable detection, which is a task very similar to detection of Vowel landmarks. Among them are visual speech aids for the hearing impaired [37], database labeling aids, tools for perceptual studies, and automatic detection of rate of articulation.
1.1.1
Thesis scope
The goal of this thesis is to create a Vowel landmark detection algorithm that is simple and reliable, and to test and validate its performance on a standard database of continuous speech (the TIMIT database [47]). The algorithm should be able to accept speech by adult talkers of either gender, in all the dialects of American English represented in the database.
One of the long term goals of the LAFF paradigm is a speech recognition system which is insensitive to the production characteristics of the input speech. For this purpose, the system should be tested on multiple databases, including spontaneous as well as read speech, under differing conditions. Other researchers, notably Liu [54], have focused on this aspect of development. In the interests of time and complexity, this thesis will use only one database, leaving input invariance as a task for later consideration.
1.2
The LAFF paradigm
LAFF (Lexical Access From Features) is a proposal for a model of speech recognition by humans, intended to reflect how a human listener takes in the speech signal and derives a sequence of words from it. As such, it is not primarily a proposal for a commercially viable speech recognition system (although there is some argument that since speech is created
by humans for humans, modeling the human process of perception is the most reasonable
approach for an automatic speech recognition system).
Linguistic science has established that words are stored in human memory as sequences of segmental units called phonemes (along with a small amount of additional information, indicating stress level and other prosodic information). It is also known that each phoneme is stored as a collection of Distinctive Features (DFs) which are canonically represented as binary variables.' Furthermore, there is evidence that the DFs are not a disordered aggregate, but are grouped in an hierarchical structure that reflects the physical properties of the speech articulators [43].
In contrast to the segmental nature of phonemes and DFs, the acoustic speech signal is continuous in nature. Attempts to separate the speech signal into phoneme segments, and then to detect DFs within each segment, have met with only very limited success, due to the variety of phenomena which transform the discrete phonemes and DFs into the continuous signal.
'Almost all DFs are allowed to be unspecified in value, as well as taking on plus and minus values, so that strictly speaking they are trinary variables. This is important in implementation, but does not affect the structure being presented here.
1.2.1
Landmarks and Segments
The primary innovation of LAFF is the notion of landmarks. The problem of segmentation of the speech signal is avoided by using landmarks rather than segments to break the signal into an ordered sequence of objects that can carry DF information.
The most fundamental distinction among phonemes is between vowels and consonants. Vow-els are produced with the vocal tract fully open, causing the characteristic pattern of for-mants, while consonants involve closing the vocal tract to some degree. Consonants may be further divided into abrupt and nonabrupt consonants. Abrupt consonants are produced with a constriction that is strong enough to cause acoustic discontinuity (at least in some region of the spectrum), while nonabrupt consonants are produced without such a severe constriction, and hence do not exhibit acoustic discontinuity. Nonabrupt consonants are r, presented with Glide landmarks, while Consonant landmarks implicitly represent abrupt consonants.
So there are three classes of landmarks: Vowel, Glide, and Consonant. Most landmarks (though not all, see below) are located at a specific event in the acoustic signal. A Vowel landmark, for instance, is located at the maximum of low frequency energy in the vowel. An intervowel Glide landmark is located at the minimum of low frequency energy between two vowels. In these cases, each landmark corresponds to a single underlying segment.
Consonant landmarks are located at the closure and release of the (abrupt) consonant. In general, therefore, there are two Consonant landmarks which correspond to the underlying consonantal segment. However, it is possible for only one Consonant landmark to appear in correspondence to the underlying segment, typically in consonant clusters.
pre-vocalic Glide which appears after a Consonant and before a Vowel, for example, corresponds to an underlying glide segment, but is not located at an acoustic event. Similarly, some Vowel landmarks will be located where there is no peak in low frequency energy (typically in vowel-vowel sequences). Such a landmark, which is not located at an acoustic event, is a "floater" which appears somewhere between the events of the landmarks which precede and follow it. The landmarks are always understood to have a fixed order in time.
This means that not all vowels will have a landmark that is generated from an acoustic event. In this thesis, the assumption is that all vowels have landmarks, but not all can be derived from acoustic events alone. Some landmarks may be generated by subtler acoustic information, such as formant movements. This assumption, and the conceptual distinction between "acoustic event" and "landmark" may not be shared by other researchers working on the LAFF project [54], [12].
1.2.2
Distinctive Features
For each class of landmark (Vowel, Glide, and Consonant), there are distinctive features2
(DFs) which should be assigned to them. DFs are determined by measuring acoustic prop-erties in the vicinity of the landmark and combining the acoustic propprop-erties according to rules. The details of the DFs are rules which are described elsewhere [84] and will not be covered here.
2
The term "distinctive" refers to linguistic features which can make a distinction between phonetic seg-ments. The phrase "distinctive feature" is used here to distinguish these features from acoustic features used in recognition.
1.2.3
Matching landmarks to the lexicon
Once the landmarks have been detected and populated with features, they must be matched to the words in the lexicon. Since words are stored in the lexicon as sequences of phonemes, a sequence of phoneme segments (perhaps more than one) must be posulated from the sequence of landmarks. The details of this process are not yet clear. The process will include phonetic rules for transformation of features and similar phenomena. See the literature [84] for more information.
1.3
Issues facing Robust Speech Recognition
There are several issues thbt complicate the task of robust speech recognition. In general, these issues pertain to speech recognition systems as a whole. Since a Vowel landmark detector is an important part of a speech recognition system, a, review of these issues is relevant to this thesis.
1.3.1
Sources of speech variability
There are many sources of variability which can challenge a speech recognition system. We may group them into the following categories, in roughly increasing order of the difficulty they pose for robust recognition.
Additive noise includes background noise from the channel (such as white or pink noise) as
well as background noise from the environment. Environmental background noise is either nonspeechlike (frequently encountered in an aircraft cockpit or automobile) or speechlike
(background babble, as in an office or other crowded environment). Additive noise may be stationary (background hiss, or steady vehicle noise) or nonstationary (pops, crackles, honking horns, etc.) but it is always uncorrelated with the speech signal.
Con volutive noise includes reverberance or echoes, filtering, clipping or saturation of elements
in the signal chain, and similar phenomena. Unlike additive noise, it is correlated with the speech signal, and consequently is more difficult to handle.
Talker variability can include both physical and habitual differences. Physical variability,
such as the age, size, or gender of the talker, can affect the vocal tract length, FO range, and the appearance of formants. Habitual variability, such as dialect and speech disorders (such as lisping) are stable for each talker, but can vary widely between talkers.
Production variability includes some of the most difficult phenomena to predict or to
recog-nize. Talker stress and speech rate can have significant effects on speech production. Phe-nomena such as lenition, epenthesis, and coarticulation (see section 1.3.2) can drastically modify the acoustic characteristics which correspond to the underlying phoneme sequence. While linguistic knowledge can characterize many of these phenomena, the conditions under
which they appear, and the degree to which they manifest, are often unpredictable.
Production variability is notorious for causing difficulty for speech recognition systems. In particular, the transition from isolated words to continuous speech is a great challenge, because variability (which often comes through overlapping of gestures) takes place across word boundaries as well as within words. Because such phenomena are especially prevalent in casual, continuous speech, robustness on continuous speech will be a central test of the vowel landmark detector in this thesis. Phenomena of production variability follow patterns which can be expressed via linguistic knowledge. Therefore, we hope that a LAFF system that can capture such linguistic knowledge will prove to be relatively robust on casual, continuous
speech.
1.3.2
Lexical vs. acoustic representations
A speech recognition system is typically evaluated by comparing its output to some sort
of transcription of the input speech signal (which will be called scoring in this thesis, see section 4.2.2). If the transcription of an utterance were a straightforward, unambiguous representation of the information in the speech signal, transcribed databases would be easy to use for testing, but this is not the case.
Lexical transcriptions
Almost all speech databases include a lexical transcription, usually orthographic in nature, which represents the words being spoken. The syllabic nuclei of a lexical transcription (their number and locations) are generally simple and unambiguous. (We are not primarily con-cerned with syllable boundaries, which can be much more ambiguous.) Lexical transcriptions are also relatively easy to generate, which helps to account for their popularity.
Unfortunately, there are many cases where a lexical transcription is not a reliable indicator of the acoustic representation of syllable structure. For complete speech recognition systems (whose output is lexical in nature), this may not be a major problem. But feature extraction systems (like a Vowel landmark detector) attempt to represent the information in the acoustic signal, without reference to a lexicon, and differences between the acoustic information and the transcription are a very difficult problem to deal with.
consonants (as in "please" becoming similar to "police") or nasal consonants ("arm" becom-ing like "carom"). Epenthetic insertion of vowel-like sounds can also occur at the release of a final stop consonant.
Vowels can be reduced when unstressed, almost to the point of total disappearance (as in "support" becoming similar to "sport" except for aspiration) especially for reduced vowels in unvoiced contexts, such as the first vowel in "potato." This type of reduction is called
vowel deletion, omission, or elision.
Vowels in sequence with semivowels can be particularly hard to characterize. A word like "fear" should have one syllable, but it can be pronounced with two, and in extreme cases, the two vowels may appear to be separated by a glide, which is another kind of epenthesis. The situation is even more complicated with "fire" or "file" which are liable to be pronounced with one syllable in some regional dialects (American Southern) and two syllables in other dialects (American Northeast).
Two vowels in sequence can also be hard to characterize. A word like "coerce" (two syllables) may sound like "coarse" or "quirts" (one syllable), which is an example of coalescence, or it may have two well produced vowels together, or it may sound like "cowers" with two vowels separated by an epenthetic glide. Coalescence also occurs across word boundaries, as in "see
in."
Some lexical transcriptions are time aligned with the acoustic signal, but most are not. Scoring is much easier with a time aligned transcription. Without it, the only practical alternative is to match the total number of syllables detected to the transcription, which does not allow identification of individual detections or errors. Worse, this scheme cannot identify a deletion in one area and an insertion in another area as an error (bearing in mind that a Vowel landmark indicates the existence of a syllabic nucleus, without characterizing
it).
For all these reasons, a lexical transcription is likely to be an inaccurate representation of the acoustic manifestation of syllable structure.
Acoustic transcriptions
Some speech databases include an acoustic transcription, which is usually a string of phones or allophones, representing the speech sounds manifested in the speech signal. Only the LAFF database [10] is transcribed directly as landmarks. Acoustic transcriptions are almost always time aligned, which helps in the scoring process.
One problem with acoustic transcriptions is that they are time consuming to generate. They require skilled transcribers who have to spend a fair amount of time creating the transcrip-tions, time aligning them, and cross checking to correct errors. Because of the effort involved, acoustic transcriptions are rather rare, especially for databases of spontaneous speech and casual conversations.
A more serious problem is that acoustic transcriptions are often not unique or unambiguous. A phonetic segment transcription imposes categorical decisions on acoustic information that varies across a continuum. How these decisions should be made is far from clear.
For instance, Pitrelli [68] describes the process for assigning phone boundaries in the aligned phonetic transcription of the TIMIT database.
For vowel-vowel transitions, which tend to be gradual, half of the total duration is allocated to each, unless one of the vowels is reduced, in which case the reduced
vowel is marked to be one-third of the total and the other vowel, two-thirds. For transitions between vowels and semivowels, one-third of the duration is allocated to the semivowel and two-thirds to the vowel. [ibid., p. 134]
While this procedure is unambiguous, it makes no attempt to examine the acoustic char-acteristics of the speech signal or to generate a transcription which reflects the acoustic evidence.
Even without such ambiguity, acoustic transcriptions are vulnerable to errors, because there is no easy way to check for consistency. Errors can be introduced by transcribers who have ac-cess to the orthography; lexical and semantic knowledge will also influence the transcription, even when the goal is supposed to be a purely acoustic representation. Different transcribers may also use different conventions in ambiguous situations, which would introduce even more inconsistency.
In sum, both lexical and acoustic transcriptions are likely to have problems when used as a reference to evaluate the performance of a syllable detector. The main problem with lexical transcription is the variability between the transcription and the acoustic information, while the main problem with acoustic transcription is availability. Section 4.2.2 will address methods for dealing with transcription problems.
1.3.3
Statistical vs. knowledge based recognition
Most of the early work in speech recognition used knowledge-based methods, attempting to explicitly incorporate speech knowledge. The expectation was that the insights of acoustics, speech production, and linguistic phenomena would aid in achieving good performance over
Statistically-based recognition methods have largely supplanted knowledge-based methods over the course of the last two decades. Although we have a fair amount of qualitative knowledge about speech, implementing this knowledge in quantitative algorithms is still very difficult. Statistically-based methods (aptly called "ignorance models") avoid this problem, and have demonstrated better performance than knowledge-based methods for a variety of tasks.
Statistically-based methods do have their drawbacks. They generally impose a higher com-putational load on the system, they require time to train, and they do not generally allow the use of insight or speech knowledge in their design. None of these are major problems, except the following. The fundamental problem with statistically-based methods is their inability to cope with phenomena that are not well represented in their training data.
When the input data consist of clear, read speech, statistically-based methods can achieve very good performance, as shown by the results of the ARPA SUR project (section 2.3). Only recently have statistically-based systems been tested on casual, spontaneous speech (section 1.3.1), where they perform very poorly (see, for example, Lippmann [53]).
Casual speech, especially spontaneous speech, displays a wide range of variability (phenom-ena such as coalescence, epenthesis, and lenition) in a variety of combinations. Attempts to represent these phenomena (in all their possible combinations) lead to explosive growth of the training data set, which rapidly becomes impractical both to create and to use in training.
Knowledge-based methods, if they can be made to work well, should be more robust against the variability in spontaneous speech (because spontaneous speech is characterized by lin-guistic constraints that a knowledge based approach can incorporate, as discussed in sec-tion 1.3.1). This thesis will begin with a knowledge-based approach to vowel landmark
detection, with the understanding that some statistical methods may be added as appropri-ate, when necessary to achieve good performance (generally, when speech knowledge is not adequate).
1.3.4
Modular vs. integral architecture
Closely related, but separate, is the question of speech recognition (SR) system architecture. Statistically based systems generally have an integral architecture, with a single processing stage (such as an HMM) generating all the output, without explicit structure. Knowledge based systems generally have a modular architecture, with several stages of processing which pass information from one to another via clearly defined interfaces.
Mo 1 lar architecture is a staple of algorithm design and software engineering in general. It
allows each module to be developed, tested, and maintained separately, and even extended or replaced as better algorithms become available. When the interfaces between modules can be interpreted theoretically (e.g. as landmarks, features, and so on), a modular architecture is a natural for knowledge based processing.
The weakness of a modular architecture is its tendency to impose "hard" (irreversible) deci-sions on the early stages of processing. Any mistakes made by the first stage of processing will cause more severe errors in the processing stages that follow it. This problem is well known [71, p. 15] and will be called "cascade failure" in this thesis.
The primary way to avoid cascade failures, or at least to reduce their impact, is to minimize "hard" decisions in the early stages. In particular, measurements may be marked with a confidence score, which may be interpreted as a likelihood that the measurement is accurate. Maintaining confidence scores, and predicating later processing on the confidence of the
earlier measurements, helps avoid cascade failure. Therefore, the Vowel landmark detector should generate confidence scores for its output.
1.4
Theoretical and practical implementation issues
1.4.1
Definition of a Vowel landmark
The precise definition of a vowel landmark is set forth by Stevens [84] as:
The vowel landmarks are the places in the signal where there is a maximum in amplitude in the range of the first formant frequency. These places are usually where the first formant frequency is maximally high.
An accompanying figure [ibid., fig. 5.1] shows the first formant frequency tracks, as well as the relative amplitude of the first formant prominence. Choi [11, p. 5] states that "the vowel landmark is placed at a time when the amplitude of the first formant (Fl) is a maximum."
Thus, the definition gives several acoustic parameters (low frequency energy, first formant frequency, first formant amplitude) but does not explain how to combine them. As a practical matter, energy in a fixed low frequency band is a simple and reliable parameter, but accurate formant tracking is a notoriously difficult task (see, for example, [46]).
The definition also says "the time between the landmarks is rarely shorter than 120 ms, and, except when there is a pause, is rarely longer than about 350 ms in running speech."
Although not a strict constraint, these times make it clear that duration information should be used, and give a rough outline of what duration values can be expected.
There is some uncertainty about the relationship between a vowel landmark and a syllabic nucleus. What is the difference? The quote above makes it clear that a vowel landmark is an
acoustically defined entity. Some researchers seem to indicate that they consider a syllabic
nucleus as a lexically defined entity, but this usage may not be consistent. This thesis will assume that syllabic nuclei are lexical in nature, and vowel landmarks are acoustic in nature (see the discussion in section 1.3.2).
This definition appears to assume that the presence of a vowel landmark is independent of the characteristics or quality of the vowel. That is, the vowel landmark detector (VLD) detects the vowel landmark without regard to whether the vowel is high, low, front, back, etc. Such an assumption is probably more valid for simple cases (a single vowel between obstruent consonants) than for more complicated cases (several abutting vowels in sequence). See section 2.5.1 for more discussion.
There is some question of whether the definition of a vowel landmark is language independent. For now, this thesis will be confined to American English (keeping in mind the possibility of dialectic variation, as discussed in section 1.3.2).
1.4.2
Design goals
Robustness against production variability
degradation. (The definition of "performance" will be discussed in section 1.4.3.)
Robustness against cascade failure
The VLD must provide as much information as possible to following stages of processing. Each landmark consists of a time value (the location of the landmark in the speech signal) and a confidence score (the strength of acoustic evidence for a landmark, or confidence that this is a true landmark). The confidence score will help later stages of processing use the landmark appropriately.
Adaptability to input conditions
Changes in talker, talking rate, or level must not cause problems. The VLD should be insensitive to these changes or adapt to changing input conditions as necessary.
1.4.3
Optimization criteria
The VLD will be optimized or tuned for best performance. However, the criteria which define "best" will depend on the intended use of the VLD.
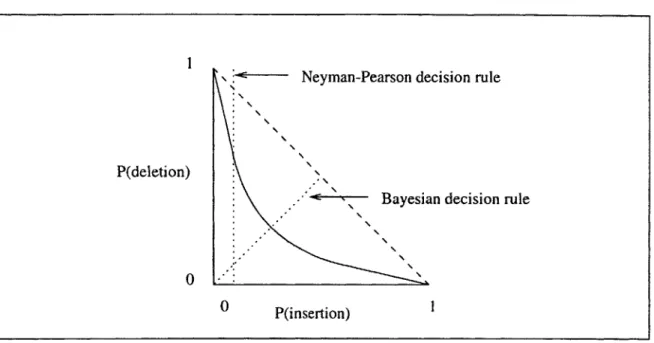
Detection theory describes several decision rules for a generic event detector. A Bayesian de-tector optimizes the expected cost of a decision, based on a priori probabilities of the event to be detected, and cost values for insertion and deletion errors. When a priori probabilities are not available, a minimax detector can be used, which minimizes the maximum average cost across all possible events. When cost values are not available, a Neyman-Pearson decision
1
P(deletion)
0
Neyman-Pearson decision rule
- ~ Bayesian decision rule
0 P(insertion)
Figure 1-1: Receiver Operating Characteristic. The curve shows the performance of a Likeli-hood Ratio Test as a function of its threshold value. Diffent threshold values can be chosen by different decision rules (dotted lines).
rule can be used, which minimizes the probability of an insertion error while constraining the probability of a deletion error to a fixed value (or vice versa).
All these criteria can be implemented as special cases of a Likelihood Ratio Test, which
sub-jects the measurement to a threshold (the threshold value depends on a priori probabilities and cost values). Its performance can be characterized by its Receiver Operating Character-istic (ROC) which shows the tradeoff between insertion and deletion errors as a function of the threshold value. See figure 1-1. The curve shows the performance of a Likelihood Ratio Test as a function of its threshold value. A Bayesian or minimax criterion corresponds to a line through the origin, as shown, whose slope is determined by the relative costs of insertion and deletion errors. A Neyman-Pearson criterion corresponds to a vertical line set by the desired probability of an insertion error (or, a horizontal line for deletion error).
A priori probabilities for Vowel landmarks, to the degree that they can be well defined (e. g. average frequency of landmarks in time), may be estimated from statistical studies of a
training database of speech signals. Cost values, however, must be assigned based on the detector's application.
Criterion 1: Minimize error rate
The classic criterion for SR systems is minimum error rate, where the error rate is the sum of the insertion rate and deletion rate. Implicitly, this treats insertions and deletions as equal in cost. We will use this criterion for most (if not all) experiments, in order to achieve results which can be easily compared to other systems.
Criterion 2: Maximize information output
In order to avoid "hard" decisions, a different criterion should be used. "Soft" decisions require that as much information as possible is passed to the following stages of processing. This implies that the cost of a deletion error is much greater than the cost of an insertion error. Put another way, the VLD should output practically all its hypotheses for vowel land-marks, even those of very low confidence. As long as the confidence scores for the landmark hypotheses are available, this will allow the following stages of processing to decide which to keep (using other sources of information, such as phonotactic relations with consonant land-marks). This criterion is appropriate for applications where the VLD's output will be post processed by another module, for instance, integration with Consonant and Glide landmarks, using phonotactic knowledge.
Criterion 3: Maximize confidence in output
Cascade failure (section 1.3.4) is a concern for systems with modular architecture (charac-teristic of knowledge based systems). One way to avoid cascade failures is for the VLD to output only landmarks which have a very high confidence score. This implies that the cost of an insertion error is much greater than the cost of a deletion error. Put another way, the VLD should output only those landmarks which have very high confidence, so that following stages of processing do not get confused by false landmarks (insertion errors). This criterion is appropriate for applications where the VLD's output is not post processed or checked for consistency. In particular, this is a natural criterion for a multipass architecture, in which the first pass focuses on the most robust landmarks only.
For the purpose of the experiments in this thesis, we will use minimum error rate as the criterion, which is unambiguous and allows direct comparison with other systems. We will keep in mind that other criteria will probably be more useful when the VLD is integrated into a prototype system.
Chapter 2
Background of Automatic Syllable
Detection (ASD)
This chapter is a review of past research and development of techniques for Automatic Syllable Detection (ASD) of human speech. Although there is very little published work describing Vowel landmarks as a concept, let alone algorithms for detecting them', ASD is a very similar task, with extensive research and development history.
2.1
How Vowel landmarks relate to ASD
Is Automatic Syllable Detection the same thing as Vowel Landmark Detection, and if not, how do they differ? This question depends on the circumstances in which a syllabic center (the presumed goal of ASD) is different from a vowel, or a vowel does not function as a
syllabic center.
Recall the discussion in section 1.4.1, where it was assumed that syllabic nuclei are lexical in nature, and vowel landmarks are acoustic in nature. However, ASD as described in the literature always uses gross acoustic information to find syllables. The differences between lexical syllables and their acoustic manifestation (see section 1.3.2) are not discussed in published articles on ASD (see sections 2.2 and 2.4). This section will assume that the goal of ASD is to find the acoustic evidence for a syllable, which may not always correspond to the underlying lexical presence of a syllable.
Sonorant consonants /m, n, ng, 1/ can appear as syllabic sonorant segments, usually manifes-tations of a schwa followed by a sonorant consonant. Syllabic sonorants can act as syllabic centers, as in the second syllable of "button," but are not classified as true vowels. Pre-sumably ASD will detect syllabic sonorants as syllabic centers. The published literature on LAFF
[80]
t84] do not make clear whether or not Vowel landmarks should be placed at syllabic sonorants. Their gross acoustic characteristics appear fairly vowel-like, with voicing and some formant structure, and they certainly fulfill the definition of a Vowel landmark, with a maximum in energy around the range of Fl. A Vowel Landmark Detector would have to make some rather subtle measurements to differentiate syllabic sonorants from true vow-els. For the purposes of this thesis, we will assume that syllabic sonorants should be marked with Vowel landmarks, just like true vowels, and if necessary, later stages of processing can be added to distinguish the landmarks of true vowels from those of syllabic sonorants.In careful speech, it seems that all vowels function as syllabic centers. However, in casual, continuous speech, vowel-vowel sequences can be elided to various degrees, so that "naive" is pronounced like "knife," or "coerce" becomes "coarse" for example. See section 1.3.2 for more examples of these phenomena, including examples of words whose syllable count seems to vary with dialect. Vowel-vowel and vowel-semivowel sequences deserve careful handling
for this reason. Section 4.2.2 will describe a scoring technique designed to deal with this kind of ambiguity.
In sum, it appears that ASD is similar enough to VLD that any differences are open questions rather than definite distinctions. Therefore, the published work in ASD is a reasonable starting point for VLD development. However, we want Vowel landmarks to be labeled with a meaningful confidence level or score, while most ASD techniques make a binary decision, without an output score. We will want to be aware of this requirement when choosing an algorithm.
2.2
Early work, mostly knowledge based
In the early days of speech recognition (SR), most of the techniques in use were explicitly knowledge-based, and syllable detection was usually one of the first steps in processing. Several leading research teams proposed schemes for automatic syllable recognition in the mid to late 1970's.
Weinstein and his team at MIT Lincoln Laboratories [88] and Kasuya and Wakita [41] both used LPC spectra to extract low-to-high frequency energy ratios. Weinstein detected syllabic nuclei by peak picking, while Kasuya used a conditioned linear discriminant function.
Mermelstein [61] and Medress et al. [58] both used power spectra to derive a low frequency energy profile, in the region of the first few formants of vowels. Medress detected syllabic nuclei by straightforward peak picking, while Mermelstein used a unique "convex hull" al-gorithm to recursively detect peaks which are prominent relative to their surroundings.
Zwicker et al. [93] used a critical band filter bank to derive low-to-high energy ratio profile, and detected syllabic nuclei by peak picking. Rabiner [70] used a normalizing technique on the total energy profile, and detected syllabic nuclei with a static threshold.
All of these techniques shared the basic premise of knowledge-based parameter extraction,
followed by fairly straightforward peak detection. Some of them produced quite good results (see Table 2.1), but it is important to note that all were operating on high quality speech input: read speech in quiet, usually as isolated words or slow, carefully read sentences. The few experiments that used spontaneous speech (such as Pfitzinger et al. [69]) show substantially poorer performance.
If there is any insight to be gained from Table 2.1, it is that comparisons between different
schemes are difficult to make. The wide variety of testing conditions and criteria make the performance numbers hard to compare directly.
2.3
The ARPA SUR project and its aftermath
By 1970, great progress had been made on talker-dependent recognition of isolated words
from a limited vocabulary. Extending these techniques to multiple talkers, continuous speech, and large vocabularies was proving to be a very difficult task. Critics questioned the value of the speech recognition research being done [67].
In 1971, the Advanced Research Projects Agency (ARPA) initiated a massive research effort to develop speech recognition systems that would overcome these problems. Specifically, the goals of the Speech Understanding Research (SUR) project were stated as "Accept connected speech from many cooperative speakers in a quiet room using a good microphone with slight
Front end Parameters Detection Corpus -Error Rate Mermelstein short term RMS energy convex hull slow careful 9.5% 1975 power spectrum 500-4000 Hz recursion speech in quiet
Weinstein LPC 1. FO detection dip detection clear read 3.0%
et al 10 kHz SR 2. RMS ratio peak picking sentences
1975 5 ms FP LF/HF in quiet
Medress FFT LF energy peak picking ?
et al 10 kHz SR and post proc (WER only)
1978 10 ms FP for consonants
Kasuya & LPC autocorr 1. RMS energy conditioned 7.69%
Wakita 10 kHz SR 2. LF/HF ratio 2D linear 1979 12.8 ms FP 3. LPC ratios discriminant
Zwicker & critical band LF/HF ratio peak picking German cities 1.43%
Terhardt filter bank (?) one talker
1979 in quiet
Hunt mel-scale loudness dip detection ?
et al cepstral profile (with duration (SER only)
1980 coefs constraint)
Rabiner RMS energy 1. ST envelope static threshold ?
1984 (zeroth order 2. median smooth (string error
autocorrelation) 3. normalize rate only)
Hermes Pitch synch FFT "Vowel strength" peak picking fluent Dutch 11.1% 1990 5 kHz SR (sum of spectral with duration & Dutch words 5.2%
10 ms FP peak factors) level constraints English words 4.7%
Fakotakis short term peak picking
et al energy with
1993 constraints
Pfitzinger FIR bandpass log energy, peak picking read German 12.9%
et al 250-2500 Hz smoothed, with duration spon German 21.0%
1996 lowpass 9 Hz constraint
Bitar 16 kHz SR mid freq Mermelstein TIMIT 20.1%
1997 25.6 ms Hamming energy convex hull read English
5 ms FP (two bands) (sonorant only) in quiet