HAL Id: hal-02134874
https://hal.archives-ouvertes.fr/hal-02134874
Submitted on 20 May 2019
HAL is a multi-disciplinary open access
archive for the deposit and dissemination of
sci-entific research documents, whether they are
pub-lished or not. The documents may come from
teaching and research institutions in France or
abroad, or from public or private research centers.
L’archive ouverte pluridisciplinaire HAL, est
destinée au dépôt et à la diffusion de documents
scientifiques de niveau recherche, publiés ou non,
émanant des établissements d’enseignement et de
recherche français ou étrangers, des laboratoires
publics ou privés.
Contamination of common spices by aflatoxigenic fungi
and aflatoxin B1 in Algeria
N. Azzoune, S. Mokrane, A. Riba, N. Bouras, Carol Verheecke, N. Sabaou,
Florence Mathieu
To cite this version:
N. Azzoune, S. Mokrane, A. Riba, N. Bouras, Carol Verheecke, et al.. Contamination of common
spices by aflatoxigenic fungi and aflatoxin B1 in Algeria. Quality Assurance and Safety of Crops &
Foods, Wiley-Blackwell, 2015, 8 (1), pp.137-144. �10.3920/QAS2014.0426�. �hal-02134874�
1. Introduction
Spices are products of plant origin used for thousands of years to season and to add flavour or colour to dietetic preparations, and have no nutritional value. The most countries that produce spices include India (74% of the world market), followed by Bangladesh (6%), Turkey (5%) and China (5%) (http://faostat.fao.org). Because of their processing (harvesting techniques, drying, storage) and environmental conditions, spices are among the most contaminated food products with toxigenic moulds and mycotoxins, especially aflatoxigenic fungi and aflatoxins (AF) (El Mahgubi et al., 2013; Hammami et al., 2014; Ozbey and Kabak, 2012). In Algeria, due to climatic conditions
characterised by high temperature and inadequate storage, spices are very susceptible to aflatoxin contamination. Aflatoxins have been clearly identified as toxic, mutagenic, teratogenic, and carcinogenic compounds. Aspergillus flavus and Aspergillus parasiticus are the main producers of AFs: aflatoxin B1 (AFB1), B2 (AFB2), G1 (AFG1) and G2 (AFG2) (Varga et al., 2011). In the EU, an acceptable level of aflatoxins for spices has been set at 5 µg/kg for AFB1 and 10 µg/kg for aflatoxins in combination (AFB1 + AFB2 + AFG1 + AFG2) (FAO, 2004). However, the Algerian regulation has set the maximum acceptable AFB1 and AFs levels at 10 µg/kg for human foods and 20 µg/kg for animal feeds.
Contamination of common spices by aflatoxigenic fungi and aflatoxin B
1in Algeria
N. Azzoune1, S. Mokrane1, A. Riba1*, N. Bouras1,2, C. Verheecke3, N. Sabaou1 and F. Mathieu3
1Laboratoire de Biologie des Systèmes Microbiens (LBSM), Ecole Normale Supérieure de Kouba, B.P. 92, 16 050 Algiers,
Algeria; 2Département de Biologie, Faculté des Sciences de la Nature et de la Vie et Sciences de la Terre, Université de
Ghardaïa, B.P. 455, 47000 Ghardaïa, Algeria; 3Université de Toulouse, INPT-ENSAT, Laboratoire de Génie Chimique,
UMR 5503 (CNRS/INPT/UPS), 1 Avenue de l’Agrobiopole, B.P. 32607, Auzeville-Tolosane, 31326 Castanet-Tolosan, France;
riba_amar@yahoo.fr
Abstract
Spices are usually produced in areas where the climatic conditions are favourable to growth of toxigenic fungi and production of mycotoxins. This study assesses the occurrence of aflatoxigenic fungi and aflatoxin B1 (AFB1) in spices marketed in Algeria. A total of 44 spice samples (4 for each type of spice) composed of aniseed, black pepper, caraway, cinnamon, coriander, cumin, ginger, red pepper, saffron, sweet cumin, and sweet pepper were collected from four popular markets located in Algeria. Mycological analysis of the spice was by dilution plating while AFB1 contamination levels were determined by high-performance liquid chromatography coupled with fluorescence detection (HPLC-FLD) after post-column derivatisation. The commonly isolated fungi were species of Aspergillus (56.4%), Penicillium (25.1%), Mucor (12.8%) and Eurotium (5.7%). Species belonging to Aspergillus section Flavi represented 28.9% of the total Aspergilli. The aflatoxin producing ability of isolates belonging to Aspergillus section
Flavi was determined on coconut agar medium and confirmed by thin layer chromatography and HPLC-FLD.
Ninety-four isolates (38.4%) of the 245 Aspergillus section Flavi examined produced aflatoxins. The most frequent chemotypes (84%) correspond to isolates able to produce both aflatoxin B and cyclopiazonic acid followed by the producers of only aflatoxin B. Twenty-three (63.9%) of the 36 spices contained AFB1 at levels ranging from 0.10 to 26.50 µg/kg. Two saffron (24.34 and 26.50 µg/kg) and two sweet cumin (14.65 and 19.07 µg/kg) samples were above the Algerian regulatory limit of 10 µg/kg. This work represents the first report about the occurrence of aflatoxigenic fungi and AFB1 in the common spices in Algeria.
To the best of our knowledge, contamination of aflatoxigenic fungi and AFs in common spices marketed in Algeria has not been previously reported. Therefore, the aim of this study was to investigate the natural occurrence of aflatoxigenic fungi and AFB1 present in spices used widely in Algeria for the preparation of processed foods. A total of 44 spice samples (4 for each type of spice), commercialised in Algeria, including aniseed (Pimpinella anisum L.), black pepper (Piper nigrum L.), caraway (Carum caraway L.), cinnamon (Cinnamomum zeylanicum), coriander (Coriandrum sativum L.), cumin (Cuminum cyminum L.), ginger (Zingiber officinale Rosc.), red pepper (Capsicum frutescens L.), saffron (Crocus sativus L.), sweet cumin (Foeniculum vulgare Mill.) and sweet pepper (Capsicum annuum L.) were analysed for aflatoxigenic fungi by standard mycological analysis techniques and for AFB1 by high-performance liquid chromatography coupled with fluorescence detection (HPLC-FLD) and post-column derivatisation.
2. Materials and methods
Samples collection
Forty-four samples of spices were chosen on the basis of their availability in the market and popularity of usage, and were collected randomly from locally popular markets stalls in four cities (Algiers: 36°46'N 3°13'E, Batna: 35°33'N 6°10'E, Biskra: 34°51'N 5°44'E and Oran: 35°41'N 0°37'W) in Algeria during May 2012. The collected samples (4 for each type of spice) included cumin, coriander, black pepper, caraway, red pepper, sweet pepper, aniseed, sweet cumin, saffron, cinnamon and ginger. Spices sampling was done in accordance with sampling provision described on European Regulation no. 401/2006 (EC, 2006). One hundred grams of samples were ground to a fine powder using a Waring blender (Waring, Torrington, CT, USA) at high speed for a short period to avoid heating of the sample.
Standard and reagents
All reagents (potassium chloride, phosphoric acid and hydrochloric acid) were of pro analysis grade. All solvents (methanol, acetonitrile, n-hexane and chloroform) were of HPLC grade. They were purchased from Merck (Darmstadt, Germany). Deionised water was used for the preparation of all aqueous solutions and for HPLC. Standard toxins, aflatoxins (AFB1, AFB2, AFG1, AFG2), cyclopiazonic acid (CPA), and Ehrlich’s reagent (1 g of 4-dimethyl-aminobenzaldehyde in 75 ml ethanol and 25 ml concentrated HCl) were supplied by Sigma Chemicals (Saint Quentin Fallavier, France). The working solutions were prepared according to the AOAC procedure (AOAC, 2000).
Mycological analyses of spice samples
Dilution plating was used as the enumeration technique (Pitt and Hocking, 1997). Ten grams of each sample were added to a sterile 250 ml Erlenmeyer flask containing 90 ml of sterile water supplemented with 0.1% of Tween 80. This mixture was stirred for 10 min using a magnetic stirrer, and then decimal dilutions of 10-2, 10-3 and 10-4
fold were made. Aliquots of 100 µl of each dilution were spread (in triplicate) on the surface of the dichloran rose-bengal chloramphenicol agar medium (Sigma Chemicals) (King et al., 1979). Incubation took place at 28 °C for 5-7 days in the dark. Isolates of Aspergillus section Flavi were also cultured on Aspergillus flavus-parasiticus agar (Sigma Chemicals) for 3-5 days at 28 °C, in the dark, to confirm group identification by colony reverse colour. Stock cultures of the representative isolates were maintained for further examination in 20% glycerol at -20 °C.
The colonies of each glycerol tube were sub-cultured on 90 mm diameter petri-dishes containing 15 ml of malt extract agar (Sigma Chemicals) and Czapek-Dox agar (Sigma Chemicals). Cultures were incubated for 7 days at 25 °C, in the dark, and then analysed for colony colour, presence and size of sclerotia, head seriation and conidial morphology. For micro-morphological observations, the isolates were examined under the microscope (10×, 40× and 100× magnification). Identification was performed according to the taxonomic keys and guides available for the Aspergillus genus (Pitt and Hocking, 1997; Klich, 2002; Samson et al., 2004).
The production of sclerotia by Aspergillus section Flavi was examined following the procedures described by Pildain et al. (2008). The isolates tested were grown on Czapek yeast agar (CYA) at 28 °C away from light. The production of sclerotia was followed periodically for three weeks. The diameter of sclerotia (average, 50 to 60 sclerotia per colony) was measured under light microscope using a 500 µm gridded mesh plate.
Aflatoxins and cyclopiazonic acid production in
Aspergillus section Flavi
For a preliminary screening of aflatoxin production, strains were inoculated at a central point on a 6 cm diameter petri dish containing 10 ml of coconut agar medium (CAM) supplemented with 0.3% β-cyclodextrin (Fente et al., 2001), and incubated for 5 days in the dark at 28 °C. Cultures were tested for 365 nm UV light fluorescence and for bright orange-yellow colony reverse colouring expression under daylight. Thin layer chromatography (TLC) was used as a screening method to confirm the positive samples essentially as described by Calvo et al. (2004). The limit of detection (LOD) was 50 ng/ml.
Aflatoxigenic isolates were tested for CPA production on CYA medium following the method described by Pildain et al. (2004). To determine the detection limit, a series of different concentrations (0.5, 1, 10, 25 and 50 µg/ml) of CPA dissolved in methanol was prepared and a volume of 20 µl of each was applied to a silica-gel, which was previously impregnated with a solution of oxalic acid (2% in methanol) for 2 min and dried. The plates were run in the same direction with ethyl acetate, 2-propanol and ammonium hydroxide (45:35:20, v/v/v). After pulverisation of the plates with Ehrlich’s reagent, the CPA was detected under daylight as an intense purple spot. The LOD of the TLC technique was 1 µg/ml.
Analysis of aflatoxin B1 in spices samples
Extraction of aflatoxin B1 from samples
Aflatoxin B1 levels were determined according to the methodology proposed by Nguyen et al. (2007) and Riba et al. (2010). A sub-sample of 20 g of thoroughly homogenised spices was finely powdered and added to 20 ml of 4% potassium chloride solution acidified to pH 1.5 with sulphuric acid. The mixture was homogenised and extracted with 180 ml acetonitrile on an orbital shaker (unimax 2010; Heidolph, Saffron Walden, UK) for 20 min and filtered through Whatman no. 4 filter paper (Whatman International Ltd., Maidstone, UK).
Purification of the extract
The n-hexane (100 ml) was added to the filtrate and shaken for 1 min. After separation, the upper phase (n-hexane) was discarded. 50 ml of deionised water and 100 ml of chloroform were added to the lower phases. The mixture was shaken for 10 min, and after separation, the lower phase (chloroform) was collected. The upper phase was re-extracted three times with 20 ml of chloroform using the above conditions. Then, 50 ml of 5% sodium bicarbonate was added and shaken for 10 min to the pooled chloroform extracts. The upper phase (bicarbonate) was collected, acidified to pH 1.5 with concentrated hydrochloric acid and allowed to stand about 20 min. The acidified solution was extracted three times with chloroform (100, 50 and 50 ml). The pooled chloroform phases were evaporated to near dryness under vacuum using a rotary evaporator (Laboratora 4000; Heidolph, Schwabach, Germany) placed in a 40 °C water bath. The extract was re-suspended in 1 ml of methanol, sonicated and filtered through a 0.2 µm Minisart cartridge (Sartorius AG, Göttingen, Germany). Aflatoxin B1 quantification was determined using HPLC (Ultimate 3000; DIONEX-Thermofisher scientific, Courtaboeuf, France). A post-column derivatisation electrochemically generated bromine (Coring Cell; Sigma-Aldrich) and a fluorescence detector (Spectra Physic 2000; Ultimate 3000, RS module; DIONEX-Thermofisher scientific) with 362 nm
for excitation, and 435 nm for emission) were used. The HPLC column used was a reverse phase RP C18 ProntoSil analytical column (250 × 4 mm, 3 µm particle size; Atlantic labo ics, Bruges, France) preceded by a C18 pre-column (Ultrasep 10 × 4 mm; Atlantic labo ics). The mobile phase consisted of distilled water, acetonitrile, methanol (6:2:2, v/v/v) with 119 mg/l of KBr and 110 µl/l of 65% HNO3. The injection volume was 20 µl and flow rate was 1 ml/min. Recovery experiments
Recovery experiments were performed by spiking AFB1 -free spices (20 g of ground sample) with two concentration levels (5 and 20 µg/kg) with AFB1. Spiking was carried out in triplicates and a single analysis of a blank sample was also carried out. Aflatoxin B1 concentrations were determined by HPLC analysis using the previously described method.
3. Results and discussion
Occurrence of fungi in the spices
A total of 44 samples of 11 different spices samples were analysed (Table 1). The density of the total fungal flora ranged from 450±113 to 2,010±1,494 cfu/g. The most contaminated spices are ginger, sweet pepper, red pepper, sweet cumin and saffron. However, aniseed, black pepper, coriander, caraway, cumin and cinnamon are relatively less contaminated as shown in Table 1. The commonly isolated fungi were species of Aspergillus (56.4%), Penicillium (25.1%), Mucor (12.8%) and Eurotium (5.7%) (Figure 1). The contamination frequencies of the spices by Aspergillus spp. varied between 16.3 and 86.4%. Highest frequencies were recorded in saffron (86.4%), ginger (82.6%), black pepper (71.4%), sweet pepper (69.6%) and red pepper (61.4%). The mean occurrence of Aspergillus in the sweet cumin, coriander, caraway, cumin and cinnamon was 59.7, 58.6, 47.4, 34.9 and 31.6%, respectively. However, aniseed was contaminated less frequently by Aspergillus spp. (16.3%). Most investigations in regions with warm climates have highlighted the prevalence of fungal species of the genus Aspergillus in spices. Our results are consistent with those reported by El-Kady et al. (1992), Hashem and Alamri (2010) and El Mahgubi et al. (2013). However, considerable heterogeneity was observed in the density of fungal flora in samples belonging to the same origin and location. Indeed, the quality of foods of plant origin after harvest is influenced by a wide variety of biotic and abiotic factors (Magan and Aldred, 2005). Aspergillus section Flavi isolates were present in 37 (88.0%) of 44 analysed samples with high incidence in saffron (64.1%) and ginger (58%). Red pepper, caraway and cumin showed contamination frequencies of 24.2, 20.7 and 18.9%, respectively. However, relatively low frequencies were recorded in black pepper, cinnamon and aniseed. Several studies showed that Aspergillus section
Flavi is predominant over other species in different commercialised spices (Garrido et al., 1992; Hashem and Alamri, 2010; Kong et al., 2014).
Aflatoxins, CPA, sclerotia production and chemotypes of
Aspergillus section Flavi
The incidence of aflatoxigenic strains is shown in Table 2. Our results showed that the ability to produce AFs varied considerably from one isolate to another. It is
known that typical A. flavus strains produce AFB and CPA, but this production is extremely variable (Richard et al., 1992). Among 245 isolates, 94 (38.4%) were aflatoxigenic with variable incidence (Table 1). Analysis of aflatoxin production by fluorescence in CAM showed a good correlation with the TLC results. Indeed, all strains producing blue fluorescence pattern on CAM with brilliant orange-yellow reverse coloration under daylight showed an intense blue and green fluorescence spot on TLC plates for AFB and AFG, respectively. The percentage of aflatoxigenic strains of A. flavus has been shown to vary with the nature of substrate and environmental factors (Horn, 2003; Klich, 2007).
Based on mycotoxin production patterns (AFB, AFG and CPA) and sclerotia size, the 94 aflatoxigenic strains were classified into seven chemotypes (Table 2). The majority of the aflatoxigenic strains (84%) produced CPA. Many authors highlighted a positive correlation between the production of AFB and CPA. Thus, Pildain et al. (2008) pointed out that CPA is produced not only by strains producing AFB like A. flavus and occasionally Aspergillus pseudotamarii, but also by Aspergillus minisclerotigenes and Aspergillus parvisclerotigenus that produce both AFB and AFG. The chemotypes I, II, III and IV (70% of the total aflatoxigenic strains) with yellow-green colonies and smooth to finely rough globose conidia represents the morphotype of typical
Table 1. Occurrence of moulds1, Aspergillus, Aspergillus section Flavi, and aflatoxigenic isolates in 44 samples spices collected from markets in Algeria.
Origin of spices
Spices (n=4) Total fungal flora ± SD (cfu/g)2
Aspergillus
(%)3 Aspergillus section Flavi
(%)4 Number of isolates tested Number of aflatoxigenic isolates (%)5
Algiers aniseed (Pimpinella anisum L.) 800±370 16.3 06.4 5 5 (100)
red pepper (Capsicum frutescens L.) 1,175±678 61.4 24.2 20 4 (20.0)
sweet cumin (Foeniculum vulgare Mill.) 1,031±457 59.7 31.1 20 8 (40.0)
sweet pepper (Capsicum annuum L.) 1,646±100 69.6 36.8 46 8 (17.4)
Batna black pepper (Piper nigrum L.) 719±71 71.4 16.3 6 1 (16.7)
caraway (Carum caraway L.) 565±322 47.4 20.7 7 5 (71.4)
coriander (Coriandrum sativum L.) 752±312 58.6 30.3 12 7 (58.3)
Biskra cumin (Cuminum cyminum L.) 550±330 34.9 18.9 7 1 (14.3)
Oran cinnamon (Cinnamomum zeylanicum L.) 450±113 31.6 11.2 2 0 (0.0)
ginger (Zingiber officinale Rosc.) 2,010±1,494 82.6 58.0 74 41 (55.4)
saffron (Crocus sativus L.) 1,015±658 86.4 64.1 46 14 (30.4)
Total 245 94 (38.4)
1 The commonly isolated fungi were species of Aspergillus, Penicillium, Eurotium and Mucor. 2 SD = standard deviation.
3 Calculated as a percentage of the total fungi. 4 Calculated as a percentage of the total Aspergillus.
5 For a preliminary screening of aflatoxin production, cultures were observed for fluorescence on coconut agar medium under long-wave UV-light (365 nm) after 3, 5 and 7 days and then confirmed by thin layer chromatography (TLC). The limit of detection of the TLC method for aflatoxin B and G was 50 ng/ml.
Aspergillus Penicillium
Mucor Eurotium
Figure 1. Incidence of the commonly isolated fungi (%) isolated from spices commercialised in Algeria.
A. flavus (Samson et al., 2004). Giorni et al. (2007) found that 70% of A. flavus isolated from maize in Italy were aflatoxigenic amongst which half were CPA producers. In addition, differences in AFs production by the toxigenic isolates may be in relation to the size of sclerotia (Criseo et al., 2001). According to Hua (2003), all of the isolates producing sclerotia of type ‘S’ were aflatoxigenic, whereas isolates producing sclerotia of type ‘L’ were the most frequent and includes producers and non-producers of AFs. The chemotype I (44.5%) and chemotype II (29.8%) were the majority strains. The isolates belonging to the chemotype V and VI with small ‘S’ sclerotia (<400 µm), were stronger aflatoxin producers than large ‘L’ sclerotia (>400 µm) isolates. The isolates of chemotype V could belong to the atypical A. flavus. However, the chemotype VI are related to A. minisclerotigenes or A. parvisclerotigenus. The type ‘S’ was rare (Giorni et al., 2007) and encountered frequently in regions with high temperatures and low rainfall (Cardwell and Cotty, 2002). These authors suggest that the production of sclerotia of type ‘S’ is a form of adaptation to climatic fluctuations. The isolate belonging to the chemotype VII had distinctly darker green colonies and rough conidia, and produced AFB and AFG but not CPA; hence they may be related to A. parasiticus.
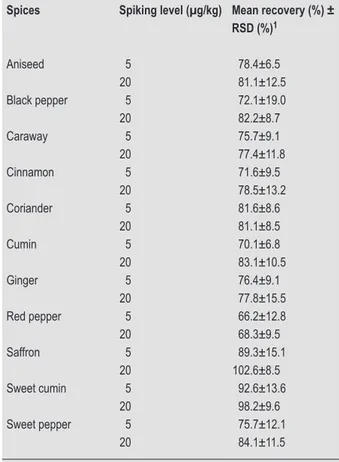
The results of recovery of aflatoxins are summarised in Table 3. The average recoveries were between 66.2 and 102.6%. The performance characteristics were within the acceptable margins indicated in the Commission Regulation no. 401/2006 (EC, 2006) for methods of sampling and analysis for the official control of mycotoxins. The LOD and limit of quantification (LOQ) were determined by spiked spices samples with 5 µg/kg of AFB1, based on
signal-to-Table 2. Chemotype patterns of aflatoxigenic strains isolated from spices collected from markets in Algeria based on aflatoxins and cyclopiazonic acid producing ability, and on sclerotia size.
Chemotype Mycotoxin1 Sclerotia2 Number of
isolates
Percentage (%)3
AFB1 AFG1 CPA
I + – + – 42 44.5 II + – + L 28 29.8 III + – – L 2 2.0 IV + – – – 7 7.3 V + – + S 10 10.6 VI + + + S 4 4.1 VII + + – – 1 1.2 1 AFB
1 = aflatoxin B1; AFG1 = aflatoxin G1; CPA = cyclopiazonic acid; + = detected; – = non-detected. 2 The large strain (L) having sclerotia >400 mm in diameter and the small strain (S) with sclerotia <400 mm. 3 Percentage of the 94 aflatoxigenic isolates.
Table 3. Recoveries of aflatoxin B1 from spiked non-con-taminated spices samples fortified with 5 and 20 µg/kg (n=3).
Spices Spiking level (µg/kg) Mean recovery (%) ± RSD (%)1 Aniseed 5 78.4±6.5 20 81.1±12.5 Black pepper 5 72.1±19.0 20 82.2±8.7 Caraway 5 75.7±9.1 20 77.4±11.8 Cinnamon 5 71.6±9.5 20 78.5±13.2 Coriander 5 81.6±8.6 20 81.1±8.5 Cumin 5 70.1±6.8 20 83.1±10.5 Ginger 5 76.4±9.1 20 77.8±15.5 Red pepper 5 66.2±12.8 20 68.3±9.5 Saffron 5 89.3±15.1 20 102.6±8.5 Sweet cumin 5 92.6±13.6 20 98.2±9.6 Sweet pepper 5 75.7±12.1 20 84.1±11.5
noise ratio of 3:1 for the LOD and 10:1 for the LOQ. The LOD was established in 0.05 µg/kg. The LOQ was 0.1 µg/kg.
Aflatoxins content in spices
Of the 36 spices samples analysed by HPLC-FLD, 23 (63.9%) were contaminated with AFB1 at concentrations ranging from 0.2 to 26.50 μg/kg (Table 4). The high levels of AFB1 (26.50, 24.34, 19.07 and 14.65 µg/kg) were found in saffron and sweet cumin, respectively. These levels of AFB1 are higher than the maximum limits set by Algerian regulations (10 µg/kg). In aniseed, black pepper, caraway, cinnamon, coriander, cumin, ginger, red pepper and sweet pepper, AFB1 was detected with levels ranging from 0.10 to 3.44 µg/kg, lower than limit as recognised in Algeria (FAO, 2004). The occurrence of mycotoxins in spices differs geographically and depending on the climatic conditions. The presence of AFB1 in widely varying amounts in spices has been reported by many authors (El Mahgubi et al., 2013; Kong et al., 2014; Ozbey and Kabak, 2012; Prelle et al., 2014; Zinedine et al., 2006).
Little data were reported about the contamination of saffron by mycotoxins. In Portugal, Martins et al. (2001) reported aflatoxin contamination of about 40% (2.0 to 2.75 µg/kg) in saffron. Aziz et al. (1998) reported the absence of aflatoxins in 5 samples analysed in India. The results reported in the literature concerning cumin are very different. Thus, contamination level of this spice in Morocco, a neighbouring country with the same climate as Algeria, is 57% (8 of 14
analysed samples) and up to 0.18 µg/kg (Zinedine et al., 2006). In Portugal, AFs occurred in 42.9% of analysed cumin (1.25 to 2.3 µg/kg; Martins et al., 2001). Kursun and Mutlu (2010) reported that AFs contamination varied from 4.55 to 8.57 µg/kg in cumin samples from Turkey. However, no AFs were detected in analysed cumin sampled in India (Aziz et al., 1998), Ireland (O’Riordan and Wilkinson, 2008) and Turkey (Bircan, 2005). Furthermore, Bircan (2005) suggested that cumin is not suitable for AFs production. Additionally, Juglal et al. (2002) noted that the absence of AFs in the cumin and cinnamon may be due to inhibition of the aflatoxigenic fungi by essential oils and other aromatic substances produced by these plants.
However, Madhyastha and Bhat (1985) reported that the red pepper and ginger are good substrates for growth and production of AFs. The screening for AFB1 in black pepper, cumin and cinnamon proved negative. Our results are in accordance with those reported by many authors. For example, Elshafie et al. (2002) reported the contamination of 105 samples of spices (cumin, cinnamon, cloves, black pepper and turmeric) by A. flavus; however, AFs were not detected in the spices samples. Bartine and Tantawi-Elaraki (1997) found that growth of toxigenic strains of A. flavus was very low on black and white pepper, which was associated with the absence of AFB1.
For black pepper, our results agree with those reported by Romagnoli et al. (2007) and Cho et al. (2008), who reported the absence of AFs in 11 and 2 samples analysed in Italy and Korea, respectively. In Turkey, Colak et al. (2006) reported contamination of 8.3% samples at 9.8-10.3 µg/kg. In Hungary, Fazekas et al. (2005) reported that 1/5 of samples were contaminated (0.46 µg/kg). In Morocco, 47% of the samples were contaminated (Zinedine et al., 2006). For red pepper, Sugita-Konishi et al. (2010) were found that only one sample of 6 (16.7 µg/kg) was contaminated with AFs in Japan. However, in Turkey, Aydin et al. (2007) reported high levels of AFB1 contamination in red pepper with levels of contamination up to 40.9 µg/kg. Red pepper, in particular, appears to be quite a susceptible product for AF formation as a result of unsuitable processing conditions. Furthermore, few reports about ginger, sweet cumin and caraway contamination by mycotoxins were reported. For example, only AFB1 were detected in ginger (0.18 µg/kg) (Cho et al., 2008). However, 10/12 (86%) of analysed samples in Morocco were contaminated (0.63-3.50) (Zinedine et al., 2006).
Concerning the cinnamon, several authors reported the absence of AF in this spice. For example, AFs were not found in any of cinnamon powder samples (n=17) in spices marketed in Turkey (Ozbey and Kabak, 2012). AFs were also not detected in cinnamon powder samples marketed in Japan (Hitokoto et al., 1978), India (Saxena and Mehrotra,
Table 4. Occurrence of aflatoxin B1 in spices samples (n=36) collected from markets in Algeria and analysed by high-performance liquid chromatography coupled with fluorescence detection.
Spices Number of positive samples/total number of analysed samples AFB1 (µg/kg)1 Aniseed 3/4 0.14-0.66 Black pepper 0/2 ND Caraway 2/2 0.10; 1.60 Cinnamon 1/2 0.20 Coriander 3/4 0.10-0.79 Cumin 0/2 ND Ginger 4/4 0.10-2.60 Red pepper 2/4 0.19; 3.44 Saffron 2/4 24.34; 26.50 Sweet cumin 2/4 19.07; 14.65 Sweet pepper 4/4 0.10-3.17 Total 23/36 0.10-26.50
1 The limit of detection was 0.05 µg/kg and the limit of quantification was 0.1 µg/kg; ND = not detected.
1989), Bahrain (Musaiger et al., 2008), Korea (Cho et al., 2008) and Ireland (O’Riordan and Wilkinson, 2008). These results indicate that cinnamon is likely not to be a good substrate for growth of mycotoxin-producing fungi and mycotoxin accumulation.
Despite the high incidence of aflatoxigenic isolates, aniseed, caraway, coriander and ginger had a low content of AFB1 (<3 µg/kg). The presence of mycotoxigenic fungi in food samples does not ultimately lead to the production of the respective mycotoxin. Many factors including storage and environmental conditions play a key role in the metabolism of secondary metabolites such as mycotoxins. This hypothesis may also explain in part no relationship between the incidence of mycotoxigenic isolates and the presence of the mycotoxins in a food as observed in our case. In this survey, a combination of mycological and AFs analysis were used to preliminarily assess the contamination of common spices marketed in Algeria. Our results show that there is a high risk potential for contamination of these products by aflatoxigenic fungi and AFB1, especially in saffron and sweet cumin.
4. Conclusions
In conclusion, our study showed that all analysed spice samples were contaminated by moulds; the most contaminated spices were ginger, sweet pepper, red pepper, sweet cumin and saffron. Most of isolated fungal species belonged to Aspergillus sections Flavi and Nigri. A considerable variation in the production of AFs was observed among the tested isolates. Furthermore, the quantification of aflatoxins in spices samples showed a wide range of contamination by AFB1. The present data suggest that some spices can represent a source of exposure to the carcinogenic mycotoxin, AFB1. For these reasons, it is necessary to take measures to produce better quality spices. For example, the improvement of post-harvest procedures such as drying techniques and storage conditions could be useful to minimise fungal growth and prevent mycotoxin contamination. Packing can also enhance hygienic condition and participate to the supply of healthy spices.
References
Association of Official Analytical Chemists (AOAC), 2000. Official methods for analysis. Natural toxins. AOAC, Rockville, MD, USA, chapter 9, p. 4.
Aydin, A., Erkan, M.E., Baskaya, R., and Ciftcioglu, G., 2007. Determination of aflatoxin B1 levels in powdered red pepper. Food Control 18: 1015-1018.
Aziz, N.H., Youssef, Y.A., El-Fouly, M.Z. and Moussa, L.A., 1998. Contamination of some common medicinal plant samples and spices by fungi and their mycotoxins. Botanical Bulletin of Academia Sinica 39: 279-285.
Bartine, H. and Tantataoui-Elaraki, A., 1997. Growth and toxinogenesis of Aspergillus flavus isolates on selected spices. Journal of Environmental Pathology, Toxicology and Oncology 16: 61-65. Bircan, C., 2005. The determination of aflatoxins in spices by
immunoaffinity column extraction using HPLC. International Journal of Food Science and Technology 40: 929-934.
Calvo, A.M., Bok, J., Brooks, W. and Keller, N.P, 2004. VeA is required for toxin and sclerotial production in Aspergillus parasiticus. Applied and Environmental Microbiology 70: 4733-4739.
Cardwell, K.F. and Cotty, P.J., 2002. Distribution of Aspergillus section Flavi among field soils from the four agroecological zones of the Republic of Benin West Africa. Plant Disease 86: 434-439. Cho, S.H., Lee, C.H., Jang, M.R., Son, Y.W., Lee, S.M., Choi, I.S.,
So-Hee Kim, S.H, and Kim, D.B., 2008. Aflatoxin contamination in spices and processed spice products commercialized in Korea. Food Chemistry 107: 1283-1288.
Colak, H., Bingol, E.B., Hampikyan, H. and Nazli, B., 2006. Determination of aflatoxin contamination in red-scaled, red and black pepper by ELISA and HPLC. Journal of Food and Drug Analysis 14: 292-296.
Criseo, G., Bagnara, A. and Bisignano, G., 2001. Differentiation of aflatoxin-producing and non-producing strains of Aspergillus flavus group. Letters in Applied Microbiology 33: 291-295.
El Mahgubi, A., Puel, O., Bailly, S., Tadrist, S., Querin, A., Ouadia, A., Oswald, I.P. and Bailly, J.D., 2013. Distribution and toxigenicity of Aspergillus section Flavi in spices marketed in Morocco. Food Control 32: 143-148.
El-Kady, S.S., El-Maraghy, M. and Eman Mostafa, M., 1992. Contribution of the mesophilic fungi of different spices in Egypt. Mycopathologia 120: 93-101.
Elshafie, A.E., Al-Rashdi, T.A., Al-Bahry S.N. and Bakheit, C.S., 2002. Fungi and aflatoxins associated with spices in the Sultanate of Oman. Mycopathologia 155: 155-160.
European Commission (EC), 2006. Commission Regulation no. 1881/2006 of December 19th (2006) Setting maximum levels of certain contaminants in foodstuffs. Official Journal of the European Union L364: 5-24.
Fazekas, B., Tar, A. and Kovacs, M., 2005. Aflatoxin and ochratoxin A content of spices in Hungary. Food Additives and Contaminants 22: 856-863.
Fente, C.A., Ordaz, J.J., Vazquez, B.I., Franco, C.M. and Cepeda, A., 2001. New additive for culture media for rapid identification of aflatoxin-producing Aspergillus strains. Applied and Environmental Microbiology 67: 58-62.
Food and Agriculture Organization (FAO), 2004. Regulations for mycotoxins in food and feed in 2003. FAO Food and Nutrition Paper 81. FAO, Rome, Italy.
Garrido, D., Jordal, M. and Poza, R., 1992. Mold flora and aflatoxin-producing strains of Aspergillus flavus in spices and herbs. Journal of Food Protection 55: 451-452.
Giorni, P., Magan, N., Pietri, A., Bertuzzi, T. and Battilani, P., 2007. Studies on Aspergillus section Flavi isolated from maize in northern Italy. International Journal of Food Microbiology 113: 330-338. Hammami, W., Fiori, S., Al Thani, R., Ali Kali, N., Balmas, V., Migheli,
Q. and Jaoua,S., 2014. Fungal and aflatoxin contamination of marketed spices. Food Control 37: 177-181.
Hashem, M. and Alamri, S., 2010. Contamination of common spices in Saudi Arabia markets with potential mycotoxin-producing fungi. Saudi Journal of Biological Sciences 17: 167-175.
Hitokoto, H., Morozumi, S., Wauke, T., Sakai, S. and Kurata, H. 1978. Fungal contamination and mycotoxin detection of powdered of herbal drugs. Applied and Environmental Microbiology 36: 252-256. Horn, B.W., 2003. Ecology and population biology of aflatoxigenic
fungi in soil. Journal of Toxicology – Toxin Reviews 22: 351-379. Hua, S.T., 2003. Biocontrol of Aspergillus flavus by saprophytic yeast,
progress from laboratory bioassay to field trial. In: Proceedings of the 3rd Fungal Genomics, 4th Fumonisin, and 16th Aflatoxin Elimination Workshops, October 13-15, 2003, Savannah, GA, USA. Juglal, S., Govinden, R. and Odhav, B., 2002. Spice oils for the control of
co-occurring mycotoxin-producing fungi. Journal of Food Protection 65: 683-687.
King, A.D., Hocking, A.D. and Pitt, J.I. 1979. Dichloran-rose bengal medium for enumeration and isolation of molds from foods. Applied and Environmental Microbiology 37: 959-964.
Klich, M.A, 2002. Identification of common Aspergillus species. Centraal Bureau voor Schimmel Cultures, Utrecht, the Netherlands. Klich, M.A., 2007. Environmental and developmental factors
influencing aflatoxin production by Aspergillus flavus and Aspergillus parasiticus. Mycoscience 48: 71-80.
Kong, W., Wei, R., Logrieco A., Wei J, Jing, W., Xiaoe X. and Yanga, M., 2014. Occurrence of toxigenic fungi and determination of mycotoxins by HPLC-FLD in functional foods and spices in China markets. Food Control 28: 354-361
Kursun, O. and Mutlu, A.G., 2010. Aflatoxin in spices marketed in the west Mediterranean region of Turkey. Journal of Animal and Veterinary Advances 9: 2979-2981.
Madhyastha, M.S. and Bhat, R.V., 1985. Evaluation of substrate potentiality and inhibitory effects to identify high risk spices for aflatoxin contamination. Journal of Food Science 50: 376-378. Magan, N. and Aldred, D., 2005. Conditions of formation of ochratoxin
A in drying, transport and in different commodities. Food Additives and Contaminants 22 Suppl. 1: 10-16.
Martins, M.L., Martins, H.M. and Bernardo, F., 2001. Aflatoxins in spices marketed in Portugal. Food Additives and Contaminants 18: 315-319.
Musaiger, A.O., Al-Jedah, J.H., and De Souza, R., 2008. Occurrence of contaminants in foods commonly consumed in Bahrain. Food Control 19: 854-861.
Nguyen, M.T., Tozlovanu, M., Luyen Tran, T. and Pfohl-Leszkowicz, A., 2007. Occurrence of aflatoxin B1, citrinin and ochratoxin A in rice in five provinces of the central region of Vietnam. Food Chemistry 105: 42-47.
O’Riordan, M.J. and Wilkinson, M.G., 2008. A survey of the incidence and level of aflatoxin contamination in a range of imported spice preparations on the Irish retail market. Food Chemistry 107: 1429-1435.
Ozbey, F. and Kabak, B., 2012. Natural co-occurrence of aflatoxins and ochratoxin A in spices. Food Control 28: 354-361.
Pildain, M.B., Frisvad, J.C., Vaamonde, G., Cabral, J., Varga, D. and Samson, R.A., 2008. Two novel aflatoxin-producing Aspergillus species from Argentinean peanuts. International Journal of Systematic and Evolutionary Microbiology 58: 725-735.
Pildain, M.B., Vaamonde, G. and Cabral, D., 2004. Analysis of population structure of Aspergillus flavus from peanut based on vegetative compatibility, geographic origin: mycotoxin and sclerotia production. International Journal of Food Microbiology 93: 33-40. Pitt, J.I. and Hocking, A.D., 1997. Fungi and food spoilage (2nd Ed.).
Blackie Academic and Professional, London, UK, pp. 505-507. Prelle, A., Spadaro, D., Garibaldi, A. and Gullino, M.L, 2014.
Co-occurrence of aflatoxins and ochratoxine A in spices commercialized in Italy. Food Control 39: 192-197.
Riba, A., Bouras, N., Mokrane, S., Mathieu, F., Lebrihi, A. and Sabaou, N., 2010. Aspergillus section Flavi and aflatoxins in Algerian wheat and derived products. Food and Chemical Toxicology 48: 2772-2777. Richard, J.L., Bhatnagar, D., Peterson, S. and Sandor, G., 1992.
Assessment of aflatoxin and cyclopiazonic acid production by Aspergillus flavus isolates from Hungary. Mycopathologia 120: 183-188.
Romagnoli, B., Menna, V., Gruppioni, N. and Bergamini, C., 2007. Aflatoxins in spices, aromatic herbs, herb-teas and medicinal plants marketed in Italy. Food Control 18: 697-701.
Samson, R.A., Houbraken, J.A, Kuijpers, A.F.A., Frank, M.J. and Frisvad, J.C., 2004. New ochratoxin A or sclerotium producing species in Aspergillus section Nigri. Studies in Mycology 50: 45-61. Saxena, J. and Mehrotra, B.S., 1989. Screening of spices commonly
marketed in India for natural occurrence of mycotoxins. Journal of Food Composition and Analysis 2: 286-292.
Sugita-Konishi, Y., Sato, T., Saito, S., Nakajima, M., Tabata, S., Tanaka, T., Norizuki, H, Itoh, Y, Kai, S, Sugiyama K, Kamata, Y, Yoshiike, N. and Kumagai, S., 2010. Exposure to aflatoxins in Japan: risk assessment for aflatoxin B1. Food Additives and Contaminants Part A 27: 365-372.
Varga, J., Frisvad, J.C. and Samsom, R.A., 2011. Two new aflatoxin producing species and an overview ofAspergillus section Flavi. Studies in Mycology 69: 57-80.
Zinedine, A., Brera, C., Elakhdari, S., Catano, C., Debegnac, F.R., Angelini, S., De Santis, B., Faid, M., Benlemlih, M, Minardi, V. and Miraglia, M., 2006. Natural occurrence of mycotoxins in cereals and spices commercialized in Morocco. Food Control 17: 868-874.