Changing Subsystem Information Strategies Using Weighted
Objectives: Increasing Robustness to Biased Information Passing
The MIT Faculty has made this article openly available.
Please share
how this access benefits you. Your story matters.
Citation
Austin-Breneman, Jesse, Bo Yang Yu, and Maria C. Yang. “Changing
Subsystem Information Strategies Using Weighted Objectives:
Increasing Robustness to Biased Information Passing.” Volume 2A:
41st Design Automation Conference (August 2, 2015).
As Published
http://dx.doi.org/10.1115/DETC2015-47667
Publisher
ASME International
Version
Final published version
Citable link
http://hdl.handle.net/1721.1/120029
Terms of Use
Article is made available in accordance with the publisher's
policy and may be subject to US copyright law. Please refer to the
publisher's site for terms of use.
CHANGING SUBSYSTEM INFORMATION STRATEGIES USING WEIGHTED OBJECTIVES: INCREASING ROBUSTNESS TO BIASED INFORMATION PASSING
Jesse Austin-Breneman Bo Yang Yu Maria C. Yang
Department of Mechanical Engineering
Massachusetts Institute of Technology Cambridge, MA 02139
email: [email protected] email: [email protected] email: [email protected]
ABSTRACT
Complex system design requires managing compet-ing objectives between many subsystems. Previous field research has demonstrated that subsystem designers may use biased information passing as a negotiation tactic and thereby reach sub-optimal system-level results due to lo-cal optimization behavior. One strategy to combat the fo-cus on local optimization is an incentive structure that pro-motes system-level optimization. This paper presents a new subsystem incentive structure based on Multi-disciplinary Optimization (MDO) techniques for improving robustness of the design process to such biased information passing strategies. Results from simulations of different utility functions for a test suite of multi-objective problems quan-tify the system robustness to biased information passing strategies. Results show that incentivizing subsystems with this new weighted structure may decrease the error result-ing from biased information passresult-ing.
1 Introduction
A constant challenge in large engineering organiza-tions is to design and develop complex systems that suc-cessfully balance competing subsystem trade-offs. A num-ber of powerful structured design approaches have been formulated to model and optimize these trade-offs. In reworld practice, however, these approaches cannot al-ways be applied. In fact, teams must make choices based on time and budget, and may opt for satisficing decision-making [1], and often must address poorly defined prob-lems [2].
A rich body of literature exists to help complex system designers reach more optimal solutions. Formal conflict resolution processes and associated design support tools, such as the NASA Jet Propulsion Lab’s Icemaker [3] and market-based allocation algorithms [4], have also been de-veloped to facilitate communication and decision-making between subsystems. Mathematical simulations are also used to simulate the optimization of complex systems. Simpson, et al. review the multitude of problems that
Proceedings of the ASME 2015 International Design Engineering Technical Conferences & Computers and Information in Engineering Conference IDETC/CIE 2015 August 2-5, 2015, Boston, Massachusetts, USA
can be addressed through these types of algorithms [5]. Sobieszczanski-Sobieski and Haftka [6] demonstrate the range of aerospace applications.
Previous field study interviews by the authors with de-signers of complex systems has demonstrated two key find-ings about complex system design decision-making within a large aerospace organization. First, the informal system of negotiation between subsystems resolved the vast major-ity of design parameter conflicts. System integrators and subsystem designers estimated that the formal conflict res-olution process resolved between 5 to 10% of all conflicts. Second, biased information passing was a negotiation strat-egy used by many of the subsystems throughout the de-sign process. This strategy consists of reporting overly-conservative estimates of design parameters to other sub-systems in order to reserve excess capacity as a negotia-tion chip in future negotianegotia-tions [7]. In other words sub-systems tended to optimize around their own needs, rather than the needs of the overall system. This second observa-tion was formally modeled, and experiments showed that biased information passing could have a negative impact on the speed and feasibility of reaching a design solution. Reflection on the above two findings suggested one possi-ble strategy to combat biased information passing, which is to formulate an incentive structure to bring subsystems into alignment with the goals of the overall system.
This paper presents results from simulations of biased information passing that build on [7] by examining the role of subsystem incentives. In the new proposed incentive structure, at the end of every iteration each subsystem is evaluated not only on its own performance but also par-tially on the performance of the other subsystems. This may incentivize subsystem designers to consider solutions that benefit both subsystems instead of just their own. The simulations use Multi-Disciplinary Optimization (MDO) techniques to investigate the possible effects of changing incentive structures for subsystems.
This study seeks to answer the following questions: 1. What is the effect of biased information passing on
system-level optimality in a complex system with the proposed weighted incentive structure?
2. What impact might these strategies have on the speed and quality of system optimization?
Speed and optimality are important indicators for com-paring optimization algorithms and can lead us to a
bet-ter understanding of the impact of the proposed incentive structure. Is it feasible for such a system to achieve more optimal results if subsystems are incentivized to consider the performance of other subsystems? If so, is this struc-ture more robust to biased information passing than a nor-mal system?
2 Related Work
This paper draws on previous work in both formal mathematical models of the design process, negotiation within complex system design as well as decision-making literature from a variety of fields. Perspectives from these sources are used to gain insight into the design of proposed incentive structure and its effect.
2.1 Complex System Design Process Models
A substantial literature exists on modeling complex system design. One approach, Game Theoretic design, attempts to identify a rational design given limits to the amount and form of information being passed between designers. The use of Game Theory as an approach for modeling complex system design has been developed by Vincent [9], Lewis [10], and Whitfield, et al [11]. Traditional Game Theoretic approaches combined with Decision-Based Design [12] have been used in a broad range of design research [13–16], becoming a leading framework for the study of multidisciplinary design prob-lems [17].
The complex system design process can also be viewed as a multi-objective optimization problem. Multi-disciplinary Optimization techniques utilize this philoso-phy [18]. MDO models often rely on a system facilitator to make optimal trade-offs between subsystems to benefit the larger system. Design researchers draw from this lit-erature to appropriately model their particular instance of complex system design.
2.2 Design Process Simulations
Simulations based on these formal models have al-lowed researchers to observe the effect of changes on a number of factors. Researchers have compared team struc-tures [18–20], information passing strategies [7,21,22] and decision-making [23]. In doing this analysis, researchers have also suggested best practices for design processes.
Collopy proposed gradient-based information passing strat-egy for reaching optimal solutions [24]. Research areas such as robust design have explored the use of uncertainty models to support the decision-making process [25]. This study relies on this work to inform the design and analysis of the process simulations.
2.3 Negotiation in Complex System Design
The design of large-scale complex systems often relies upon negotiation between subsystems to determine the val-ues of engineering parameters. Due to its importance to de-sign outcomes, this type of negotiation has been studied in a variety of fields including design research, management science, economics and psychology. One area of research examines current practice within complex system design teams. Yassine, et al. described the phenomena of infor-mation hiding in complex system design [26]. The effect of the team or network structure on subsystem negotiations has also been studied [27]. Di Marco, et al. investigated the effect of individual team member culture on the negoti-ation process [28].
Another branch of research uses these insights to cre-ate prescriptive strcre-ategies for improving design outcomes. Ledyard et al. propose a market-based mechanism from economics for optimizing the allocation of resources in the design of shuttle payloads [4]. Smith and Eppinger utilized Work Transformation Matrices to help design teams iden-tify controlling features of a physical design and which sub-systems that will require more iterations than others [29] . Yassine and Braha developed a method to help subsystems represent complex task relationships better when negotiat-ing through the use of an information exchange model [30] . This paper draws on these sources to help model the ne-gotiation between subsystems and serve as a guide for the development of the proposed incentive structure.
2.4 Margin Use in Complex System Design
Uncertainty and its propagation through complex sys-tems is a well-studied area in design research. Takamatsu defined the concept of formal design margins for use in risk management throughout the complex system design pro-cess [33]. Based on this work, formal design margins are often defined as probabilistic estimates of design param-eter uncertainty relative to either worst-case estimates or performance objectives. These margins may be used as a
replacement for heuristic margins and intuition previously used by design teams. Thunnissen proposed methods for determining these margins and using them to manage risk tolerances [34]. Eckert et al. describe the multiple defini-tions of and use cases for margins in current practice. They then proposed clear definitions for margin use in complex system design [35]. Other researchers have demonstrated the range of applications of these concepts in supporting complex system design [36, 37].
2.5 Incentive Structures
Incentives and rewards can drastically influence indi-vidual’s behaviors, and aligning subsystem incentives with the strategic interest at the system level is one of the most important factors in the success of organization design [45]. Nadler and Tushman summarized that incentives must be clearly linked to performance, and also relate directly to the performance at each level of the organization [46]. Or-ganizations also need create proper incentives structures to avoid errors and accidents. Pat´e-Cornell reported cases in off-shore oil platform design where insufficient incentives to take safety measures lead to unsafe decisions [47]. Pre-vious studies suggest incentive structures is a possible way to mitigate the effect of biased information sharing between subsystems.
2.6 Design Support Tools
A wide range of design support tools have been de-veloped based on insights from complex system design re-search. NASA Jet Propulsion Laboratory’s ICEmaker is a spreadsheet-based tool for enabling communication of design parameters and constraints across subsystems [3]. Wang et al. review the use of metamodels to help design-ers approximate computationally-intensive complex sys-tem design tasks [38]. Intelligent decision-making sup-port in Computer-aided Design tools allows subsystems to collaboratively work on solid models with embedded con-straints [39, 40]. Other fields such as requirements engi-neering [41], architecture [42] and structural design [43] have also developed tools to help manage trade-offs in com-plex systems.
2.7 Problem Selection
The selection of test problems is a key issue in the val-idation of design process simulations. Coello, et al. [31]
provide a framework for multi-objective optimization test problems and guidelines for selecting a test suite. This work is part of a larger area of research addressing the de-velopment of appropriate test suites [32]. Although test suites can be useful for comparing and evaluating optimiza-tion algorithms, they may not be representative of algo-rithm performance on “real-world” problems. Both Coello, et al. and Deb, et al. recommend test suites comprised of a variety of types of problems in order to gain the most insight about performance differences. This paper draws from several sources to incorporate as many different types of test problems as possible.
2.8 Research Gap
This paper focuses on the interactions between subsys-tems in complex system design. Current complex system design support tools focus on formal interactions between subsystems through the use of committees, system integra-tors, contracts, auctions or other mechanisms. Since infor-mal negotiations between subsystems may dominate forinfor-mal interactions, this paper seeks to adapt the insights and tech-niques from the formal interactions to improve the behavior in the informal interactions. In particular, this study hopes to both improve the effectiveness of complex system design simulations by more realistically modeling the social com-ponent of human behavior and to improve design outcomes by suggesting a roadmap for developing a process which is robust to biased information passing.
3 Method
The work presented in this study consists of MDO sim-ulations of different biased information passing behavior under a proposed incentive structure. The simulations aim to quantify the effect of a change in incentive structure on system behavior when subsystems bias information pass-ing. A two-player system was simulated as this is a com-mon situation in the studied organization and also simpli-fied initial calculations.
3.1 Previous System Model
Previous work by the authors suggested that design teams may utilize a design optimization architecture which is sequential [7], such as fixed-point iteration [44]. The simulation structure is designed to emulate this behavior.
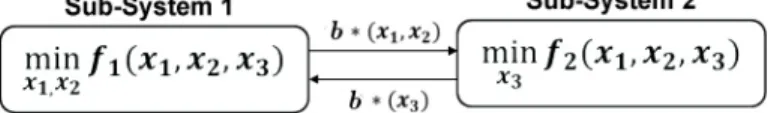
The two-player system model consists of two subsystems and their respective associated objective functions. Opti-mization is performed sequentially. First one subsystem optimizes its design parameters and then point design in-formation is passed to the second subsystem. The second subsystem then uses the passed information to minimize its design parameters. Point design information is then passed back to the first subsystem, completing a single system it-eration.
Figure 1. System schematic for one iteration
The previous study defined the concept of biases in the passing of point design information between subsystems and demonstrated their effect on system performance. The same model is used in this simulation structure. The biased information model consists of multiplying each passed de-sign point by a bias factor b. Three models were defined: no bias with b = 1, static bias b = 1.3, and decreasing bias where b was initially 1.3 and then decreased by .1 at each system iteration. These values for the bias were based on interviews of subsystem designers which found that sub-systems followed each of these patterns, with the decreas-ing case bedecreas-ing most common. This study builds on the pre-vious simulations by changing the objective functions of the subsystems to reflect the proposed incentive structure. This is presented in Figure 1.
3.2 Proposed Incentive Structure
The proposed incentive structure is based on weighted-sum approaches from MDO [31]. In weighted-weighted-sum ap-proaches, a single utility function is created consisting of a weighted sum of the objective functions.
U= n
∑
i=1
wifi (1)
where U is the utility function, i is the index of the ob-jective function, wiis a weighting coefficient between 0 and
1 with Σwi= 1, and fiis an individual subsystem objective function. The weighting coefficient is used to determine the relative importance of each objective function. For a given set of wi the utility function can be optimized and give an optimal solution to the system.
In the previously studied organization, subsystem per-formance is evaluated on the subsystem level. Each sub-system is given goals by sub-system integrators and meeting or exceeding the goals determines the performance of the subsystem. In the proposed incentive structure, subsystem performance would be evaluated at each system iteration as a weighted sum of the performance of all subsystems. By evaluating a subsystem using a utility function as the per-formance of the subsystem, it is hypothesized that subsys-tems may choose locally sub-optimal results that achieve more optimal system-level results.
3.3 Simulation of Impact of Incentive Structure The proposed incentive structure could impact subsys-tem designer behavior and thereby syssubsys-tem performance in a variety of ways. Subsystem designers could change the information passed, their decision-making process, their team structure, or their negotiation strategy. For example, subsystem designers could choose to reduce the amount of bias in the information passed. The simulations presented in this paper assume that subsystems will use the proposed utility function directly as their objective function. In addi-tion, these simulations assume that the subsystem design-ers will not make any change to their negotiation strategy, that is they will continue to bias the information passed. In a real system, this would involve greater effort on the subsystem designer’s part to determine the response of the other subsystem to the design inputs. In practice, this could be achieved through communication between the subsys-tem designers in their negotiation process. A subsyssubsys-tem designer might ask for information about the other subsys-tem’s response to proposed inputs. These simulations test the situation in which subsystem designers have perfect in-formation about both subsystem responses but are continu-ing to bias the information passed to the other subsystem.
In summary, the simulations consist of the optimiza-tion of two subsystems whose objective funcoptimiza-tions are utility functions. The utility functions are defined as the weighted sum of the subsystem objective functions from the test
problem.
U1= w1f1+ w2f2 (2)
U2= w2f1+ w1f2 (3)
For example, a system consisting of the utility func-tions U1= .9 f1+ .1 f2 and U2= .1 f1+ .9 f2 would model a system where 10% of each subsystem’s performance was based on the other subsystem’s performance. During each system iteration, the passed point design information was multiplied by a bias factor b. This is presented in Figure 2.
Figure 2. System schematic for one iteration
In this study, the weighting coefficients were varied to see the effect on system performance. A system without the incentive structure is represented by w1= 1, while the extreme case of each subsystem equally considering the performance of both subsystems is represented by w1= w2= 0.5. The weighting coefficient was varied by 5% be-tween 0.5 and 1 in order to get an overview of the incen-tive space. Thus, the weighting coefficients were defined as w1 = 0.5 + 0.05n for n = 0, 1, . . . 10. This work also tested the three bias conditions presented in the previous study.
These test conditions were simulated on a test suite of two-objective problems drawn from Multi-objective Evo-lutionary Algorithms by Coello, et al. [31] and from a test suite proposed by Deb, et al. [32] as described in section 2.7.
The final system performance was defined as the Eu-clidean distance of the final system design from the Pareto Frontier after satisfying the stopping condition. This can be considered the system-level optimality. This distance was normalized by the Euclidean distance between the Pareto maximum and minimum [1]. A value of zero for this nor-malized distance, dPF, would indicate a solution directly on the Pareto Frontier and a value of 100% would indicate a
solution at the normalizing distance. The stopping condi-tion was defined as either convergence for both subsystems f1(i) = f1(i − 1); f2(i) = f2(i − 1) or reaching a Nash Equi-librium [8] f1(i) = f1(i − 2); f2(i) = f2(i − 2). The Pareto Frontier for these test problems was often given as an ana-lytical solution in the test suite. If not available, the Pareto Frontier was calculated using the MATLAB Genetic Al-gorithm function GAmultiobj. The minimization of each subsystem was performed using the MATLAB optimiza-tion funcoptimiza-tion f min con with the interior-point algorithm.
Several parameters were varied at each condition. Each condition and test problem was solved starting at 100 ran-domly selected points to check for robustness to initial con-ditions. The order of sequential optimization was also var-ied for each testing condition. This checked whether having the first or second subsystem optimize first in each system iteration changed the behavior of the system.
The system optimization behavior was then analyzed to determine what the effect of each testing condition was on the performance metrics. The behavior was also compared to the specific problem characteristics such as types of con-straints and objective functions. This analysis is presented in the results and discussion sections.
4 Results
Simulation results are shown in Figures 3 and 4. Sys-tem performance under the test conditions was measured in terms of optimality and speed. Optimality was defined as the mode of the normalized Euclidean distance to the Pareto Frontier, dPF [7]. Two characteristics of the opti-mization setup were varied at each bias condition: the sub-system sequential optimization order and the initial starting points. The sequential optimization order had a negligible effect on the final system performance. In a small minor-ity of test problems, changing the sequential order added a few extra solutions to the set of final system results from the 100 random starting points. However, the use of linear utility function did change the sensitivity of system perfor-mance to the initial conditions. This was seen in the impact on the number of runs resulting in the modal optimality. Weighted-sum methods have been shown to have problems realizing Pareto Frontiers for problems whose true Pareto Frontier is concave [31]. This was also true in these simu-lations. For the test problems with concave Pareto Fron-tiers, the average number of runs resulting in the mode
was reduced from 77 to 42 with the introduction of util-ity functions. Additionally, only results from the static bias test condition are shown. This because the previous study demonstrated the decreasing bias and no bias case resulted in optimal solutions. Thus, adding a utility func-tion to these strategies did not improve on the performance. Also, adding a utility function increased the number of it-eration necessary in both the no bias and decreasing bias conditions. 0 0.2 0.4 0.6 0.8 1 1.2 1.4 1.6 1.8 2 0.5 0.6 0.7 0.8 0.9 1
Ratio of Modal Distance
wi
Ratio of Modal Distance vs Weighting Coe cient MOP2
MOP3 MOP7
Less Optimal More Optimal
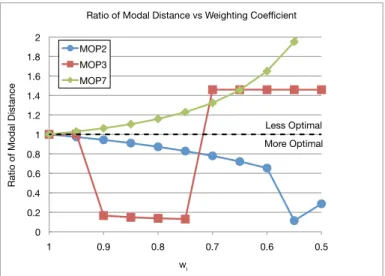
Figure 3. Ratio of the Modal Distance vs. Weighting Coefficient: graph presents the ratio of the mode of the normalized Euclidean distance to the Pareto Frontier for the tested weighting coefficient to the mode of the normalized Euclidean distance to the Pareto Frontier in the unweighted case ddPF,wi
PF,wi=1.
Figure 3 shows the ratio of the dPF for the tested weighting coefficient to dPFfor the unweighted case w1= 1 for several example test problems under the static bias con-dition b = 1.3. This ratio can be used to demonstrate whether there is an advantage to using the utility func-tion. If this distance ratio is less than 1, or beneath the red dashed line, the system reached a more optimal solu-tion in the weighted case. Lower values correspond with more optimal solutions compared to the unweighted case. Values above 1, or above the red dashed line, show the sys-tem performed less optimally at that weighting coefficient. Multi-Objective Problems 2, 3, and 7 from Coello, et al.’s test suite (MOP2, MOP3, and MOP7) were chosen as rep-resentative problems as they illustrate the different types of
0 0.2 0.4 0.6 0.8 1 1.2 1.4 1.6 1.8 2 0.5 0.6 0.7 0.8 0.9 1 Iteration Ratio wi
Iteration Ratio vs Weighting Coe cient MOP6
MOPC1 MOPC3
More Iterations Fewer Iterations
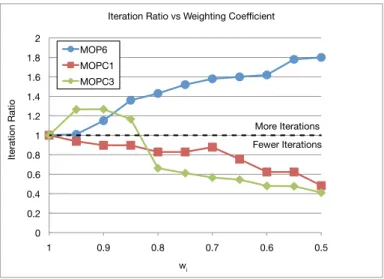
Figure 4. Iteration Ratio vs. Weighting Coefficient: graph presents the ratio of the average number of iterations for the tested weighting coeffi-cient to the average number of iterations in the unweighted caseiteriterwi
wi=1
behavior exhibited by the test problems. When designers had increasing shared incentives (x-axis of Figure 3), three different behaviors were observed: decrease in optimality (MOP7), both decrease and increase in optimality (MOP3), and increase in optimality (MOP2).
As seen in Figure 3, MOP2 reaches a more optimal solution for every tested weighting coefficient. It reaches the most optimal solution for the weighting coefficients w1= 0.55, w2= 0.45. Seven of the 15 test problems be-haved this way. MOP7 always performs worse with weight-ing coefficients than in the unweighted case. In fact the edge case, w1= w2= 0.5 is off the chart in the less opti-mal direction. Four of the test problems behaved this way. MOP3 is an interesting result in that the system performs better for weighting coefficients between w1 = 0.95 and w1= 0.7, and worse for w1< 0.7 Three problems behaved this way. In one of the test problems (DTLZ6) the system optimality was unaffected by changes in the weighting co-efficient.
Figure 4 shows the ratio of the number of iterations until the stopping condition for the tested weighting coeffi-cient to the number of iterations for the unweighted objec-tive function. Similarly, a value above 1, or above the red dashed line, indicates worse performance, and below 1 or the line indicates improved performance. Three different behaviors were observed: decrease in iterations (MOPC1), both decrease and increase in iterations (MOPC3), and
in-crease in iterations (MOP6).
For example, MOP6 always takes more iterations when using a utility function. Seven of the test problems were in this group. MOPC1 always takes fewer iterations to con-verge for all weighting coefficients. Only two of the test problems exhibited this behavior. MOPC3 takes more iter-ations for weighting coefficients in between w1= 0.95 and w1= 0.85 and then fewer iterations for the rest of the tested utility functions. MOP3 was the only other test problem to take longer on average for some weighting coefficients and then improve for others. In four cases the speed is unaf-fected by weighting coefficients.
5 Discussion
The results presented here demonstrate that using util-ity functions as the subsystem objective function does have an effect on system behavior given biased information pass-ing. In 10 of the 15 test problems, overall system perfor-mance improved when the subsystems consider the per-formance of the other subsystem. This suggests that fur-ther study of this incentive structure on real-world prob-lems with human designers would be worthwhile. A key question is how to determine the best weighting for a given problem. The simulations suggest that there is not a gen-eralizable direction for choosing a weighting as the opti-mal weighting is sensitive to the test problem characteris-tics and this would be especially true for real-world prob-lems. Literature has suggested tools for finding regions of greatest attraction when estimating other subsystem behav-ior [25]. The results from this study suggests that a sim-ilar approach may be beneficial for mitigating the effects of biased information passing. For example, system inte-grators could choose the weighting dynamically based on past system performance, as in the adaptive weighted-sum approach from MDO [48].
The results from this study highlight an interesting tradeoff between additional system-level information and sequential optimization. Giving the subsystems informa-tion in their objective funcinforma-tion about the overall system of-ten improved system optimality. However, given that the subsystems only minimized along their design parameters, the system performance was negatively effected in several of the test problems as they got stuck in local minima when considering both subsystems at each subsystem iteration.
also increased system sensitivity to initial conditions. In many of the test problems, the unweighted case converged to a single solution regardless of the starting point. In the weighted cases, a larger set of the system solutions was found. This may be due to the interaction between the weighting and sequential optimization. This is further ev-idence that determining the correct set of weighting coef-ficients is crucial to system performance in this incentive structure.
The number of iterations was either unaffected or in-creased with the introduction of weighted utility functions in the majority of test problems. This was likely due to several factors. First, the additional information may make the problems more difficult to solve resulting in more it-erations. Subsystems which compromise but are unable to control all design variables are likely to take smaller steps in the optimal direction. Finally, in real-world tasks, a mul-tidisciplinary team would require additional engineering resources at the subsystem level to understand additional information from outside of the subsystem’s expertise. This would likely increase the time needed for each iteration as well as the overall time to project completion.
Several limitations exist for this study. First, the in-centive structure may affect subsystem behavior in several ways. One way is to consider the other subsystem perfor-mance when making design decisions. This is modeled in this study by the utility functions. However, this as-sumes that subsystems can accurately access information about the other subsystem and have the necessary knowl-edge to process this information. The degree to which this assumption is accurate depends on the skills within the sub-systems and the connection between the subsub-systems. If the subsystems have previously worked closely together on projects this may be a good assumption. Subsystems may change their behavior in other ways, such as reduc-ing the bias in their information, perhaps switchreduc-ing to other negotiation tactics. Although this is not modeled in this simulation, this would be a desirable outcome as the bi-ased information passing strategy has been shown to be sub-optimal. Secondly, these simulations were performed on well-formulated test problems. These do not necessar-ily reflect the behavior of real-world problems. The sub-system models, or objective functions, also do not change with time as they would in real-world problems. Addition-ally, using the mode of the final system results to define system behavior may introduce errors in the test problems
with concave Pareto Frontiers. Literature has shown that linear utility functions may not realize or converge to the Pareto Frontier in these cases [31]. This was shown in the greater sensitivity to initial conditions of the results for test problems with concave Pareto Frontiers. Finally, this study presents results from a two-player case. Real systems have many more subsystems and the negotiations would be be-tween multiple subsystems. Results from this study suggest that it is worthwhile to explore this incentive structure for larger systems.
6 Conclusions and Future Work
Previous work in subsystem decision-making has demonstrated that subsystem designers in some organiza-tions use biased information passing as a negotiation tactic. This tactic can lead to sub-optimal results. Previous re-search also found that this negotiation happens at an infor-mal level between subsystem designers and is not affected by the formal conflict resolution processes in place. This study proposes an incentive structure based on weighted-sum approaches from MDO which evaluates subsystem performance based on a weighted sum of all subsystems. Results from simulations of biased information passing within this structure were used to answer the following re-search questions.
1. What is the effect of biased information passing on system-level optimality in a complex system with a weighted incentive structure?
Simulations suggest that the optimality of systems whose subsystems are using a biased information pass-ing strategy but are considerpass-ing the other subsys-tems performance can be improved depending on the weighting coefficients. However, this is problem spe-cific and several test problems converged to less opti-mal solutions. Also, the sensitivity to inital conditions was increased which may lead to sub-optimal results in real-world problems.
2. What impact might these strategies have on the speed of system optimization?
The number of iterations used in the simulations was negatively affected by the introduction of utility func-tions in most of the test problems. Additionally, in a real-world task, considering the performance of the
other subsystem would use up engineering resources and would likely increase the time needed for each iter-ation as well as the overall time to project completion.
6.1 Future Work
This study paints a road map for influencing informal negotiations in complex system design teams. Although re-sults from simulations suggest the proposed incentive struc-ture may be more robust to biased information passing, further study is needed to determine what effects new in-centive structure will have an real design teams. Future work will include simulations of larger teams and experi-ments with human design teams. It will also include mod-eling different incentive structures, such as implementing mandatory formal conflict resolution processes randomly throughout the larger team hierarchy.
ACKNOWLEDGMENTS
We gratefully acknowledge the support of this work by the University of Alabama at Huntsville System En-gineering Consortium. The work was also supported in part by a Graduate Research Fellowship from the National Science Foundation. We would also like to acknowledge the insightful comments and guidance from Dr. Tomonori Honda. The opinions, findings, conclusions and recom-mendations expressed are those of the authors and do not necessarily reflect the views of the sponsors.
REFERENCES
[1] de Weck, O.L. and M.B. Jones. (2006). “Isoperfor-mance: Analysis and Design of Complex Systems with Desired Outcomes.” Systems engineering, 9(1), 45-61.
[2] Simon, H.A. (1973). The structure of ill structured problems. Artificial Intelligence, 4(3-4), 181-201. [3] Parkin, K. L. G., Sercel, J. C., et al. (2003). Icemaker:
an excel-based environment for collaborative design. In Proceedings of IEEE Aerospace Conference, IEEE Publications. paper 1564.
[4] Ledyard,J.,Porter,D. and R. Wessen (2000). “A Market-based Mechanism for allocating Space Shut-tle Secondary Payload Priority. Experimental Eco-nomics 2(3),173-195.
[5] Simpson, T. W., J. D. Poplinski, et al. (2001).
“Meta-models for Computer-based Engineering Design: Sur-vey and recommendations.” Engineering with Com-puters 17(2): 129-150.
[6] Sobieszczanski-Sobieski, J. and R. T. Haftka (1997). “Multidisciplinary Aerospace Design Optimization: Survey of Recent Developments.” Structural and Mul-tidisciplinary Optimization 14(1): 1-23.
[7] Austin-Breneman, J., Yu, B. Y., and Yang, M. C. (2014) Biased Information Passing Between Sub-systems Over Time in Complex System Design, 2014 ASME Design Engineering Technical Conferences. [8] J. F. Nash (1951). “Non-Cooperative Games. ” Annals
of Mathematics, 54, pp. 286-295.
[9] Vincent,T.L. (1983). “Game Theory as a Design Tool.” Journal of Mechanism, Transmissions, and Au-tomation in Design 105: 165-170.
[10] K. Lewis (1996). An Algorithm for Integrated Sub-system Embodiment and System Synthesis. PhD the-sis, Georgia Institute of Technology.
[11] Whitfield,R. I. , Duffy, R. I., et al. (2002). “Distributed design coordination.” Research in Engineering De-sign 13: 243-252.
[12] G. A. Hazelrigg (1998). “A framework for decision-based engineering design.” Journal of Mechanical De-sign 120: 653-658.
[13] Chanron, V. and K. Lewis (2005). “A study of conver-gence in decentralized design processes.” Research in Engineering Design 16(3):133-145.
[14] Chanron, V., Singh, T. and K. Lewis (2005). “Equilib-rium stability in decentralized design systems.” Inter-national Journal of Systems Science 36(10):651-662. [15] Xiao, A., Zheng, S., and et al. (2005).
“Collabora-tive Multidisciplinary Decision Making using Game Theory and Design Capability Indices.” Research in Engineering Design 16(1-2):57-72.
[16] Gurnani, A. P., and K. Lewis (2008) “Using Bounded Rationality to Improve Decentralized Design.” AIAA Journal 46(12): 3049-3059.
[17] Lewis, K. E., Chen, W. and L. C. Schmidt (2006). De-cision Making in Engineering Design. American So-ciety of Mechanical Engineers.
[18] Martins, J.R.R, and A. Lambe.(2012). “Multidisci-plinary Design Optimization: A Survey of Architec-tures.” AIAA Journal, 1-53.
[19] Yi, S., J. Shin, et al. (2008). “Comparison of MDO methods with mathematical examples.” Structural and
Multidisciplinary Optimization 35(5): 391-402. [20] Honda, T., F. Ciucci, et al. (2010). “A Comparison
of Information Passing Strategies in System Level Modeling.” International Design Engineering Techni-cal Conferences. Montreal, Canada.
[21] Gu, X., Renaud, J. et al. (2000).“Worst case propa-gated uncertainty of multidisciplinary systems in ro-bust design optimization.” Structural and Multidisci-plinary Optimization, 20(3), 190-213.
[22] Ciucci, F., Honda, T., et al.(2012). “An information-passing strategy for achieving Pareto optimality in the design of complex systems.” Research in Engineering Design, 23(1), 71-83.
[23] Lewis, K. and F. Mistree (1997). “Modeling Interac-tions in Interdisciplinary Design: A Game Theoretic Approach.” AIAA Journal 35(8): 1387-1392.
[24] P. Collopy (2001). “Economic-based Distributed Op-timal Design.” AIAA SPACE 2001 Conference and Exposition. Albuquerque, NM
[25] Kalsi, M., Hacker, K., et al.(2001).“A comprehensive robust design approach for decision trade-offs in com-plex systems design.” Journal of Mechanical Design, 123, 1.
[26] Yassine A., Joglekar N., Braha, D., Eppinger S., and Whitney, D.(2003).“Information Hiding in Product Development: The Design Churn Effect.”’ Research in Engineering Design. Vol. 14(3). 131-144.
[27] Klein, M., Sayama, H., Faratin, P., and Bar-Yam, Y. (2003). The dynamics of collaborative design: insights from complex systems and negotiation re-search. Concurrent Engineering, 11(3), 201-209. [28] Di Marco, M.K., Taylor, J.E. et al. “Emergence and
Role of Cultural Boundary Spanners in Global Engi-neering Project Networks.”’
[29] Smith, R.P., Eppinger, S.D. (1997). “Identifying con-trolling features of engineering design iteration.”’ Management Science, 43 (3), pp. 276-293.
[30] Yassine, A. and Braha, D. (2003).“ Complex Concur-rent Engineering and the Design Structure Matrix proach.”’ Concurrent Engineering: Research and Ap-plications. Vol. 11 (3). 165-177.
[31] Coello Coello, C. A., Lamont, G. B., et al. (2007). Evolutionary algorithms for solving multi-objective problems. Springer, New York, NY.
[32] Deb, K., Thiele, L., et al.(2005). Scalable test prob-lems for evolutionary multiobjective optimization.
Springer, London, UK.
[33] Takamatsu, T., Hashimoto, I. and H. Ohno.(1970) “Optimal Design of a Large Complex System from the viewpoint of Sensitivity Analysis.” Ind. Eng. Chem. Process Des. Develop., 9(3), 368-379.
[34] Thunnissen, D.P. (2004). “Method for Determining Margins in Conceptual Design.” Journal of Spacecraft and Rockets, 41(1), 85-91.
[35] Eckert, C., Isaksson, O., and C. Earl(2014). “De-sign Margins as a Key to Understanding De“De-sign Iter-ation.”2014 ASME International Design Engineering Technical Conferences.
[36] Sentz, K. and S. Ferson. (2011). “Probabilistic bound-ing analysis in the Quantification of Margins and Un-certainties.” Reliability Engineering & System Safety, 96(9), 1126-1136.
[37] Helton, J. (2011). “Quantification of margins and un-certainties: Conceptual and computational basis.” Re-liability Engineering & System Safety, 96(9), 976-1013.
[38] Wang, G. G., and Shan, S. (2007). Review of meta-modeling techniques in support of engineering design optimization. Journal of Mechanical Design, 129(4), 370-380.
[39] Van Houten, F. J. A. M., and Kimura, F. (2000). The virtual maintenance system: a computer-based sup-port tool for robust design, product monitoring, fault diagnosis and maintenance planning. CIRP Annals-Manufacturing Technology, 49(1), 91-94.
[40] Wang, L., Shen, W., Xie, H., Neelamkavil, J., and Par-dasani, A. (2002). Collaborative conceptual design-state of the art and future trends. Computer-Aided De-sign, 34(13), 981-996.
[41] Jarke, M., Loucopoulos, P., Lyytinen, K., Mylopou-los, J., and Robinson, W. (2011). The brave new world of design requirements. Information Systems, 36(7), 992-1008.
[42] Verdonck, E., Weytjens, L., Verbeeck, G., and Froyen, H. (2011). Design Support Tools in Practice. The Ar-chitects’ Perspective. In CAAD Futures. Chicago [43] Kicinger, R., Arciszewski, T., and De Jong, K. A.
(2005). ”Emergent Designer: An integrated research and design support tool based on models of complex systems.” International Journal of Information Tech-nology in Construction, 10, 329-347
multidisciplinary optimization techniques applied to a reusable launch vehicle.” Journal of Spacecraft and Rockets, 43(6), 1289-1300.
[45] Ancona, D.G., Kochan, T. A., Van Maanen, J., Kochan, T. A., Van Maanen, J., Scully, M. A., Westney, D. E., and Kolb, D. M. (2005). Managing for the future: organizational behavior & processes. Thomson/South-Western.
[46] Nadler, D., and Tushman, M. (1997). Competing by design: The power of organizational architecture. Ox-ford University Press.
[47] Pat-Cornell, M. E. (1990). Organizational Aspects of Engineering System. Safety Science, 250, 1210-16. [48] Kim, I.Y., and de Weck, O.L. (2005).”Adaptive
weighted-sum method for biobjective optimization: Pareto front generation.” Structural Multidisciplinary Optimization, 29, 149-158.