HAL Id: hal-02126148
https://hal.archives-ouvertes.fr/hal-02126148
Submitted on 10 May 2019
HAL is a multi-disciplinary open access
archive for the deposit and dissemination of
sci-entific research documents, whether they are
pub-lished or not. The documents may come from
teaching and research institutions in France or
abroad, or from public or private research centers.
L’archive ouverte pluridisciplinaire HAL, est
destinée au dépôt et à la diffusion de documents
scientifiques de niveau recherche, publiés ou non,
émanant des établissements d’enseignement et de
recherche français ou étrangers, des laboratoires
publics ou privés.
POINT CLOUD SEGMENTATION AND SEMANTIC
ANNOTATION AIDED BY GIS DATA FOR
HERITAGE COMPLEXES
Arnadi Murtiyoso, Pierre Grussenmeyer
To cite this version:
Arnadi Murtiyoso, Pierre Grussenmeyer. POINT CLOUD SEGMENTATION AND SEMANTIC
ANNOTATION AIDED BY GIS DATA FOR HERITAGE COMPLEXES. 8th International
Work-shop 3D-ARCH ”3D Virtual Reconstruction and Visualization of Complex Architecture”, Jan 2019,
Bergamo, Italy. pp.523-528, �10.5194/isprs-archives-XLII-2-W9-523-2019�. �hal-02126148�
POINT CLOUD SEGMENTATION AND SEMANTIC ANNOTATION AIDED BY GIS
DATA FOR HERITAGE COMPLEXES
A. Murtiyoso* and P. Grussenmeyer
Photogrammetry and Geomatics Group, ICube Laboratory UMR 7357, INSA Strasbourg, France – (arnadi.murtiyoso, pierre.grussenmeyer)@insa-strasbourg.fr
Commission II
KEY WORDS: Point Cloud, Segmentation, Semantic, GIS, Heritage Complex, Automation
ABSTRACT:
Point cloud segmentation is an important first step in categorising a raw point cloud data. This step is necessary in order to better manage the data and generate other derivative products, e.g. 3D GIS or HBIM. The idea presented in this paper involves the use of 2D GIS to help in the segmentation, classification, as well as (early) semantic annotation of the point cloud. This derives from the fact that in the case of heritage complex sites, often times the site has been previously documented in a 2D GIS often with attributes and entities. We used this 2D data to help in the segmentation of a 3D point cloud, with the added benefit of automatic extraction and annotation of the related semantic information directly to the segmented clusters. Results show that the developed algorithm performs well with TLS data of spread out heritage sites, with a median success rate of 93% and an average rate of 86%. While manual intervention is still inevitable in some parts of the workflow (e.g. creation of the base shapefiles and choice of object segmentation order), the developed algorithm has shown to significantly reduce overall processing time and resources required in terms of segmentation and semantic annotation of a point cloud in the case of heritage complexes.
*
Corresponding author
1. INTRODUCTION
The segmentation of unorganised point cloud data is a much studied research theme, which stems partly from the needs of the remote sensing community to classify aerial LIDAR data. The developments in photogrammetry and particularly dense matching meant that 3D aerial point cloud can now be obtained for larger scale objects via the use of UAVs (Chiabrando et al., 2015; Murtiyoso et al., 2016). For heritage sites in the scale level of complexes with several objects spread out in a small area, documentation is often performed using a combination of aerial and terrestrial techniques (Grenzdörffer et al., 2015; Murtiyoso et al., 2018). This provides a better level of point cloud resolution than simple aerial data as well as coverage of more difficult angles. While this gives a winning solution to completely record a heritage site, it also adds to the complexity of the segmentation. This further increases the need for the automation of point cloud segmentation. Furthermore, while many in the literature focuses on the segmentation and classification of aerial point cloud into certain generic classes (e.g. ground, buildings, vegetation, etc), the field of heritage documentation often requires various different semantic attributes (e.g. historical information, architectural styles, etc.) to be stored (Drap et al., 2017). In many occasions these semantic attributes are often already stored in the form of 2D Geographical Information Systems (GIS). The idea behind this research is to use these pre-existing GIS data in helping the point cloud segmentation process, while in the same time performing the annotation of the attributes of each GIS layer field onto the segmented point cloud. This will facilitate further processes down the workflow pipeline, such as the creation of 3D GIS and HBIM (Heritage Building Information Models).
2. RELATED WORK
The documentation of heritage objects has been addressed in a lot of literature. Nowadays, the use of image-based (e.g. photogrammetry) and range-based techniques is very common (Remondino, 2011) and may even be complementary to each other. Within the spatial scale of a heritage complex site, the use of (2D) GIS for site management is also common place, as is indicated in several publications (Fabbri et al., 2017; Fletcher et al., 2007; Seker et al., 2010). GIS enables the annotation of semantic aspect such as historical, social, and cultural information into the geometric data (Fletcher et al., 2007). This in turn enables GIS to become a powerful tool for heritage site management, where spatial analysis is made possible. One of the widely used format for GIS data is the ESRI shapefile (.shp) format (Bedford, 2017; Kastuari et al., 2016).
The most natural approach when addressing geospatial data from a heritage complex site is the use of aerial data. As regards to the segmentation of aerial-based point cloud, the most basic segmentation involves the extraction of ground and non-ground points. This has been done, amongst others, by creating an approximate surface of the DEM (Digital Elevation Model) (Zhang et al., 2016) or by the use of deep learning technique in order to teach the algorithm to recognise ground characteristics (Rizaldy et al., 2018).
To further segment the non-ground points, a region-growing segmentation may be implemented (Omidalizarandi and Saadatseresht, 2013). Another study performed normal analysis or tensor voting to determine man-made objects in an aerial point cloud (Kim and Medioni, 2011). These approaches have some limitations, especially when dealing with an object the scale of a heritage complex site with high resolution point cloud from heterogeneous sources. A naïve region-growing method
The International Archives of the Photogrammetry, Remote Sensing and Spatial Information Sciences, Volume XLII-2/W9, 2019 8th Intl. Workshop 3D-ARCH “3D Virtual Reconstruction and Visualization of Complex Architectures”, 6–8 February 2019, Bergamo, Italy
applied to such datasets would require enormous resources, while a normal analysis may encounter problems with heterogeneous objects. Another approach (Liu et al., 2018) suggested using 2D vectorial GIS data to aid the segmentation, but lacks the semantic annotation part and was performed on a projected 2.5D point cloud. A similar approach was also used in segmenting 2D aerial images (Kaiser et al., 2017).
The region-growing algorithm may also be used to perform segmentation and classification in larger scale objects (Bassier et al., 2017a; Spina et al., 2011). Other approaches may also use machine learning in the image space (Grilli et al., 2018) or 3D object space (Bassier et al., 2017b). After the classification step is completed, semantic information still needs to be annotated to each segmented part in order to create a semantically rich point cloud (Poux et al., 2017).
The objective of this paper is to benefit from the often pre-existing 2D GIS data in the heritage documentation domain in aiding the segmentation, classification, and semantic annotation of 3D point cloud simultaneously. The existing shapefiles’ geometric data will be used to guide the segmentation, while annotation of the semantic data from the shapefile attribute will be performed concurrently.
3. PROPOSED METHOD
The proposed approach uses 2D GIS layers in the form of the commonly used ESRI shapefiles. These shapefiles contain 2D overhead vectorial representations of objects within the heritage complex, each with its own semantic attributes stored inside the file’s database part. In some cases, these shapefiles may already exist. In other cases where a 2D GIS of the site has not been developed, the shapefiles can be obtained from simple digitisation. This may be performed based on existing topographical maps, online maps, or from orthophotos generated by photogrammetry. The 3D point cloud may be obtained using any kind of tools; including laser scanning, photogrammetry, or a combination of these techniques. The point cloud should be georeferenced to the same system as the GIS, which often times translates into the common national projection coordinate system. This procedure is well integrated in the classical heritage documentation workflow. However, in the case of the impossibility of an absolute georeferencing, a preliminary 3D transformation may also be performed beforehand. The proposed approach is developed in MATLAB R2018a using its Computer Vision Toolbox.
The first step in the workflow involves the extraction of the ground. This approach used the Cloth Simulation Filtering (CSF) method (Zhang et al., 2016) to extract the ground. Each polygonal vector in the shapefile was then used to segment the non-ground point cloud, using a “cookie-cutter” approach.
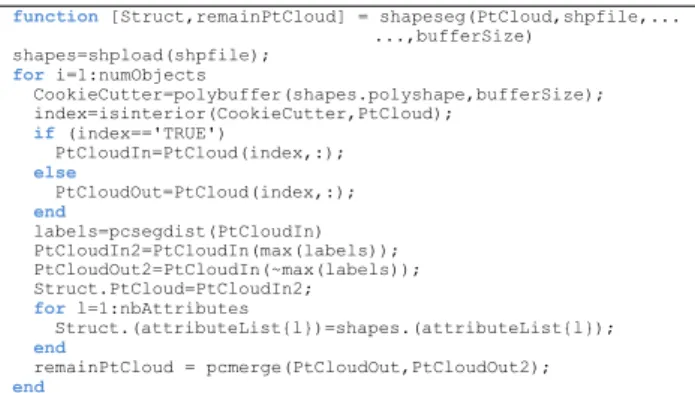
function [Struct,remainPtCloud] = shapeseg(PtCloud,shpfile,... ...,bufferSize) shapes=shpload(shpfile); for i=1:numObjects CookieCutter=polybuffer(shapes.polyshape,bufferSize); index=isinterior(CookieCutter,PtCloud); if (index=='TRUE') PtCloudIn=PtCloud(index,:); else PtCloudOut=PtCloud(index,:); end labels=pcsegdist(PtCloudIn) PtCloudIn2=PtCloudIn(max(labels)); PtCloudOut2=PtCloudIn(~max(labels)); Struct.PtCloud=PtCloudIn2; for l=1:nbAttributes Struct.(attributeList{l})=shapes.(attributeList{l}); end remainPtCloud = pcmerge(PtCloudOut,PtCloudOut2); end
Figure 1. Pseudocode of the developed algorithm.
Figure 1 displays the pseudocode of the proposed segmentation algorithm used at the aftermath of the ground extraction process, as written in the function shapeseg. Each shapefile represents one object class. Since both the GIS and the point cloud are already in the same coordinate system, this would effectively create a bounding box in the form of the shapefile vector for the object in the point cloud, from which a segmented portion is extracted. A buffer area threshold was introduced to the 2D vectors in order to provide a tolerance with regards to digitising or georeferencing precision. This ensures that the algorithm will still be able to extract the object even if the digitising was not very precise. Since the algorithm uses a “cookie-cutter” approach, all points of all altitude values within the bounding box were therefore segmented. This may cause some problems when some objects overlap or are stacked with each other. For example, the existence of a tree crown above a building roof would mean that the segmented point cloud also includes a part of the tree crown. This problem was addressed by performing another consequent segmentation algorithm on the previously segmented point cloud.
A region growing algorithm was implemented in this case to extract the point cloud clusters. A filtering was then performed to exclude any remaining noise, and the largest cluster was taken as the most probable object of interest. The excluded points were, however, not deleted. Rather, they were remerged with the remaining unclassified point cloud, to be used in the next iteration of the algorithm. In this regard, overlapped or stacked point clouds may be extracted individually without losing parts of each object’s data. The next iteration will then use the remaining point cloud to perform the computation, thereby reducing the size of the processed data with each iteration count. Finally, as the 2D vector geometry was taken from the shapefile, the associated attribute fields may be annotated directly to the segmented point clouds. This ensures that all the attributes of the 3D object as recorded in the 2D GIS is stored within the structure of each segmented point cloud. The function will therefore generate, as an output, a structure for each class which consists of the different objects (records or instances in the shapefile database). These objects themselves are also structures in which the segmented point cloud and attributes are stored. The function also gives as an output the remaining unsegmented data, which can then be used as input for the further segmentation of other shapefile classes by reiterating the function.
4. RESULTS AND DISCUSSIONS
An experimental trial was conducted using the dataset from the Siti Inggil complex of the Kasepuhan Palace, Cirebon, Indonesia (Murtiyoso et al., 2018). This area dated to the 13th century and includes several historical pavilions within its 1,200 m2 brick-walled perimeters. Heavy vegetation was also present
within Siti Inggil, often overlapping with the buildings. The site was digitised in May 2018 using a combination of terrestrial laser scanner (TLS) and photogrammetry (both terrestrial and UAV), and was georeferenced to the Indonesian national projection system. As part of the preliminary data acquisition, a UAV flight was conducted to obtain the global view of the site. A rough 2D GIS was therefore acquired by digitising the resulting orthophoto map into three layers (buildings, walls, and gates) for the purpose of this experiment. The original point cloud dataset consisted of 10.4 million points (Figure 2), and were segmented into four classes (the three layers and the ground) and 13 different annotated objects in about 10 minutes using an Intel(R) Xeon(R) E5645 2.4 GHz CPU.
The International Archives of the Photogrammetry, Remote Sensing and Spatial Information Sciences, Volume XLII-2/W9, 2019 8th Intl. Workshop 3D-ARCH “3D Virtual Reconstruction and Visualization of Complex Architectures”, 6–8 February 2019, Bergamo, Italy
Figure 2. The unorganised and unclassified point cloud used as input for the algorithm.
Figure 3. The GIS shapefile data used in aiding the segmentation process. Three classes of interest are shown here
superposed on the orthophoto image.
Figure 4. Result of the segmentation and semantic annotation process for each object for the class “WALLS”.
Figure 5. Result of the segmentation and semantic annotation process for each object for the class “GATES”.
The International Archives of the Photogrammetry, Remote Sensing and Spatial Information Sciences, Volume XLII-2/W9, 2019 8th Intl. Workshop 3D-ARCH “3D Virtual Reconstruction and Visualization of Complex Architectures”, 6–8 February 2019, Bergamo, Italy
Figure 6. Result of the segmentation and semantic annotation process for each object for the class “BUILDINGS”.
Object Number of Points Misclassified
Manual Auto Overclassified Unclassified % Unclassified BUILDINGS1 703 500 680 386 10 592 33 706 4.79 BUILDINGS2 643 350 633 897 6 630 16 083 2.50 BUILDINGS3 317 459 300 283 9 873 27 049 8.52 BUILDINGS4 58 532 60 838 8 296 5 990 10.23 BUILDINGS5 52 026 58 047 7 415 1 394 2.68 GATES1 101 196 95 754 4 017 9 459 9.35 GATES2 151 040 146 133 4 955 9 862 6.53 WALLS1 216 951 151 520 683 66 114 30.47 WALLS2 417 768 351 818 3 168 69 118 16.54 WALLS3 84 516 81 520 5 762 8 758 10.36 WALLS4 64 877 56 804 4 595 12 668 19.53 WALLS5 63 014 34 752 1 814 30 076 47.73 WALLS6 177 399 175 862 13 371 14 908 8.40 Mean 13.66 Median 6.53 Table 1. Segmentation statistics for the 13 object clusters of interest (trees are not included). The GIS shapefile data shown in Figure 3 was used to aid the
segmentation process. The shapeseg function was then subsequently employed for each shapefile class, while taking into account the order of which shapefile is processed first. Generally speaking, lower objects were segmented first, moving towards higher objects (see Figure 7). In the case of Siti Inggil, after the classification of the ground using the CSF algorithm, the low brick walls were the first to be processed. This was then followed by the gates and finally the buildings. This ensures that vertically stacked objects (e.g. walls and building roofs or building roofs and trees) are segmented correctly and avoids ambiguity during the region growing step. Since the remaining point cloud from the previous processing is used in the next iteration, the combination of “cookie-cutter” style of segmentation and region growing was able to properly segment stacked parts of the input point cloud. This also results in a faster processing, since the input point cloud becomes smaller as the programme proceeds, instead of using the original point cloud as an input for all shapefile layer segmentation.
Results show that the developed approach was successful in segmenting the Siti Inggil area and annotating each segmented portion with the relevant semantic information, even by using roughly digitised shapefiles (centimetric precision). The results for the first use of the algorithm on the walls class is shown in Figure 4. Most of the walls were segmented correctly, except for the object WALLS5 where a large part of it was considered by the algorithm as another object altogether. This may have been due to the low resolution of the TLS on this particular part of the wall, as the critical junction that caused the segmenting failure is found behind a tree. Only two objects are present within the gates class (Figure 5), and the algorithm seems to have been able to perform the segmentation correctly. Five buildings are included in the buildings class (Figure 6), all of which were segmented properly. BUILDINGS4 and 5 showed a small portion of ground point cloud still included in their respective clusters; this is due to the parameterising of the CSF algorithm. In general, smaller buildings yielded slightly worse result in the CSF ground classification, as seen here in the case
The International Archives of the Photogrammetry, Remote Sensing and Spatial Information Sciences, Volume XLII-2/W9, 2019 8th Intl. Workshop 3D-ARCH “3D Virtual Reconstruction and Visualization of Complex Architectures”, 6–8 February 2019, Bergamo, Italy
of BUILDINGS4 and 5. In addition the class ordering is shown to be important to avoid errors in stacked cases. In the case where the buildings are segmented before the lower walls, some parts of the walls were included in BUILDINGS1. Conversely, by segmenting first the lower objects (in this case the walls), the results in both the buildings and walls classes are correct. Although visually the algorithm seemed to have worked, a more quantitative analysis was also performed (Table 1) in order to determine the quality of the proposed method. In Table 1, the number of segmented points is used as a parameter of segmentation quality. Overall, the unclassified rate from all 13 objects yielded an average value of 13.66% and a median value of 6.53%. While this value is seen to be good enough, the quality for each class differs. The buildings class fared the best, with an average unclassified rate of 5.74%. BUILDINGS4 presented the largest error, which is caused by the remaining unfiltered ground around the structure. The gates class fared well enough with an average unclassified rate of 7.94%. The walls class presented the worst results with an average of 22.17%. The poor performance of the algorithm for some objects in the walls class can be explained as cases of statistical outlier; in particular for WALLS5 where a rupture of point cloud resolution caused its division in two clusters where it should have been one. Likewise, WALLS1 was riddled with a lot of point cloud noise mainly at the exterior part. This is due to the presence of flower pots along the wall, which in turn became noises in the segmentation process of the said wall.
Figure 7. A profile of Siti Inggil illustrating the segmented classes and the ordering of the use of the shapeseg function, starting from lower objects to higher ones. Note that the TREES class is not discussed in this paper.
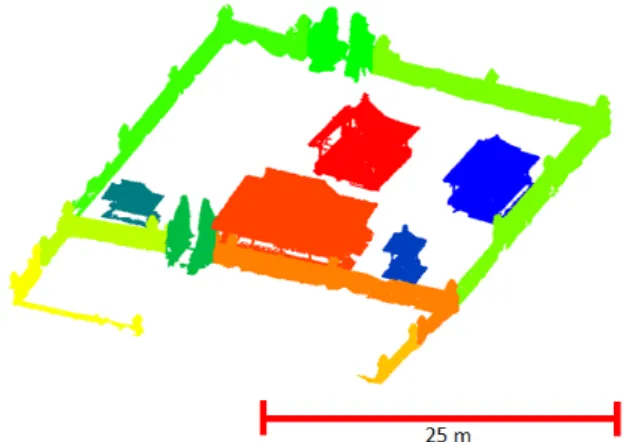
Figure 8. The final output of the algorithm, colour-coded for each segmented object cluster (regardless of class).
Apart from the obvious reasons for outlier data, the walls class does indeed show a systematic trend in its error. The median value of its unclassified rate is 18.04%, which is quite high compared to similar values from the other classes (between 4%-8%). Several aspects can play a role in this regard. First of all, it is quite noticeable that the result of the CSF ground filtering around the walls is quite noisy. This may be due to (i) the uneven ground around the walls, owing to the fact that many tree roots and tall grass are present; and (ii) the small surface area of the walls compared to the buildings. A similar albeit less-evident phenomenon can be seen in the buildings class, where as the object’s ground surface decreases, more unfiltered ground is present. A better parameterising for the CSF algorithm should be studied to try to reduce this error.
Despite these problems, the developed algorithm has managed to segment the Siti Inggil heritage complex rapidly while generating relatively acceptable results. Apart from the shapefile digitising process, the tuning of several parameters, and the choice of the segmenting order, the process was largely automatic.
5. CONCLUSIONS
The approach demonstrated in this paper has shown to be able to perform well in segmenting the 3D point cloud of heritage complexes. The resulting segmented point clouds were relatively clean despite the dense vegetation around the objects of interest. Using this method, each object was segmented individually (Figure 8), but retains a classification according to the input shapefile. Another advantage is that the semantic attribute present in the shapefile database is not lost. This information is annotated automatically to each object cluster, therefore facilitating further work on site management in the form of 3D GIS and/or HBIM.
Some shortcomings are still present, however. The fine tuning of segmentation parameters is important in order to extract the correct objects. This is particularly true for the region growing segmentation parameters for two different objects which superposed closely. The ordering of the class segmentation is also important to avoid clustering ambiguity. As can be seen in Figure 7, various elements of the input data were vertically stacked. The correct iteration ordering, in this case from lower to higher object heights, was essential in segmenting the data correctly. When the ordering is wrong, the region growing segment of the algorithm encounters ambiguities in determining which segmented cluster is part of the desired class. This remains as one of the aspects that require manual human interpretation and intervention.
The ground extraction at the beginning of the algorithm is also an important factor influencing the final product. Indeed, when applying the algorithm to segment the trees class, some residual ground point cloud was still present in the end. This is due to problems such as irregularity of the ground near the trees (presence of grasses, roots, etc.). Although tree extraction is not the main objective of the research, this particular point still merits a further improvement of the algorithm as vegetations can sometimes also be important particularly for environmental analysis. Furthermore, some objects which didn’t have enough points were unpurposely filtered.
Some improvements to the existing algorithm are envisaged, including the fine tuning of the ground filtering process and the inclusion of CAD files as inputs. The inclusion of CAD files is an interesting path to follow, as many heritage buildings also possess CAD files which may be used in this segmentation
The International Archives of the Photogrammetry, Remote Sensing and Spatial Information Sciences, Volume XLII-2/W9, 2019 8th Intl. Workshop 3D-ARCH “3D Virtual Reconstruction and Visualization of Complex Architectures”, 6–8 February 2019, Bergamo, Italy
method. This will mean that this approach can be used not only for heritage complexes, but also for buildings as long as a CAD file is available. The same objective still applies, however. The proposed method aims to segment a 3D point cloud and annotate semantic information at the same time in order to facilitate point cloud management for use further down the workflow pipeline. Another further ongoing work involves the 3D modelling automation of each object of interest, with the objective to aid the creation of 3D GIS and HBIMs.
ACKNOWLEDGEMENT
This research benefits from the Indonesian Endowment Fund for Education (LPDP), Republic of Indonesia. The codes developed for this paper are written in MATLAB but are open source and may be downloaded from the following link:
https://github.com/murtiad/M_HERACLES. REFERENCES
Bassier, M., Bonduel, M., Genechten, B. Van, Vergauwen, M., 2017a. Octree-Based Region Growing and Conditional Random Fields. The International Archives of the Photogrammetry, Remote Sensing and Spatial Information Sciences XLII, 28–29. Bassier, M., Vergauwen, M., Van Genechten, B., 2017b. Automated Classification of Heritage Buildings for As-Built BIM using Machine Learning Techniques. ISPRS Annals of the Photogrammetry, Remote Sensing and Spatial Information Sciences IV-2/W2, 25–30.
Bedford, J., 2017. Photogrammetric Applications for Cultural Heritage. Historic England, Swindon.
Chiabrando, F., Donadio, E., Rinaudo, F., 2015. SfM for orthophoto generation: a winning approach for cultural heritage knowledge, in: The International Archives of the Photogrammetry, Remote Sensing and Spatial Information Sciences XL-5/W7. pp. 91–98.
Drap, P., Papini, O., Pruno, E., Nucciotti, M., Vannini, G., 2017. Ontology-based photogrammetry survey for medieval archaeology: Toward a 3D geographic information system (GIS), Geosciences, 7, 4.
Fabbri, S., Sauro, F., Santagata, T., Rossi, G., De Waele, J., 2017. High-resolution 3-D mapping using terrestrial laser scanning as a tool for geomorphological and speleogenetical studies in caves: An example from the Lessini mountains (North Italy). Geomorphology 280, 16–29.
Fletcher, R., Johnson, I., Bruce, E., Khun-Neay, K., 2007. Living with heritage: Site monitoring and heritage values in Greater Angkor and the Angkor World Heritage Site, Cambodia. World Archaeology 39, 385–405.
Grenzdörffer, G.J., Naumann, M., Niemeyer, F., Frank, A., 2015. Symbiosis of UAS Photogrammetry and TLS for Surveying and 3D Modeling of Cultural Heritage Monuments - a Case Study About the Cathedral of St. Nicholas in the City of Greifswald, in: The International Archives of the Photogrammetry, Remote Sensing and Spatial Information Sciences XL-1/W4. pp. 91–96.
Grilli, E., Dininno, D., Petrucci, G., Remondinoa, F., 2018. From 2D to 3D supervised segmentation and classification for cultural heritage applications, in: The International Archives of the Photogrammetry, Remote Sensing and Spatial Information Sciences XLII-2. pp. 399–406.
Kaiser, P., Wegner, J.D., Lucchi, A., Jaggi, M., Hofmann, T., Schindler, K., 2017. Learning Aerial Image Segmentation from Online Maps. IEEE Transactions on Geoscience and Remote Sensing 55, 6054–6068.
Kastuari, A., Suwardhi, D., Hanan, H., Wikantika, K., 2016. State of the Art of the Landscape Architecture Spatial Data Model From a Geospatial Perspective. ISPRS Annals of the Photogrammetry, Remote Sensing and Spatial Information Sciences IV-2/W1, 20–21.
Kim, E., Medioni, G., 2011. Urban scene understanding from aerial and ground LIDAR data. Machine Vision and Applications 22, 691–703.
Liu, C.-J., Krylov, V., Dahyot, R., 2018. 3D point cloud segmentation using GIS, in: 20th Irish Machine Vision and Image Processing Conference. pp. 41–48.
Murtiyoso, A., Grussenmeyer, P., Koehl, M., Freville, T., 2016. Acquisition and Processing Experiences of Close Range UAV Images for the 3D Modeling of Heritage Buildings, in: Ioannides, M., Fink, E., Moropoulou, A., Hagedorn-Saupe, M., Fresa, A., Liestøl, G., Rajcic, V., Grussenmeyer, P. (Eds.), Digital Heritage. Progress in Cultural Heritage: Documentation, Preservation, and Protection: 6th International Conference, EuroMed 2016, Nicosia, Cyprus, October 31 -- November 5, 2016, Proceedings, Part I. Springer International Publishing, pp. 420–431.
Murtiyoso, A., Grussenmeyer, P., Suwardhi, D., Awalludin, R., 2018. Multi-Scale and Multi-Sensor 3D Documentation of Heritage Complexes in Urban Areas. ISPRS International Journal of Geo-Information 7, 483.
Omidalizarandi, M., Saadatseresht, M., 2013. Segmentation and classification of point clouds from dense aerial image matching. The International Journal of Multimedia & Its Applications 5, 33–51.
Poux, F., Neuville, R., Billen, R., 2017. Point cloud classification of tesserae from terrestrial laser data combined with dense image matching for archaeological information extraction. ISPRS Annals of the Photogrammetry, Remote Sensing and Spatial Information Sciences IV-2/W2, 203–211. Remondino, F., 2011. Heritage recording and 3D modeling with photogrammetry and 3D scanning. Remote Sensing 3, 1104– 1138.
Rizaldy, A., Persello, C., Gevaert, C.M., Oude Elberink, S.J., 2018. Fully Convolutional Networks for Ground Classification from LiDAR Point Clouds, in: ISPRS Annals of Photogrammetry, Remote Sensing and Spatial Information Sciences IV-2. pp. 231–238.
Seker, D.Z., Alkan, M., Kutoglu, H., Akcin, H., Kahya, Y., 2010. Development of a GIS Based Information and Management System for Cultural Heritage Site ; Case Study of Safranbolu, in: FIG Congress 2010.
Spina, S., Debattista, K., Bugeja, K., Chalmers, A., 2011. Point Cloud Segmentation for Cultural Heritage Sites, in: VAST11: The 12th International Symposium on Virtual Reality, Archaeology and Intelligent Cultural Heritage. pp. 41–48. Zhang, W., Qi, J., Wan, P., Wang, H., Xie, D., Wang, X., Yan, G., 2016. An easy-to-use airborne LiDAR data filtering method based on cloth simulation. Remote Sensing 8, 1–22.
The International Archives of the Photogrammetry, Remote Sensing and Spatial Information Sciences, Volume XLII-2/W9, 2019 8th Intl. Workshop 3D-ARCH “3D Virtual Reconstruction and Visualization of Complex Architectures”, 6–8 February 2019, Bergamo, Italy