Publisher’s version / Version de l'éditeur:
Vous avez des questions? Nous pouvons vous aider. Pour communiquer directement avec un auteur, consultez la première page de la revue dans laquelle son article a été publié afin de trouver ses coordonnées. Si vous n’arrivez pas à les repérer, communiquez avec nous à PublicationsArchive-ArchivesPublications@nrc-cnrc.gc.ca. Questions? Contact the NRC Publications Archive team at
PublicationsArchive-ArchivesPublications@nrc-cnrc.gc.ca. If you wish to email the authors directly, please see the first page of the publication for their contact information.
https://publications-cnrc.canada.ca/fra/droits
L’accès à ce site Web et l’utilisation de son contenu sont assujettis aux conditions présentées dans le site LISEZ CES CONDITIONS ATTENTIVEMENT AVANT D’UTILISER CE SITE WEB.
84th Annual Meeting of the Transportation Research Board [Proceedings], 2005
READ THESE TERMS AND CONDITIONS CAREFULLY BEFORE USING THIS WEBSITE.
https://nrc-publications.canada.ca/eng/copyright
NRC Publications Archive Record / Notice des Archives des publications du CNRC :
https://nrc-publications.canada.ca/eng/view/object/?id=34467775-d52c-40fd-9e2a-e820e1234850 https://publications-cnrc.canada.ca/fra/voir/objet/?id=34467775-d52c-40fd-9e2a-e820e1234850
Archives des publications du CNRC
This publication could be one of several versions: author’s original, accepted manuscript or the publisher’s version. / La version de cette publication peut être l’une des suivantes : la version prépublication de l’auteur, la version acceptée du manuscrit ou la version de l’éditeur.
For the publisher’s version, please access the DOI link below./ Pour consulter la version de l’éditeur, utilisez le lien DOI ci-dessous.
https://doi.org/10.4224/20378417
Access and use of this website and the material on it are subject to the Terms and Conditions set forth at
Variations in the composition and rheology of bituminous crack
sealants for pavement maintenance
Masson, J.-F.; Collins, Peter; Bundalo-Perc, Sladana; Woods, John;
Al-Qadi, Imad
Variations in the composition and rheology of
bituminous crack sealants for pavement maintenance
Masson, J-F.; Collins, P.; Bundalo-Perc, S.;
Woods, J.R.; Al-Qadi, I.
NRCC-40324
A version of this document is published in / Une version de ce document se trouve dans: Transportation Research Board, 84th Annual Meeting, Washington, D.C.,
Jan. 9-13, 2005, pp. 1-15
Variations in the composition and rheology
of bituminous crack sealants for pavement maintenance
By J-F. Masson, Peter Collins, Slađana Bundalo-Perc, John R. Woods, Imad Al-Qadi
J-F. Masson
Corresponding author
Institute for Research in Construction
National Research Council of Canada, Ottawa, ON, K1A 0R6, Canada. Tel. (613) 993-2144, Fax (613) 952-8102
E-mail: Jean-Francois.Masson@nrc-cnrc.gc.ca Peter Collins
Institute for Research in Construction
National Research Council of Canada, Ottawa, ON, K1A 0R6, Canada. Tel. (613) 993-9721, Fax (613) 952-8102
E-mail: Peter.Collins@nrc-cnrc.gc.ca Slađana Bundalo-Perc
Institute for Research in Construction
National Research Council of Canada, Ottawa, ON, K1A 0R6, Canada. Tel. (613) 993-3766, Fax (613) 952-8102
E-mail: Sladana.Bundalo-Perc@nrc-cnrc.gc.ca John R. Woods
Institute for Chemical Process and Environmental Technology
National Research Council of Canada, Ottawa, ON, K1A 0R6, Canada. Tel. (613) 993-2520, Fax (613) 991-2384
E-mail: John.R.Woods@nrc-cnrc.gc.ca Imad Al-Qadi
Civil and Environmental Engineering University of Illinois at Urbana-Champaign
Paper submitted for presentation at the 86th Annual Meeting of the Transportation Research Board (2005) and possible publication in the Transportation Research Records
ABSTRACT
Bituminous crack sealants are used for the preventive maintenance of asphalt concrete pavements. The selection of a durable sealant can be difficult, however, mainly because of the lack of correlation between standard sealant specifications and field performance. Hence, approved list of materials based on past performance are sometimes used to select sealants. Notwithstanding, sealant durability and performance vary over time. To investigate the effect of sealant lot variation on sealant properties, six lots of two sealants from different suppliers were analyzed for filler and polymer contents and rheological response. It was found that the difference in composition and rheology between lots can be similar to that between sealants produced by different manufacturers. Hence, sealant lot-to-lot variation can partly explain the variation in the field performance of sealants. Therefore, lists of approved products drawn from the field performance of past years are ineffective for the selection of sealants for future maintenance. The application of segregated sealants was also investigated. In this respect, the effect of melter stirring on sealant homogeneity was assessed and the segregation of sealant upon cooling measured. It was found that sealants do not segregate after their application and subsequent cooling, and that a rapid circumferential stirring of 25 rpm in the heating kettle allowed for the remixing of a segregated sealant.
INTRODUCTION
The performance of the bituminous crack sealants used in pavement maintenance is notoriously variable. Both the application and the materials are blamed for this variation. In a recent publication [1], the effect of the kettle and the variation in sealant application temperature was investigated as a reason for unequal sealant performance. In this paper, the possible variation in sealant properties between sealant lots of an identical product is explored as another possible reason for the variation in sealant performance.
A bituminous crack sealant is a polymer-modified bitumen with a filler that is often ground tire rubber and/or limestone. The polymer is most often a styrene-butadiene-styrene (SBS) block copolymer [2]. The copolymer reduces the thermal susceptibility of bitumen, whereas the filler provides body and improved resistance to wearing.
The stability of a mixture against segregation of its components is governed by thermodynamics [3]. The stability of bitumen-SBS blends was recently reviewed [4]. At high temperatures, an unstable blend slowly segregates into bitumen-rich and SBS-rich phases [4]. In this respect, segregation is the norm and stability is the exception. It is difficult to find stable bitumen-SBS mixtures, and impossible to predict segregation, if any, or the rate and the temperature at which it occurs. Bituminous crack sealants being mostly bitumen-SBS blends produced and installed at high temperatures, the subject of sealant stability is of great practical interest. The segregation of the main sealant components, bitumen, SBS and filler during production or installation could contribute to the
variability in sealant performance.
To address the issue of sealant segregation and stability, and its potential effect on standard testing and field performance, six lots of two sealants were analyzed for copolymer, filler and bitumen contents. In addition, three of the lots were collected in the field to determine the effect of installation on sealant homogeneity.
EXPERIMENTAL PROGRAM
Six lots of two bituminous hot-poured sealants were studied (Table 1). The two sealants were from different manufacturers, and all sealants were purported to meet the ASTM D6690 sealant specification [5]. Three sealant lots were sampled in the field after stirring in 1500 L kettles for several hours by pouring in 20 mm x 20 mm x 500 mm aluminium troughs that simulated a short segment of a routed crack. To ensure representative cooling rates, the troughs were pressed onto 100 mm of fine sand. Table 1 shows the sealant lots that were sampled in the field and the kettle stirring characteristics. These lots were analyzed for segregation by an analysis of the top and bottom of the as-received sealants. The analyses included gel permeation chromatography (GPC) and Fourier transform infrared spectroscopy (FTIR) for measuring the polymer content, and thermogravimetric analysis (TGA) for measuring the filler content. The basis for these methods is well known [2,6,7,8]. The effect of composition on the sealant creep and elastic recovery was measured at –22°C with a dynamic shear rheometer (DSR). The circular sample was 8 mm in diameter and 2 mm thick. Creep was measured over 10 min under a shear load of 1000N, and the creep recovery was measured during an additional 20 min. All sealant lots were also sampled, heated and remixed in the laboratory according to ASTM D5167 [9].
RESULTS AND DISCUSSION Virgin Sealants
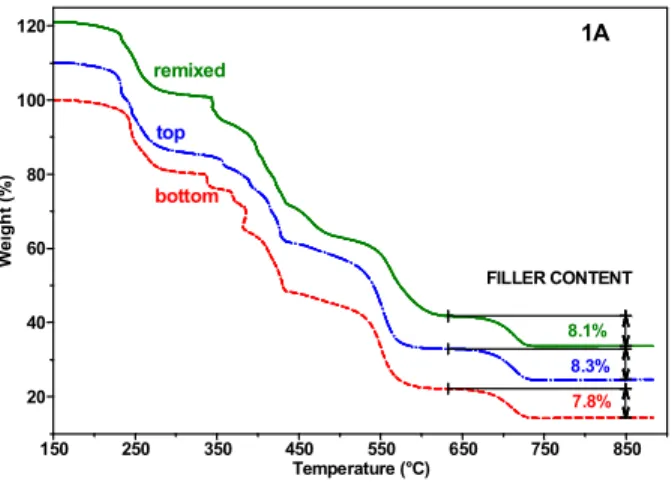
The stability of the sealants against segregation was first assessed by an analysis of the top and bottom of sealants 1A, 2A and 2B and a comparison with remixed material. Figures 1 and 2 show the results of TGA and GPC for sealant 1A. The TGA shows the weight loss when the sealant is heated to 850°C. Below 600°C, the weight loss arises from the volatilization and degradation of the organic material, the bitumen and the SBS. Above 600°C, the weight loss arises from the inorganic material, the filler. For sealant 1A, the top, bottom and remixed sealant had a filler content of 8.3%±0.2%. The filler was thus well dispersed in the as-received material.
The GPC results for sealant 1A revealed four peaks (Figure 2). Bitumen showed as an intense and broad peak centered at 34 min, whereas the copolymer showed a triplet between 19 and 24 min. The overlap of the chromatograms for the top, bottom and remixed samples from sealant 1A indicated that the polymer was evenly
dispersed in this sealant. Hence, from TGA and GPC, it was demonstrated that both the filler and polymer were well dispersed in sealant 1A. In other words, it was homogeneous and showed no sign of segregation.
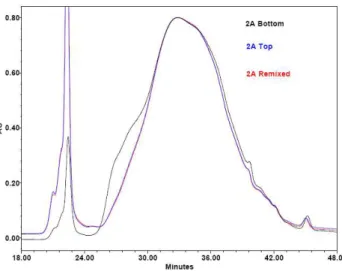
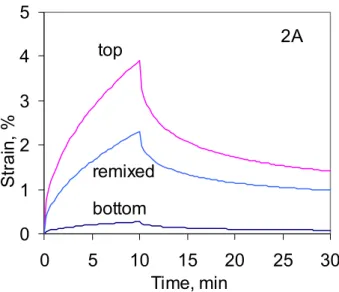
The TGA and GPC results for sealant 2A are shown in Figures 3 and 4. The TGA showed that the top and bottom of the as-received 2A, respectively, contained 2% and 17% filler. The inorganic filler thus had segregated from the modified binder. Similarly, the GPC results showed that the top and bottom of sealant 2A contained different amounts of polymer. This is demonstrated by the difference in the intensity of the polymer peak at 22 min. The top of the sealant contained much more polymer than the bottom. Sealant 2A was thus heavily segregated as the result of the separation of the filler from the modified binder, and from the separation of the polymer from bitumen. The effect of this segregation on the mechanical properties is illustrated by the creep and recovery at – 22°C (Figure 5). The top of sealant 2A had a strain capacity of 4% under the test conditions, whereas the bottom portion of the sealant had a strain capacity of about 0.2%. Hence, the polymer rich moiety had a greater strain capacity, whereas the filler rich portion had a very limited strain capacity. Once the sealant was remixed, the strain capacity fell between those from the top and bottom portions, at about 2.2%.
Bitumimous crack sealants can thus be unstable and segregate, just like polymer modified binders used in hot-mix asphalt [4]. The use and installation of such sealants raise important practical questions: i) is the variation in the composition and rheology of sealant lots important enough that an agency’s list of approved sealants, based on field tests, is rendered ineffective because of the variation in sealants over time? ii) during field application, is the stirring in the kettle rapid enough to allow for the remixing of segregated sealants? iii) to what extent does a sealant poured in a rout segregate during cooling? These issues are addressed below.
Sealant lot-to-lot variation
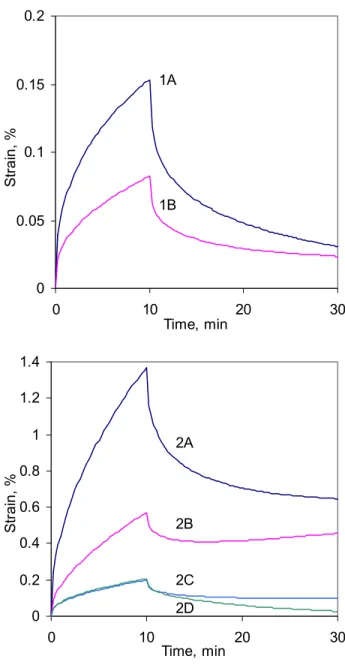
From the earlier results, sealant 1 was found stable and homogeneous, but sealant 2 was not. Hence, other sealant lots were obtained and tested after each lot had been remixed. To illustrate the possible variation in sealant characteristics and performance, the creep and recovery response of various batches at –22 °C were compared. Figure 6 shows that different sealant lots have very different rheological responses during creep and/or recovery. This may result in different field response to stresses during temperature variation. The DSR does not simulate the strains experienced in the field, however, it provides a relative ranking of the strain capacity. In this respect, the response of each tested sealant lot is unique (Figure 6). This helps explain the inconsistent field performance occasionally obtained after adequate sealant installation, and demonstrates the inadequacy for selecting sealants of a pre-approved list. Such a list would be appropriate if producers ensured consistent sealant rheology, lot-to-lot, through compliance with a quality standard, such as ISO 9001:2000 [10] , structured to maintain overall product consistency.
Field Application
A segregated sealant may be rendered homogeneous again by remixing. During application, the kettle mixing system may thus be of importance, as not all kettles are alike (Table 1). Sealant 1A, 2A and 2B were collected at different times during their installation. Sealant 1A was already homogeneous as supplied and no segregation was expected during installation despite its application from a kettle with slow mixing. In contrast, sealants 2A and 2B were segregated to different extents as supplied and, coincidentally, they were applied from kettles with more vigorous stirring than for sealant 1A. Rapid stirring may remix segregated sealants.
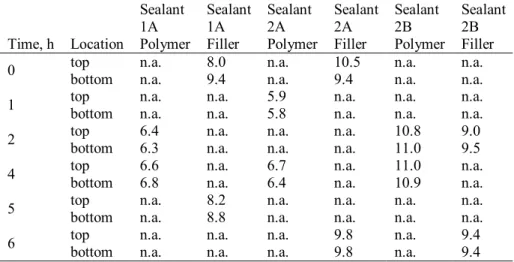
To assess the capacity of a kettle to remix segregated material, sealants collected during installation were analyzed for polymer and filler content, with the expectation that efficient stirring would lead to a constant sealant composition throughout the day. Table 2 shows that the composition of sealant 1A varied very little during installation, as expected from the analysis of the received material. The results also show that the segregated as-received sealants 2A and 2B had a composition that varied within relative narrow limits during installation. This demonstrates that rapid stirring (25 rpm, Table 1) does allow for the remixing of a segregated sealant (2A). Not all kettles have the same stirring capacity, however, and it has yet to be demonstrated that slow stirring can also remix a segregated sealant.
Segregation during Cooling
The stability of blend components is governed by thermodynamics, but the rate of segregation, if any, is governed by viscosity, which increases during cooling. Without stirring, a hot sealant may segregate, but if cooled rapidly, segregation may be prevented due to the rise in viscosity. To verify the extent of segregation in poured sealants, top and bottom samples of the sealants collected in the field (Table 3). The difference in filler content between the top and the bottom of the sealants was <10% in all cases, but one. Moreover, in the samples tested, the polymer at the top of the sealant was consistent with that at the bottom. Hence, the results indicate that sealant segregation immediately after installation is not significant.
CONCLUSIONS AND RECOMMENDATIONS
Different lots from two sealants were analyzed for composition and rheology. It was found that as-received sealants were not always homogeneous. They could be segregated, with the filler being at the bottom of the sealant and the polymer at the top. From field application, it was found that sealants do not segregate after their application and subsequent cooling, and that a rapid circumferential stirring of 25 rpm in the heating kettle allowed for the remixing of a segregated sealant. Not all kettles have the same stirring capacity, however, and it has yet to be demonstrated that slow stirring can also remix a segregated sealant. The homogeneity of applied sealants may be assessed by comparing the composition of two samples collected at the discharge point several hours apart, e.g. ≥5h.
It was also found that sealant properties can differ substantially between lots of the same sealant. This indicates that sealant lot-to-lot variation plays a key role in the fluctuation of sealant field performance. These findings also demonstrate the limited usefulness of a list of pre-approved products to select sealants. It is thus recommended that each sealant lot be tested for conformance with local material specifications, which is common in many jurisdictions.
ACKNOWLEDGEMENTS
The authors thank Mr. James Crawford for helpful discussions pertaining to ISO standards and standardization.
REFERENCES
1. Masson J-F., P. Collins, M. Lowery. Temperature control of hot-poured sealants during the sealing of pavement cracks. 83rd Annual Meeting of the Transportation Research Board, 2004, Paper 04-2555. 2. Masson, J-F., P. Collins, J. Margeson, G. Polomark, Analysis of Bituminous Crack Sealants by
Physicochemical Methods. Transportation Research Record No. 1795, 2002, 33-39.
3. Olabisi, O., L. Robeson, M. T. Shaw, Polymer-Polymer Miscibility, Academic Press, New York, 1979. 4. Masson, J-F., P. Collins, J. Margeson, G. Robertson, J. R. Woods. Thermodynamics, Phase Diagrams, and
Stability of Bitumen-Polymer Blends. Energy & Fuels 2003, 17, 714-724.
5. ASTM D6690-01, Standard Specification for Joint and Crack Sealants, Hot-Applied, for Concrete and Asphalt Pavements, American Society for Testing and Materials, West Conshohocken, PA.
6. Brûlé, B. Contributions of Gel Permeation Chromatograpy (GPC) to the Characterization of Asphalts. Chromatographic Science 13, 1979, 215-248
7. Linde, S. and U. Johansson. Thermo-oxidative Degradation of Polymer Modified Bitumen. Polymer Modified Asphalt Binders, ASTM STP 1108, 1992, 244-253
8. Hugener, M. and S. Hean. Comparison of Short-Term Aging Methods for Joint Sealants. Durability of Building Sealants. RILEM Proceedings No 28, J.C. Beech and A. T. Wolf Editors, 1996, pp. 37-47. 9. ASTM D5167 Practice for Melting of Hot-Applied Joint and Crack Sealant and Filler for Evaluation,
American Society for Testing and Materials, West Conshohocken, PA.
10. Paradis, G. and J. Trubiano. Demystifying ISO 9001:2000: Information Mapping's Guide to the ISO 9001 Standard, 2000 Version, 2nd Edition, Prentice-Hall, 2001.
LIST OF TABLES AND FIGURES
TABLE 1 Sealant remixing and analysis methods.
TABLE 2 Composition of sealants at various installation times (wt %). TABLE 3 Composition at the top and bottom of poured sealants.
FIGURE 1 TGA mass loss curves for the remixed, top and bottom of the as-received sealant 1A. Curves for the homogenized and top samples were shifted for clarity. The initial weight was 100%.
FIGURE 2 Gel permeation chromatogram for sealant 1A taken from the top and bottom of the as-received material compared with the remixed material.
FIGURE 3 Thermograms for samples of sealant 2A taken from the top and bottom of the as-received material compared with the remixed material.
FIGURE 4 Chromatograms for samples of sealant 2A taken from the top and the bottom of the virgin sealant compared with the remixed material.
FIGURE 5 Creep and recovery at –22°C for sealant 2A.
TABLE 1 Sealant Remixing and Analysis Methods. Remixed Remixed
Sealant Lot
Lab. Field Kettle stirring and speed Analysis method A yes yes Slow rocking GPC, TGA, FTIR, DSR 1
B yes no DSR
A yes yes Circumferential stirring, 25 rpm GPC, TGA, FTIR , DSR B yes yes Circumferential stirring, 3 rpm GPC, TGA, FTIR, DSR
C yes no DSR
2
TABLE 2 Composition of Sealants at Various Installation Times (wt %). Time, h Sealant 1A Polymer Sealant 1A Filler Sealant 2A Polymer Sealant 2A Filler Sealant 2B Polymer Sealant 2B Filler 0 * 6.2 9.1 5.4 10.3 n.a. n.a. 1 6.1 9.0 5.9 9.9 n.a. n.a. 2 6.4 9.3 n.a. n.a. 10.8 9.2 4 6.5 8.7 6.8 9.1 10.7 9.3 5 6.7 8.5 7.2 8.6 12.7 n.a. 6 n.a. n.a. 7.3 9.2 10.5 8.9 Mean (σ) 6.4 (0.2) 8.9 (0.3) 6.5 (0.8) 9.4 (7) 11.2 (1.0) 9.2 (0.2)
* Start of installation: Sealant heated and stirred for some time in kettle prior to application. n.a.: not available.
TABLE 3 Composition at the Top and Bottom of Poured Sealants. Sealant 1A Sealant 1A Sealant 2A Sealant 2A Sealant 2B Sealant 2B Time, h Location Polymer Filler Polymer Filler Polymer Filler
top n.a. 8.0 n.a. 10.5 n.a. n.a. 0
bottom n.a. 9.4 n.a. 9.4 n.a. n.a. top n.a. n.a. 5.9 n.a. n.a. n.a. 1
bottom n.a. n.a. 5.8 n.a. n.a. n.a. top 6.4 n.a. n.a. n.a. 10.8 9.0 2
bottom 6.3 n.a. n.a. n.a. 11.0 9.5 top 6.6 n.a. 6.7 n.a. 11.0 n.a. 4
bottom 6.8 n.a. 6.4 n.a. 10.9 n.a. top n.a. 8.2 n.a. n.a. n.a. n.a. 5
bottom n.a. 8.8 n.a. n.a. n.a. n.a. top n.a. n.a. n.a. 9.8 n.a. 9.4 6
bottom n.a. n.a. n.a. 9.8 n.a. 9.4
FILLER CONTENT 8.1% remixed 1A 8.3% top 7.8% bottom 20 40 60 80 100 120 W e ig h t ( % ) 150 250 350 450 550 650 750 850 Temperature (°C)
FIGURE 1 TGA mass loss curves for the remixed, top and bottom of the as-received sealant 1A. Curves for the homogenized and top samples were shifted for clarity. The initial weight was 100%.
FIGURE 2 Gel permeation chromatogram for sealant 1A taken from the top and bottom of the as-received material compared with the remixed material.
FILLER CONTENT 6.4% 2A remixed 1.8% top 17.0% bottom 0 20 40 60 80 100 W e ig h t ( % ) 150 250 350 450 550 650 750 850 Temperature (°C)
FIGURE 3 Thermograms for samples of sealant 2A taken from the top and bottom of the as-received material compared with the remixed material.
FIGURE 4 Chromatograms for samples of sealant 2A taken from the top and the bottom of the virgin sealant compared with the remixed material.
0
1
2
3
4
5
0
5
10
15
20
25
30
Time, min
St
ra
in
, %
2A
bottom
remixed
top
0 0.05 0.1 0.15 0.2 0 10 20 30 Time, min Str a in , % 1A 1B 0 0.2 0.4 0.6 0.8 1 1.2 1.4 0 10 20 30 Time, min Str a in , % 2A 2B 2C 2D


