Publisher’s version / Version de l'éditeur:
Transactions - The Society of Naval Architects and Marine Engineers, 105, pp.
297-321, 1997
READ THESE TERMS AND CONDITIONS CAREFULLY BEFORE USING THIS WEBSITE.
https://nrc-publications.canada.ca/eng/copyright
Vous avez des questions? Nous pouvons vous aider. Pour communiquer directement avec un auteur, consultez la première page de la revue dans laquelle son article a été publié afin de trouver ses coordonnées. Si vous n’arrivez pas à les repérer, communiquez avec nous à [email protected].
Questions? Contact the NRC Publications Archive team at
[email protected]. If you wish to email the authors directly, please see the first page of the publication for their contact information.
NRC Publications Archive
Archives des publications du CNRC
This publication could be one of several versions: author’s original, accepted manuscript or the publisher’s version. / La version de cette publication peut être l’une des suivantes : la version prépublication de l’auteur, la version acceptée du manuscrit ou la version de l’éditeur.
Access and use of this website and the material on it are subject to the Terms and Conditions set forth at
Model experiments to determine the survivability limits of damaged
Ro-Ro ferries in waves
Molyneux, W. D.; Rousseau, J.; Cumming, D.; Koniecki, M.
https://publications-cnrc.canada.ca/fra/droits
L’accès à ce site Web et l’utilisation de son contenu sont assujettis aux conditions présentées dans le site
LISEZ CES CONDITIONS ATTENTIVEMENT AVANT D’UTILISER CE SITE WEB.
NRC Publications Record / Notice d'Archives des publications de CNRC:
https://nrc-publications.canada.ca/eng/view/object/?id=e760f38b-a157-4e74-8aac-3ae40fd76ac6 https://publications-cnrc.canada.ca/fra/voir/objet/?id=e760f38b-a157-4e74-8aac-3ae40fd76ac6
National Research Council Canada Institute for Ocean Technology Conseil national de recherches Canada Institut des technologies oc ´eaniques
Institute Report
IR-1997-08
Model experiments to determine the survivability limits of
damaged Ro-Ro ferries in waves
Molyneux, W. D. •Rousseau, J. •Cumming, D. •Koniecki, M.
1997
Molyneux, W. D.; Rousseau, J.; Cumming, D.; Koniecki, M., 1997. Model
experiments to determine the survivability limits of damaged Ro-Ro ferries in waves.
Transactions - The Society of Naval Architects and Marine Engineers, 105 : p.
SNAME Transactions,Vol. 105, 1997, pp. 297·321
Model Experiments to Determine the Survivability Limits
of Damaged RO-RO Ferries in Waves
David Molyneux,
Member, Institute for Marine Dynamics,Joseph Rousseau,
Associate Member PolarDesign Associates,
David Cumming,
Member, Institute for Marine Dynamics,Mariusz Koniecki, '
Member, Transport Canada
ABSTRACT
The sinkings ofthe European Gateway, the Herald ofFree Enterprise and the Estonia have highlighted the potential fOr tragedy when water jloods the car deck of RO-RO ftrries. Transport Canada, through the Marine Saftty Directorate and the Transportation Development Centre, sponsored model experiments to evaluate the efftctiveness of the current SOLAS regulations and to determine
ifthey can be softly relaxed when applied to
domestic ships operating in sheltered waters. The first model tested was a prismatic hull,
with the overall dimensions and stability characteristics ofa 160 m ftrry
The subject of this paper is the results fOr the second model tested which was a simplified ship shaped hull with a waterline length ofapproximately 87 metres. The basic hull form was derived from smaller ftrries, but was modified to be symmetrical about midships. The program of experiments was carried out over ranges of residual.freeboard, vertical centre of gravity and area of .freeing ports (fitted with jlaps). The estimated maximum significant waveheight that the ship will survive is presented against various stability parameters andfreeing port areas.
The limits of survivability are evaluated against the current SOLAS
requirements. and are also compared with the findings from the Joint North West European R&D Project 'Saftty of Passenger/RO-RO Vessels '. These results were developed from ships with jUlly enclosed car decks, rather than typical North American designs.
NOMENCLATURE
A Total area of freeing ports per side, sq. m.
B Beam,m.
C Constant depending on direction of waves
relative to damage
D Depth of water on deck, m.
t>. Displacement of ship at flooded waterline, tonnes.
Fb Residual freeboard after damage, with dl)' deck,m.
GMf Metacentric height of ship, after flooding,m.
GMn Non-dimensional GMf.
g Acceleration due to gravity, 9.81 mls'.
h Static head of water on deck, above calm
waterlevel, m.
Hs Significant waveheight, m.
Hn Non-dimensional significant waveheight.
KG Vertical centre of gravity, above keel, m.
Tm modal, or peak period, sec.
Lpp Length of ship between peIpendiculars, m.
(() Wave frequency, 21t1Tm,S·l
INTRODUCTION
The sinking of the 'European Gateway', the
'Hernld of Free Enterprise' and the 'Estonia',
with the tragic loss of many lives, served to highlight the potential for disaster when water
floods the car deck of RO-RO ferries. While
human error was detennined to be an important component in all these casnalties, there are conceivable scenarios when water accumulation
on the car deck is unavoidable. One of these
cases is when the feT!)' is damaged doring a collision. The stability reqnirements for the feT!)' in this situation are regulated through the Safety of Life at Sea (SOLAS) Conventions under the
auspices of the International Maritime
Organization (lMO, 1986).
Transport Canada, through the Marine Safety
Directorateand the Transportation Development
Centre, sponsored a research project to
investigate the parameters influencing the
capsizing of RO-RO ferries after the hull is
ruptured at midships, and to evaluate the
effectiveness of the relevant SOLAS regulations in a Canadian context. This project was started
in 1993 and has involved numerical methods
am
physical model experiments. It was divided into three phases. The first phase was designed to develop a fundamental uoderstandiug of the
factors preventing the capsizing of a damaged
RO-RO ship with the enclosed deck flooded. The hull studiedhada constant cross section and it
was designed to emulate the stability
characteristics of a feT!)' approximately 160m long. The basic purpose of the experiments was to establish the effect of ship stability parameters on the limiting significant waveheight to cause a capsize. In addition, the potential for improving
survivability by draining the car deck was
investigated. Freeing ports with outward opening flaps allowed water to drainoff the car deck, but prevented wave action from flooding it.
The second phase extended the resean;h hased on the same simplified hull form. It was directly influenced by the reqnirements of the Panel of
Experts established by the Maritime Safety
Committee at its sixty-fourth session in
December 1994, to review all aspects of RQ-RO feT!)' safety. The Canadian representative on the Panel of Experts was vel)' interested in the safety of open shelter deck ferries operating on the west
coast of Canada and the United States. These
ferries do not operate in exposed waters,
am
typically have a centreline casing and freeing
ports. The original model was modified to
include an enclosed deck with an open stern,
am
a car deck protected only by bulwarks. Some questions were raised in the Panel of Experts discussion over the long term utility of flapped freeing ports, so permanently open freeing ports were included in the study.The data collected during the first two phases was vel)' useful in understanding the fundamental problem, but the results and the derived relations
needed further validation against the tests with other hull forms. The third phase was to develop a more realistically shaped hull and to consider some of the same parameters studied in the first two phases. The results of the third phase are the subject of this paper. As with the first two phases, experiments were carried ont over a range of residnal freeboards, static stability conditions,
and freeing port areas on a model with
am
without a centreline casing. The objective of the research was to derme the limiting significant waveheight to cause a capsize for a range of stability parameters aud freeing ports areas. The results are compared with the published data from similar experiment programs carried out on
J
j
European designs. These data will eventually be used to assess typical Canadian ferries against the SOLAS regulations, andto develop a イ・ャ。セ。エゥッョ
scheme for those operating in protected, low
traffic areas.
SUMMARY OF PREVIOUS
CANADIAN RESEARCH INTO セoMro
FERRY CAPSIZING
The 1:20 scale model used for the first phase
of the research included realistic decks,
superstructure, double bottom tanks, bilge keels and a removable centerline casing. Measurements were made of model motions, waveheight and the instantaneous depth of water at 14 locations on the car deck. The results from these experiments have been published by Stubbs et al [1996] as lintiting waveheight against stability parameters
(GMf and GZ-area). Also given are lintiting
values of water on deck as a function of GMf. Detailed descriptions of the model and the test procedures are given by Molyneux & Cumming (1995).The depth of water on deck data was also
used by Hutchison et aI (1996) as part of the
North American contribution to the IMO Panel of Experts.
The most important findings can be sununatized as follows:
• capsizing occurs after a critical volume of
water has accumulated on the RO·RO deck;
• the critical volume of water on deck depends
mainly on the GM after flooding
• the accumulation of water on deck is a
function of the vessel's relative motion at
the damage opening.
Itwas also observed that pennanently open
freeing ports were of no benefit to the
survivability of the vessel, and in some cases
they had a detrimental impact. The ability ofthe
freeing ports to drain the deck is severely
comprontised by the water flooding the deck
through the pennanently open ports. Flapped ports however, do not allow the ingress of water to the vehicle deck but do permit drainage. Their effect was to introduce a progressive increase in
vessel survivability as freeing port
area
wasincreased. The increase in lintiting waveheight
due to freeing ports was most at residual
freeboards of I metre or more. At lower
freeboards, the external wave action tended to keep the freeing ports shut and reduoed their effectiveness.
When the casing was fitted, the water tended to drainoff only through the ports facing the
waves. When the casing was removed, the water
on the deck could drain through the ports on both sides and a substantial increase in the lintiting significant waveheight was observed. When pennanently open freeing ports were used, the casing did not influence the survivability. Water flowing in through the ports caused a heel towardsthedamage andthe water on deck tended not to flow the full width of the deck.
With pennanently open freeing ports at an
AILratio of0.3, the vessel required2 metres of residual freeboard to survive a significant wave height of 4 metres. With flapped freeing ports of the same area, the vessel survived the same waveheight with I metre of residual freeboard.
EXTENSION OF THE RESEARCH TO A SHIP SHAPED HULL FORM
The first two phases of the Canadian research
badprovided valuable insights into the capsizing mechanism and on the benefits of drainingthecar deck to prevent a capsize. However, the prismatic model was a simplification of the real flooding
and capsizing situation. Also, the resulting
geometry of the hull, whilst representative of the extreme flare on some Canadian west coast vessels, was not typical of the North American fleet. The simplified hull shape also meant that
theflooded portion of the hull was approximately
36percent longer than the equivalent value for a ship shaped hull. As such, the application of the results obtained from the first two phases was limited to the theoretical studies and secondary effects, such as improvements in survivability
due to freeing port configuration From the
onset of the program, the research team realized
that further experimental validation with
more
realistic ship forms was necessary to support the credibility of the initial results.
The main advantage of the prismatic hull was its simple geometry, whichreducedthe
range of variables and simplified the
mathematical description of the hull. In keeping with this philosophy, it was decided that the third
, . - - - ,
,
Figure
1.
Body Plan, Simplified Ro-Ro Ferry
Ial
I-セM
-
セ セセ
MMMMMMMMMMMMMMMMMMMMMMMMMMMMMMMMセFigure 2. Profile, Simplified Ro-Ro Ferry
•
2) A maximum righting arm (GZ) of at least 0.1 metres and
I)A minimum area under the GZ curve
of 0.015 metre-radians,
phase oftheresearch should focus on a hull form closer to the shape of a real ship. Another factor in the selection of the ship dimensions was to ensure that the results of the research were applicable to the smaller ships in the Canadian fleet
Other features such as
area
of freeing portsper unit length and location of the centreline
casing were keptthesame as the previous study.
Since the earlier results had shown that
permanently open freeing ports were of no benefit, the third phase ouly investigatedflapped
ports.
The major portion of the experiment
program was to investigate the capsize
survivability of the ferry model over a range of stability conditions related to the SOLAS 90 damage stability regulations. These regulations
refer to three key variables and the minimum
acceptable value of each. They
are:
3) A minimum range of positive. stability of at least 15 degrees
Length, O. A. m.
Length, WL
m.
Beam, O. A. m.
Beam, WL m.
Draft, intact, m. Depth, to car deck, m. Volume of displacement, m'. 87.20 85,42 18,48 18.Q4 4.95 6.71 4354.2
coincidentally, but the likelihood of this
happening in real life is also very low. The positions of the vertical centre of gravity were
picked to give each of these three parameters, for a total of four residual freeboards (0.2, 0,4, 0.8
and L2 metres). A summary of the test
conditions is given in Table 2. A typical vertical
centre of gravity for a ship of this size is
approximately 7 metres.
It was felt that the minimum
freeboard
of0.5 metres used in the previous study was too high so for this research a minimum value of 0.2 metres was used. The other freeboards were picked to cover the likely range of values for ships designed to SOLAS 90.
The effect of the number of freeing ports
was studied at each test condition. Three
levels of freeing ports were used No ports open was equivalent to a fully enclosed deck.
Fb KG SOLAS 90 GMf GMn m m condition m L2 8.00 0.1 mGZ 0.373 3,47 L2 7.59 O.oI5 m-radians 0.776 7.23 L2 7.00 15 degree range 1.366 12.72 0.8 7.42 0.1 mGZ 0.930 9.52 0.8 7.22 O.oI5 m-radians 1.124 11.51 0.8 6.77 15 degree range 1.555 15.92 0.4 6.86 0.1 mGZ 1.537 17.20 0,4 6.36 O.oI5 m-radians 1.961 21.95 0,4 5.70 15 degreerange 2.693 30.14 0.2 6.10 O.lmGZ 2.174 25.40 0.2 5.51 O.oI5 m-radians 2.865 33,47 TableI
Summary Particulars for Simplified RO-ROFerry
The hull shape developed to meet the
objectives discussed above had two planes of
symmetry, one at the centreline and one at
midships. A bodyplan and profile of the model
are
given in Figures I and 2 respectively.Summary particulars for the intact ship
are
given in Table I.For the hull form in question, it was not possible to obtain all the SOLAS parameters
Table 2
Nominal Test Conditions and Measured GM for flooded hull
Six ports open per side, corresponded to the International Load Line Convention, withAIL of 0.08 and20 ports open per side corresponded to
AIL of 0.3 where A is the total
area
of openports (per side)andL is the length of the deck The freeing ports were fitted at the level of the cardecl"
and
were L2 metres long by 0.6 metres high. Each port was fitted with a flap (opening outwards only) that could be locked shut, orSurvivability of Damaged RO-ROFerries
. _ . _ - - _. . ._
Brace
nk
Top
Ledge
[ar Deck
[
al'lera
Casing ----,
r-
[ross
セ
'"
セ
I f i 'V
Ta
セ
\\'"
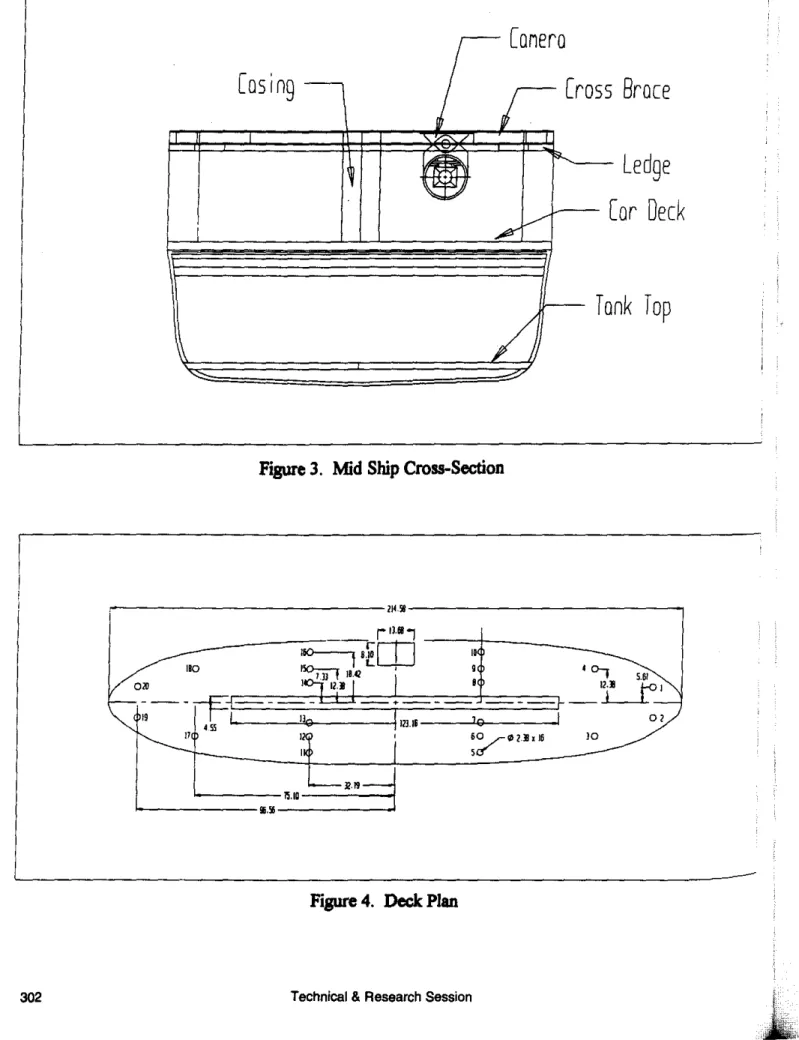
::7Figure 3. Mid Ship Cross-Section
, - - - / " 0 - - - ,
0/ )0"
9 • 0, 5.61rc----t-t-+-_-....::-'.!-_-=--_
=-=:...-'t-_-_-_=-=' _
セ
I GMMMセAjgMMMM⦅ャQRャQF '9 ZセPRNャQQjV 110"
---"-"?
'---
セNB=:j
' - - - -
...
-Figure 4. Declc: Plan
allowed to flap open. Each condition was tested
with and without the centreline casing to
determine the difference in the results when the
water was free to flow the full width of the
model.
All of the experiments discussed in this section of the paper were canied out in a
JONSWAP wave spectrum, with a peak
enhancement factor of 3.3. The nominal
waveheightandperiod relationships are given in Table 3.Thewave height to period relationships
were selected based on observations made in
Canadian coastal waters. Also given are the
calibrated values (based on a 40 minute repeat
period)andthe average of the values taken from
the waveheight measurements made on· the
towing carriage, moving with the model.
In plaruring the third phase of this research
project, it was important that the model
construction, testing methods, data acquisition
systems and analysis methods take advantage of
the most recent developments in the
area
ofdamaged model testing. A summary of these developments is given by Molyneux [1996J.
Hs Modal CalibratedHs Average Hs
Period (stationary) (moving)
m sec m m 1.0 5.5 1.04 1.32 1.5 6.0 1.60 1.73 2.0 6.5 1.98 2.24 3.0 7.0 2.92 3.22 4.0 7.5 3.92 4.06 5.0 8.0 4.86 4.85 6.0 8.5 5.91 6.08 7.0 9.0 6.61 6.59 Table 3
Nominal Significant Waveheights and Peak Periods
DESCRIPTION OF MODEL EXPERIMENTS
Model Construction
The model was constructed to 1:16 scale. This scale ensured that the model was as large as possible within the practical limitations of the testing facilities. Two identical half models of
the hull and superstructure (bow and stem) were made from glass reinforced plastic using a female mold. A plywood double bottom concealing pennanent lead ballast was then fitted and covered
with glass fibre and resin. All void spaces in the double bottom were filled with closed cell foam. Transverse bulkheads, extending between the double bottom and the car deck, were coustrocted to define the limits of the available floodable
length within the hull. The cardeckwas made
from a single piece and included watertight hatches to pennit access to the hull for fitting
ballast in the void spaces and to pennit the
installation offoam inserts to vary the floodable length. The damage opening was fitted with a sliding door that was designed to be opened from the tow carriage. The model was also fitted with bilge keels, but no other appendages. A midships section drawing showing some details of the construction is shown in Figure 3.
The superstrocture deck was made of
plywood and clear lexan which permitted00equate
ambient lighting for video records of water flow
on the car deck. Foam buoyancy blocks were
secured above the superstructure deck to ensure
the model did not invert after a capsize. The
exterior of the model was painted yellow from the baseline to the cardeck and white from the
car
deck to the superstructure deck. The interior of the superstructure was also painted white.An array of 20 capacitance probes fitted to
the
car
deck as shown in Figure 4 was used tomeasure the level of accumulated water.
Capacitance probes were also used to measure relative motion in way of the damage opening. A stationary capacitance wave probe located 60 metres from the wavemaker was used to measure the characteristics of the incident wave field. A second capacitance wave probe was fitted to the tow carriage to measure the wave conditions close to the model. A magnetic switch was used
to detect the instant the door opened and the
flooding started. Roll and pitch were measured
using a 2-axis electro-mechanical gyro.
Orthogonal linear accelerations were measured
using uni-axial accelerometers fitted in a
precision tri-axial mount.
All motion measurement instrumentation
and the associated power supply, signal
processing and data acquisition systems were
installed in a watelproof box mounted on top of the superstructure amidships. Heat dissipation from this instrumentation box was ensured by using passive heat sinks. Electrical power for the
Calculated Volume (cu.m.) Volume difference (cu. m.)
Casing Deck Measured Model static Model rolling Model static Model rolling
Area Volume Mean Mean Std. dev. Mean Mean
(cu. m.) (cu. m.) In 1257.47 397.3 450.6 478.6 26.6 -53.3 -81.3 In 1257.47 94.2 92.9 92.6 12.5 1.3 1.6 In 125747 229.4 302.7 277.9 27.2 -73.3 -48.5 Out 1350.14 135.2 137.8 156.3 13.4 -2.6 -21.1 Out 1350.14 254.0 319.6 339.5 33.0 -65.6 -85.5 Mean 22.5 -38.7 -47.0 Std. dev. 9.1 35.5 37.7 Table 4
Results of volume of water on deck calibrations
Technical& Research Session 304
ballast pumps, video camera, signal conditioning
equipmentandinstrumentation was provided via
a cable from the tow carriage. Data was
transferredfrom the model to the tow carriage
data acquisition system via an EtherNet link.
Signals not collected au the model such as
incident wave height and carriage speed were
conditioned using a second signal conditioner. Time histories of eachdata chanoel were plotted for review at the end of each run. Video tapes were made of the sideandend views of the model in waves, and a view of the water motion on the
car
deck.Prior to commencing the test program, the empty model was weighed and the location of the centre of gravity, together with the radii of gyration in pitchand roll, were determined. All of the experiments were carried out in the
Towing Tank at the Institute for Marine
Dynamics iu St. John's, Newfoundland. The tank is 200 m long, 12 m wide and 7 m deep.
Calibration of Volume of Water on
Deck
During the first two pbases of the project, it became clear that the volume of water on the deck was a key parameter effecting the capsize of
the ship. For the hull form used in the third
pbase, it was expected that the volume required to capsize the ship would be smaller than the values obtained in the earlier phases. For this reason,
special care was taken in determining the
accuracy of the volume measurements. A
number of experiments were carried out to assess
the accuracy and sensitivity of the algorithm
derived for computing the volume of water on the car deck from the water level data measured using
the array of 20 level probes. The car
deck
wassealedand
flooded
with water. Tests were carried out for the following three conditions:a) level upright (strapped to crane with a load cell to measure weight of water),
b)stationary, heeled,
cJ dynamically excited by manually rolling the model.
The volume estimation procedure used linear interpolation between the waterlevel probes ani assumed that the modelhad no appreciable trim. All tests were carried out at a residual freeboard of 0.8m and nominal vertical centre of gravity 7.42
metres above the keel, full scale. The
experiments were carried out with and without
the centreline casing in place. Results of these
experiments
are
given in Table 4. Based on thestandard deviation of the observed mean enor ani
assuming it had a normal distribution,
we
determined that the calculated mean is within
±
75cubic metres at 95% confidence. Another
interesting observation is the standard deviation
of the volume during the measurements. The
average of this value is 22.5 cubic metres, ani this gives an indication of the absolute accuracy of the algorithtn, since the volume of water on
the
deck
was constant over the time this valueThe difference between the measured and
computed volumes is primarily due to the
accuracy of the measured depth of water ondeck
(estimated at +/- 3%) and the linear
approximation used to compute volume of water on deck. During the calibration experiments, it was obselVed that water on deck accumulated at one end or other of the model, while the model
(including the water) was being weighed. A
detailed investigation revealed that this was
especially true for calibration run numbers 1,35 ( tbe runs with tbe highest difference between the
measured and computed water volume). This
resulted in an asymmetry between the depth of water in the bow and stern, which affected the results when the avernge depth of water is computed, especially if one end was dry. Checks on data taken during the experiments in waves did not show this longitudinal asymmetry and so we can assume that the errors in the calculated
volumes from the experiments in waves are no
greater tban the values obselVed in the
calibration.
EXIJeriments in Irregular Waves
A typical test procedure started with the model being ballasted to the intact draft, trim and VCG. An inclirting experiment was then carried out to verify that the condition was correct. The
freeing port arrangement, centreline casing
configuration, and floodable length for thedesired
residual freeboard were set. A roll decay test was carried out to deterrrtine the natural roll period of the flooded model.
The model was placed across the tank, with
the damage facing tbe oncoming waves,
approximately 20 metres from the wavemaker.
The wavemaker was started and data acquisition
began in the calm water period before tbe wave train reached the model. The model was kept in position (using ropes tied to the bow and stem) until the first few transient waves had passed. The hull damage door was opened using cables from the tow carriageandthe model flooded down to its nominal residual freeboard.
The model was tben perrrtitted to
drift
down the tank underthe natural action of the waves. The carriage operator, using the video imagefrom the camera directed at the stern of the
model, adjusted the carriage speed to preselVe a
constant distance between tbe carriage and the
model(+/-I m). The model drifted down the tank in a very stable manner. The run was complete
when the model capsized or a full scale time of
approximately 40 minutes elapsed without
capsize. At the end of the run, the model was righted using a pulley system on the tow carriage. It was then pumped dry and configured for the next experiment. The heel angle of the
model was checked after each run, and if
necessary tbe ballast was adjusted to ensure zero roll when tbe model was flooded. The model without the casing was very sensitive to the static heel of the model at the start of the e"'Periment. A small change in static heel could change the wavebeight to cause a capsize by the equivalent of several metres.
DISCUSSION OF RESULTS
Comparison of Experiment Results
with SOLAS 90 Regulations
For the hull form in question, with its Centre of Gravity 7 metres above the keel (which is typical for a ship of this size) the strict compliance with all three parameters within SOLAS 90 occurred at a residual freeboard of 1.2 metres. The corresponding value of GMf was 1.37 m and the limiting constraint was the 15
degree range of positive GZ lever, and the two
other limits were exceeded. In this condition the
ship sUlVived waves with a sigrtificant
waveheight of 4 metres with the casing in place and 7 metre waves wben the casing was removed. The IMO Panel of Experts noted that 99 percent of all collisions between ships had been obselVed in waves with a sigrtificant height under 4 metres.
Some other interesting obselVations were made. For the model with the casing removed, the survivability limit stayed at a sigrtificant height of 7 metres for all the conditions tested that met the 15 degree range requirement. For the conditions with the centreline casing in place however, when the residual freeboard was lowered to 0.8 metres, even though the centre of gravity was also lowered, the model only sUlVived waves with a sigrtificant height of 2 metres. At a residual freeboardof 0.4 metres, the waveheight sUlVived increased to 3 metres. Based on these obselVations, SOLAS 90 does not provide a
uniform standaId of survivability. Freeboard
appears to have an effect on the waveheight sUlVived, independently of its influence within the function of GZ against angle ofheel.
Drydeck
Drninwater offdeck
No No
Figure 5, Simplified representation of the capsize
process
The most obvious parameter to consider for
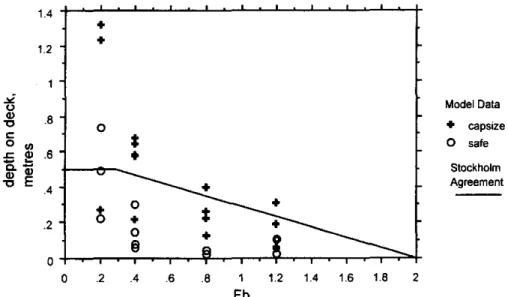
limiting the volume of water on the deck is residua! freeboard. Intuitively, a high freeboard in low waves will accumulate less water than a low freeboard in high waves. Hutchison et al [19%) suggested the non-dimensioual parameter FblHs as the independent variable that determined the amount of flooding on the car deck.Theresulting depth of water on the deck was also non-dimensionalized by Hs, to give the parameter DlHs.
New heel, new freeboard, new vessel dynamics If the SOLAS 90 standard was relaxed to the
limiting constraints of 0.015 m-rndians and O.lm
GZ,then the survivability of the model without the centreline casing was unchanged. For the model fitted with the centreline casing, the limiting significant waveheight for survivability was
reduced
to 1.5 metres at 0.4 metres of residual freeboard and2.0metres at 1.2 metres of residua! freeboanl. If the standard was relaxedfurther to tbe maximum GZ of O.lm only, then
limiting significant wavebeight for sUrvivability with the casing in place would be I metre or
less, and with the casing removed would be
between I metre and6 metres. For operntion in
sheltered waters, where significant waveheights
were typically under 2 metres, it would be
possible to reduce the SOLAS 90 standatd to
0.015 m-radians only, provided that the residual freeboard was greater than 0.8 metres.
The flapped freeing ports increased the
survivability as a function of the number of ports open, ship stability and residual freeboard. The
best effect of the freeing ports was seen at high freeboards, high stability and maximum number of ports, wbere the significant wavebeight for survivability of the ship was increased by up to 3 metres. In the worst case, tbe freeing ports made
no difference, andthese cases had low residual freeboard, low stability and a small number of ports open. The performance of the freeing ports should be taken into account in any relaxation of
the SOLAS 90
standards,
provided that watercannot flow onto the deck through the openings.
Flooding the RO-RO deck
The results of tbe first phase of the research (Stubbs et al, 1996) gave some good indicators of the factors influencing the survivability of a damaged RO-RO vessel. The simplified flow
chart shown in Figure 5 was derived from
observations on the model's behavior dming the experitnents. The two critical points in the
flooding and subsequent capsize process are
shown as diamonds. The first one is critical because a capsize can be avoided if no water enters the car deck. The second point is critical because a capsize will not occurifthe hull has sufficient stability to withstand the acquired volume of water on the deck. This process gives options for presenting the data with the objective of obtaining dimensionless limiting parameters to prevent the capsize of a damaged feny.
306
セセMMMMMMBセ
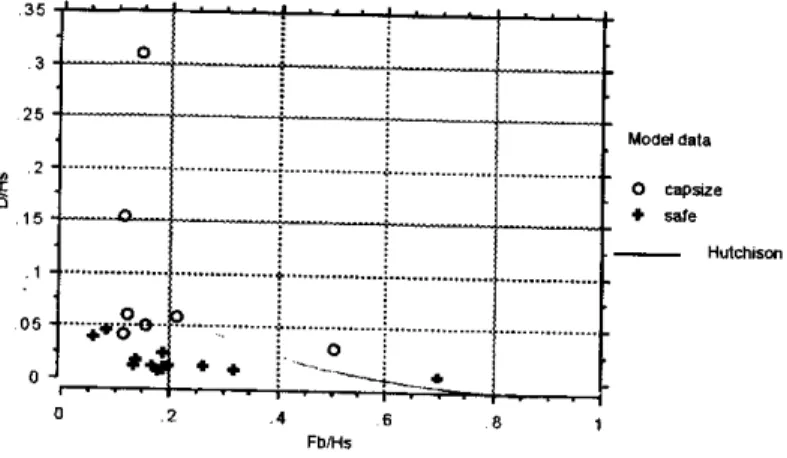
igure6, Non-dimemionaldepthof water on deck against non-dimensional freeboard, lodelwithcasing and freeingportsclosed.
o 35 / I ! ! I I Hutchison o capstze • Mfe Hutchlson MOdel data Model data o capsize
.
,.,
.
.8 .6 ...- . . . fbllis 4 2 ... ... oセMオオャ
..u.u·l· ..·· ..·juu--u..
L
1+
"'J
oイJセZイ[s{M[Z[
I
0セ
i II
;
I
;
I
.
セ
2:
GオNオ]セュオ⦅ャNュオオオオオオ
--.u--um---um.mu.ur--
uu--1 5 ! ,j.••••••••••••••••• .05 .•.•..••. ! do· + 1 • ... - - - " = ; I o.I,
j.
I
\
I
I
!I
3 0 35 .3 25 セ .2 c .15 .1 05 .35 ,< ! I I ! IFigure 8, Non-dimc:lVlionaldepthafwater on deck against non-dimensional freeboard, modelwith casingandsixfreeingports open.
Hutd'lison o capsize • safe Hutchison o capsize + safe Model data Modejljatll. セ ···0·--··-· 8 FblHs .4 o <
..._ _- L
セN⦅ _.-t.•.._..•.__..••... GMセ⦅Ni
1+
0 • ! ... _jo--2ZZᄋセ\^ャᄋᄋᄋMᄋᄋᄋᄋᄋᄋᄋᄋᄋᄋゥオBLMBBLMNBBBBMBLMM\オLMLLLLMN
oZ]]Zオセエセ]イZ[MM
o .35 3 . 25セ
. 152 .1 05 0;':F=:Fr]·:·:=t=:·
15NセセセNMMオオ
..uum.u--m·t·uu..umuu·i·u...uu..uu...um....m....
01.2). : i 05KN⦅NセMNセL--.
(fl c:s.
セ
セa
I
セ JJ'?
JJo
セ セN'"
FblHsFigure 7, Non-dimensionaldepthof water on deck against non-dimensional freeboard, model without casing and freeing ports closed.
FbfHs
Figure 9, Non-dimensionaldepthof water on deck against non-dimensional freeboard, modelwith no casing and six freeing ports open.
o 2 4 6 8 o .2 4 8 8
'"
セ
Technical&Research Session
This term allows for the change in righting
moment of the hull with both GMf and the
flooded volume of the hull, which changes with residual freeboard. Figure 12 shows DlHs plotted against GMn for the model with the centreline casing for all the freeing port conditions. This figure shows a region where the model will definitely capsize and a region where it will
definitely survive and a good demarcation
between the two. Figure 13 shows the s3l1le daIa for the model with the casing removed. The results for this condition show much more scatter but the s3l1le transition line is drawn, since there was not sufficient evidence for producing a separate line.
of water on deck to cause a capsize was a function of GMf and was independent of the number of freeing ports open or the arrangement of the deck (casing or no casing). A similartrend
was also found within the data from the
experiments carried out in the third phase. D/Hs was used as a paranreter to analyze the flooding of the deck and it can also he used as a parameter for non-dimensionalizing the volume of water on the deck. The other parameter required is a measure of stability, andas discussed above, GMf appeared to be a good indicator from the first two phases. However, a llOn-dimensionai form is prefered. Spouge [1994] gives a llOn-dimensional GM, in the form
(1 )
t.
GMf
1025 Lpp 8
3GMn
Overall Survivability Function
If the depth of water on deck is not used in
developing the stability criteria then an
alternative presentation can be considered. Given both previous presentations show reasonably good demarcation between the ship remaining upright andthe ship capsizing, this should also be trueifwe plot Fb/Hs against GMn. This is
shown for the model with a casing and no
freeing ports in Figure 14. This presentation is similar to those used by Dand [1991], Spouge
[1994] and Vassalos [1996]. Clearly there is a
limiting line for capsize safety, which is a smooth function of GMn.
When the same presentation is used for the model without the centreline casing (Figure 15), a similar survivability limit can be seen, but the For the experiments in irregular waves, the
volume of water on deck was calculated from the measured depths of water. Average depth was calculated by dividing the volume by the area of the deck. For cases when the model did not capsize, the volume analyzed was the highest
average volume of water. When the model did
capsize, the value analyzed was that just prior to the rapid changes in observed roll, typical of a capsize. Thesedataare plotted for the model with a centreline casing and no freeing ports open in Figure 6. The volumes from the cases when a capsize did not occur are a better indication of the limiting depth, since these conditions were
ulti-mately stable and the mean steady volume of
water was easy to determine. Itcan be seen that the line proposed by Hutchison et al is a reasonable indication of the limiting amount of water on the deck for the hull with the casing in place.
When the casing is removed (Figure 7) the
observed values agree with the equivalent
predictions at low freeboard to waveheight ratios, but as the freeboard increases. then the prediction is consistently higher than the observed values.
Themechanism for this reduced depth of water on the RO-RO deck was due to the fact that when the casing was removed there was a generaltrend for the model to heel away from the waves. This increased the effective freeboard at Il,e danJage, and so in tum reduced the flooding rate, resulting in a lower depth of water on the deck.
This presentation is also effective for
showing the influence of the freeing ports on the depth of water on the deck. Figures 8 and 9 show the effect of six freeing ports andFigures 10 aod
II show the effect of twenty freeing ports, with
and without casing respectively. The freeing
ports were most effective at medium values of Fb/Hs. At high values, there is very little water on the deckandthe freeing ports are not needed. At low values of FblHs, the external wave action works to keep the flapped ports shut, rendering
them less effective. When the casing was
removed, the freeing ports tended to be more effective, since the water could flow across the whole deck, allowing water to drain off both sides of the deck.
Volume of Water on Deck to Cause a Capsize
Stubbs et al [1996] showed that for the model used in the first phase of the research, the volnme
35 ]'
I
! :I
I
Figure 10,Non-dimensional depth of water on deck against non-dimemional freeboard, modelwithcasing and twentyfreeingports open.
Figure 11, Non-dimensional depth of water on deck against non-dimensional freeboard, model with no casing and twenty freeing ports open.
3]
0
I
'
,
.
i
I
セ
capsize limit o capsize + safe _ _ _ _ capsize limit Model data o capSIZe + safe 35 35 n•
,...
/
)'
30 30 25 25 15 20 -15 20 -10 10!II
o MfNセo...
セN. * •
Model data o.. -i
BQGXGセG[セBBB
.
cE "0 0 1 __O l:l __l!i. . 0 : . . . 5 •...•..••,...
.
ᄋᄋZZZZセjZZZセᄋャセᄋZZZNᄋAゥᄋ
.-.-t.
ᄋZセイjZZZセᄋZセZZZセᄋᄋᄋᄋlN[ᄋ
-f1'
:.
L.T..I
..•... 35 .3 .25 セa
15 .1 05Mi
.j::::;iL 0 35 3 25セ
2 15 1 05 0 0Figure12,Non-dimensional depth of water on deck against non-dimensional metacenmc height, modelwithcasing.
Figure 13, Non-dimensional depth of water on deck against Don-dimensional metacentric height, modelwithno casing.
Hutchison o capSIZe + sate Model data Hutchison Model data o capsize
.
"'.
8 8 6 FblHs 4 4 6 FblHs 2 2••
... toI -...-. ;
ot
Lセ 0 ; ----o oI"
iGセャBBGB
o 25]I
:
:
I
セ
15]"I
i
m • •> • •;
i
I
セ
,
0:
ZZZZZセZセNQZZセᄋZᄋセZᄋᄋイZセセセセQBセᄋセセᄋャZZセᄋセZZᄋZセᄋZ
セ
35 3 25.
.2 xa
15 .1 05 0 (fJ c:S
セg
"t
s.
セj
CD a.セ
o
セセN
'"
セTechnical&Research Session
GMn= -0.904Hn'+11.4Hn - 0.885 (3)
where C is a constant with values of I when the damage is facing the oncoming waves and 0.5 for the damage away from the oncoming waves. Also given in this paper is a formula for the limiting waveheight. Thisisexpressed as
(4)
_ h
l /3Hs - 0.085
TIlls equation is compared with the 1MD data in Figure 16 for the model with the casing and in Figure 17 for the model without the casing.
Spouge's limiting formula gives a good agreement for the model with the casing in place, butitunder predicts the survivability of the ship when the casing is removed. This may he explained by the fact that at equivalent GMn values for the two deck arrangements, the behavior of the water on the deck is different, which in turn influences the survivability. GMn is not sufficient to defme the differences hetween the hulls, since it does not include a parameter representing the effective floodable beam of the model, but only the overall beam.
Vassalos et al [1996] also discuss the problems associated with metacentric height as a predictor. As an altemative they propose a parameter based on the calculated static head of water on the car deck. The hull is assumed to he damaged below the waterline, but the car deck area remains intact. The volume of water on the deck required to heel the model to the angle corresponding value of maximum righting lever, GZ is calculated.
In this equilibrium position the maximum head of water h, inside the car deck above the calm water level is calculated. They then present a limiting equation relating this static head to
significant waveheight, based on extensive
simulations of several different RO-RO ferry types. The limiting equation is given as
Values of h were calculated for our model
and the corresponding values of Hs were
determined using equation (4). Figure 18 shows the values of h against Hs for the Canadian data with the casing in place and with the casing removed in Figure 19. Also shown is the limiting line given in equation (4). In these figures, all the safe cases sbould he above the dividing line and all the capsize cases should be below the line. Itcan be seen that the condition
with the casing has a reasonable agreement
between the predictions and the observations, but for the condition with the casing removed the theory under predicts the observations.
Basedon the data for the simplified model
desctibed in this paper, the published
survivability limits appear to be reasonably (2)
Hn
=Q)2Hs
Be
4gFb
Comparisons with Published
Survivability Limits
Spouge [1994] analyzed all the data available at
that time, and presented a limiting survival condition in the form of Hn against GMn, where Hn represents the ratio of wave slope to roll angle required to cause flooding. Hn is defined as
limit of survivability is more difficult to defme. At low values of GMn (less than 10) the influence of the casing is negligible. At GMn values over 10 there is a clear increase in the waveheight that the model will survive for a given residual freeboard, although this influence reduces as the freeboard is increased.
This behaviour can be explained by the movement of the water on the deck, and the resulting heel angle. When the casing is fitted, it tends to trap the incoming water on the side of the damage. This results in a mean heel angle into the damage, which in turn accelerntes the flooding process. All the capsizes observed for thismodel were with the damage side down.
The general benefit of removing the casing was to allow the water to flow across the full width of the deck. TIlls tended to heel the model away from the damage, increase the effective residual freeboard, and increase the waveheightat
which a capsize occurred. If the freeing ports were used, then there was the added advantage of being able to use the ports on both sides of the deck.
TIlls trend was modified in certain
circumstances. At low values of GMn there was a tendency for the model to heel into the damage as soon as the water came onto the deck. This negated the effects of heeling away from the damage, as discussed above. At the highest freeboards tested there was very little water on the deck, and so the casinghadlittle effect, because the volume of water did not heel the model significantly.
figure .4,Non-eimcnsional rcsichW freeboardagainstnon-dimcnsi.CDal
mclacenmcheight,modelwith casing andfmci18pod8closed.
Fiprc IS,Non..cJimcnsionaircaidual ftccboard againstlItOIMtimcnIionaJ
mcucermc
be.
modelwith nocasingMld freeingportsclosed._"to
o capSze.
----
-.,
.
u_ _ o ",,_.
-
---35 35 3D 3D 25 25•
• , ••••••••••••.1- •••••••9... o 10 10 5 5 o 2 --8 ..···-t···l _-. 3 oセI
I
I
I
I
I
セ 8 7+--!-+-t--t-irir-i
6 5 £ •KMMKMKMKMMMイMエセWQB
SKMMMMMMQQMMMKMKMゥMGWエGMM[セMイ
6 5 •...••... £•
... 2 セ 9I
I
I
I
I
I
I
I
9J
I
I
I
I
I
I
I
15....
20Figure16, Noo-dimcnsional wavchcight againstnon-dimcnsionalmetacentric height,
model withcasingand &ecingportsclosed.
Hi
....
20Frgure 17.nセッョ。i wavehciaht agaitlllnoo-dimcIIIionai mctaccnlri.cheight,
modelwithnocasingandIRqportIclOllCd.
_ _ _ capsizetiNt modeldatil o c.psize • SlIfe modeldldll o ",,_
.
_ _ _ ClPllZellmll: -35 35 3D 3D 25 25 o 15...,
20 15....
20 10 10 5 5 o o···l···
···1···
.
'II! :セV
0I '
;
. ···-r··O····-r--.
セᄋᄋᄋᄋᄋᄋᄋᄋᄋゥᄋᄋᄋᄋᄋᄋᄋᄋᄋᄋᄋᄋ[ᄋᄋᄋᄋᄋᄋᄋᄋᄋᄋᄋᄋ
. 2 : : 00 °0 o : ; i •,
NXKᄋᄋᄋᄋᄋᄋᄋセᄋᄋjᄋᄋᄋᄋᄋᄋᄋᄋᄋᄋᄋᄋᄋᄋᄋᄋᄋᄋᄋᄋᄋiᄋᄋᄋᄋᄋᄋᄋᄋᄋᄋᄋᄋᄋᄋᄋᄋᄋ
.
. 6 i " i , i セ GセN,
セNZL
::.:::::::.t·:::::::t.i.:.:··
:::::::::::t::::.::.::'·:.:::::::·:·::·::.:::::
i i I . •• i&
o ji
. ;
en
c:l
セ!a-t
JJセ
"J1
i
'"
-.
j
. /1
2 3 4 Slgnlllcenl wavehelght, m 6 Model dllta o cap$llEl + safe _ _ VassalosFigure 18, Comparisonoflimitingrelationship between head and significant waveheight given by Vassalos eta1and IMD data, modelwithcasing and freeingportsclosed
accurnte for the fully enclosed cases with the centreline casing in place. The approaches used
by Spouge (1994)
am
Vassalos [1996) areverified by the experimental data. However, both methods under predict the limiting waveheight for survivability when the centreline casing is removed. In Spouge's method, a multiplier for Hs, similar to that used for wave direction, would be a simple method of approaching the problem. This coefficient is not constant with GMn, as at
low values of GMn there is very little influence of the casing. In these cases, the model tended to
heel into the damage straight away,
am
so thelimiting waveheight was unaffected by the
casing. Based on the data in this paper the magnitude of this coefficient is given in Table 5. Care should be taken when using these values, since they are based on a small number of capsizes and only one hull fOTIll.
GMn Hs multiplier 0 1.00 10 1.00 15 0.59 20 0.50 25 0.43 Table 5
Multiplier for Hs based on observed data when casingisremoved
The method given by Vassalos recognizes the limitations of using GMf as a parameterand
effectively uses maximum GZ instead. The
problem for the hull described here is that the
maximum GZ for the two methods is
approximately equivalent, with
am
without thecasing, but the observed survivability of the model is much improved when the casing is removed. The concept of using GZ should be effective in distinguishing large differences in GZ for the same GMf, such as would occur when comparing side casings with centreline casings. In the case of the model experiments described here, there are other factors which must also be considered.
The prediction of water on deck given by Hutchison et al [1996) is suprisingly good, considering that it is basedon a stationary hull. It clearly gives a workable approximation for the
amount of water that gets onto the deck and it
bas been expa1Xled to include drninage effects. Again the predictions are best when the centreline casing is in place.
In addition to the results described in this paper, experiments were carried out to investigate the effect of peak period of the wave spectrum for a given significant waveheight. Other experi-ments studied the effect of bilge keels on surviv-ability. Two combinations of residual
freeboard
and VCG were tested in coastal (JONSWAP)
spectra
am
deep ocean (ITTC) spectra for thesame nominal significant wave height. A
comparison of the modal periods for the coastal
spectra
am
the deep ocean spectra is given inTable 6.
7 6 5 2 3 , Slgnlllcant waveheighl, m .9
···s·ar.I ··
+
+ -/-- )/ ..
.st--j--f----i'--+--i-."L+---t
. 7エMKMMiMMKMMKMMMMMLAヲ\ZェセK⦅⦅MK
./1
E S V ' , Model dltl. t_--j__
ェM⦅KMMMZ[セ⦅MKNNNNNZ」。NZZpZ[NセZZゥコZZZNNMMK0 _.
li·
5 / 'i
"!'-'
or .4 • _._"'_8 VlIssalos . 3エMM}YGGGiエMhャGGGaGGGNセMGGゥGMBGMゥMGGGGMヲAMTNNMK
.2 : vV
1
•
1セ
•...•..••..1 _..
+
セ
..
t
1
:e:"....• o-!4...,_...
セNNN[NNNセN[NNNNNNNMMゥセNNNNェNNセNNNェN of'!.gure19, Comparison oflimiting relationship between headand significant wavehcight
grvcnbyVassalos elaJ and 1MDdata,model with no casing and :freeingportsclosed
Hs Tm Tm
(coastal) (deep ocean)
m
sec.
sec.
2.0 6.5 8.5 3.0 7.0 10.4 4.0 7.5 12.0 6.0 8.5 14.7 7.0 9.0 15.9the same case without bilge keels. In some cases however, there was no increase. The benefit was seen most when the waveheights survived were high, and the roll angles were large. In cases where the roll angles were small, no increase in survivability was seen.
CONCLUSIONS
Table 6
Comparison of Model Periods, Coastal Waves and Deep Ocean Waves
In each case, the effect of increasing the peak period improved the survivability of the ship. For the case with15degree range of positive GZ at 0.8 metres of residual freeboard the highest
significantwave survived increased from2metres (coastal) to 4 metres (deep ocean). For the 15
degree
range
at 0.4 metres of residual freeboard, the highest significant waveheight survived increased from3metres to 7 metres. Waveheight alone is not the only parameter influencing survivability. Clearly wave steepness must also have an effect.This
was recognized by Spouge in the definition of Hn.Bilge keels also act to increase the survivability. A few experiments were carried out with the bilge keels removed. The significant waveheight survived was up to I metre higher when the bilge keels were present, compared to
For the hull form tested, with a typical centre of gravity position of 7 metres above the keel and the resnlting GMfvalue of1.366In,the SOLAS 90 regulations ensured that the ship
survived waves with a significant height of 4 metres. Survivability of the ship was improved if the centreline casing was removed,andwater was free to flow across the full width of the ship.
To meet the SOLAS 90 regulations with a realistic vertical centre of gravity, the hull form used for this stody reqnired a residual freeboard of 1.2 metres. If the residual freeboard was
redoced
andthe vertical centre of gravity was also
redoced
to retain compliance with the SOLAS 90regulations, then the waveheight that can he survived was also reduced. This implies that SOLAS 90 does not provide a uniform SllIOOard of safety (at least for the hull form
used
in this study) and residoal freeboard is a panuneterthat
should be included in any modifications to the regnlations. Relaxing the SOLAS 90 regulations to a limitation of0.015 m-radians, ratherthan the 15 degreerange of positive GZ,redoces
the survivability further and the waveheights thatcan
be survived are between1.5and2metres.
Survivability of Damaged RQ-ROFerries
セ
I
,
The data in this paper, together with the data
from the first phase of the research, showed that there are significant advantages to be gained by
draining the deck of a damaged RO-RO ferry.
Flow biased freeing ports can increase the survivability of the ship above the level of a ship with no freeing ports, provided that there is sufficient residual freeboard to allow effective drainage. The freeing ports prevent the volume of water on the car deck accumulating to the critical amount needed to induce a capsize.
The data given in this paper show good
agreement with published methods of estimating the depth of water on the deck [Hutchison et ai, 1996], the limiting GMf for a given waveheight
and residual freeboard [Spouge, 1994] and
limiting static bead of water on the car
deck
[Vassalos et ai, 1996], for the conditions when the centreline casing was in place. When the casing was removed, the published limitations tended to be pessimistic, This doesadd an extra factor of safety which may be an advantage when developing limiting criteria for survivability.
Whilst recognizing its limitations, GMf in
its non-dimensional form, is a reasonable
predictor of the survivability of damaged RO-RO ships, when combined with the ratio of residual freeboard to significant waveheight. However more work is required to defme a consistent predictor which takes into account aJl the known factors affecting the behaviour of the ship, such as the width of the f100dable deck in relation to the overall beam, the peak period of the wave spectrumandthe presence of bilge keels on the
ship. As it has been observed that the natural
heave period in the damaged condition was
practically the same as in the intact conditionand
was close to the peak of the wave spectrum, the focus of any future theoretical and experimental
work should be directed towards exploring the
relationship hetween heave, roll, relative motion
at the damage opening, and deck flooding
mechanism.
DISCLAIMER
The contents of this paper reflect the views of the authors and are not necessarily the official views or opinions of Transport Canada,
ACKNOWLEDGEMENTS
This research was fundedbyTransport Canada (Marine Safety Directorate), Trans-portation Development Centre, the Canadian Ferry Operators Association and the Institute for
Marine Dynamics, The financial supportand
encouragment received from these organizations is gratefully acknowledged, We would also like to thank the staff of the Institute for Marine Dynamics and Polar Design Associates who wOlxed on this project, The encouragement we received from WiJl Vickery, Canadian
representative on the INJO Panel of experts and Bruce Hutchison, Chairnlllllofthe SNAME Ad Hoc Panel on RO-RO safetey was much appreciated,
REFERENCES
1. W. Dand, 'Experiments with a Floodable
Model of a RO-RO Passenger Ferry',
Internatioual Couference on RO-RO Safety and
Vulnerability, The Way Ahead, RINA, London, April 17-19, 1991.
B, Hutchison, P, Little, D, Molyneux, P, Noble
and
R.
Tagg, 'Safety Initiatives from theSNAME Ad Hoc RO-RO Safety Panel', Ro-RO 96 Conference, Lubeck, Germany, May 1996, "International Convention for the Safety of Life at Sea", Consolidated Text of the 1974 SOLAS Convention, the 1978 SOLAS Protocol, the
1981 and 1983 SOLAS Amendments,
International Maritime Organization Publication, London, 1986,
D. Molyneux & D. Cumming, 'A Model
Experiment Technique for Predicting the
Capsizing of Damaged RO-RO Ferries', 24th American Towing Tank Conference, CoJlege Station, Texas, November 1995
D. Molyneux 'The Use of Model Experiments to Predict the Capsize of Damaged RO-RO Ferries', 2nd Internatioual Symposium on Safety & Operability of Ships, Osaka, 1996
J. Stubbs, D. Molyneux, M. Koniecki, T. Pierce
and
J.
Rousseau, 'Flooding Protection of RO-ROFerries', Spring Meetings, RINA, April 1996.
J. Spouge, 'A Technique to Predict the Capsize of a Damaged RO-RO Ferry', Symposium on RO-RO Ships' Survivability, RINA, London, 25 November 1994.
D. Vassalos, M. Pawlowski and O. Turan,
'Criteria for Survival in Damaged Condition', International Conference on the Safety of RO-RO Passenger Vessels, RlNA, London, June 1996.
Survivability of Damaged RQ-RO Ferries
Discussion
Aage Damsgaard, Visitor, Danish Maritime Institute We would like to thank the authors for this excellent and very systematic work. Their paper, which is easy to read, de-scribes the results of the entire project clearly and with a good portion of details.
In the past 10 years OMI has built up a strong position in the field of model testing of damaged ROIRO ferries. Eleven models were built and tested to date. Some of them to support intensive government-funded research programs while others were commercial investigations for the approval in accordance with the Stockholm Agreement. Therefore, we understand the technical and practical problems. which the authors of this pa-per must have faced during all three phases of their project.
As regards the behavior of the damaged ferry and the un-derstanding of the capsize process we would like to comment on two paragraphs from the paper.
Summarizing the results of Phase II, the authors say: "It was ... observed that permanently open freeing ports were of no benefit to the survivability of the vessel, and in some cases they had a detrimental impact. The ability of the freeing ports to drain the deck is severely compromised by the waterヲャッッ、セ
ing the deck through the permanently open ports. Flapped ports, however, do not allow the ingress of water to the vehicle deck but do permit drainage. Their effect was to introduce a pro-gressive increase in vessel survivability. "
In 1996 we were in the process of constructing a model for an "approval test" in accordance with the "Stockholm Agree-ment." The model represented an open aft-deck ferry equipped with freeing ports with top-hinged gates. One of the problems we faced was how to model the dynamics and gravity of the model gates, which in a proper way would simulate the behavior of the gates in fullAscale. We evaluated that leaving the free-ing ports open would provide the most conservative approach, which is in good agreement with the conclusion of the authors. However, our observations during testing of the above-men-tioned model, and later of all other models equipped with open freeing ports, showed the excellent effectiveness of those de-vices which considerably improve draining of the vehicle deck. According to our observations, the flooding of water through the permanently open ports into the model reported by the au-thors is limited to short moments only, correspondingtothe im-pacts of the highest waves of the irregular sea. The freeing port area of these ferries has typically been 0.08 x L and the minimum freeing port freeboard between 0.4 and 0.8 m.
The amount of water, which in this very short time passes the freeing port openings, is small compared with water which passes through the damage opening and, at frequent occasions, is thrown over a low side of the aft-ship. In some cases, dur-ing the followdur-ing short period, the freedur-ing ports might be slightly submerged at the increased angle of heel, but due to the fact that the head of the water accumulated on the vehicle deck is above the level of the surrounding area, the freeing ports」ッョセ
tributed to the draining process. The models examined at DMI all represented SOLAS-90 ships and they survived all the re-quired tests whereas they did not meet the Stockholm Agree-ment's requirements to freeing ports.
Later in the paper, the authors compare the behavior of their damaged model with and without a center casing on the vehi-cle deck, and they write: "The model without the (center) cas-ing was very sensitive to the static heel of the model at the start of the experiment. A small change in static heel could change the wave height to cause capsize by the equivalent of several meters."
We fully agree with this formulation. as we do with the
au-thors' description for the hydrodynamic mechanisms which are responsible for this behavior, which the authors bring in a later stage of the article. Based on the results of the research proj-ects performed at DMI we have conduded that the small change in static heel can in some cases be equivalent to several me-ters of GM which is required to survive a given environmen-tal condition. This is the reason why the test methods 。ウウッ」ゥセ
ated with the "Stockholm Agreement" demand at least I deg heel towards the damaged side of the model in the initial dam-aged condition. The same document would not accept the fi-nal heel of the model away from the damage after the end of each individual test away from the damage either.
A final comment on the analysis of the large amount of test data is that it would have been nice to see the data related to the Stockholm Agreement's specification of additional water elevation on the bulkhead deck as a function of residual free-board and sea states.
This would have been particularly valuable since this spec-ification is based on a fairly limited amount of data (additional reference) and has not to our knowledge been substantiated for other ship types and sizes.
Additional reference
DAMSGAARD, A., and SCHINDLER, M.S., "Model Tests for
De-termining Water Ingress and Accumulation," International Seminar on the Safety of Passenger ROIRO Vessels, RINA, London, June 1996. Bruce L. Hutchison, Member
I would like to congratulate the authors on their continued excellent contributions to the technical literature regarding the safety of damaged vessels in waves. As noted in the paper, earlier similar work at IMD was contributed to the IMO Panel of Experts following the Estonia disaster, and those earlier test results also informed and inspired the analytical work of the SNAME Ad Hod ROIRO Safety Panel regarding the accumu-lation of water on deck.
The present work considers a hull form typical of North American ROIRO ferries and provides valuable data insight into the effects of casings and the benefits of freeing ports.
The experimental studies of the depth of water accumula-tion on deck are of special significance because the IMO Panel of Experts recommendations called for new stability regulations requiring ROIRO passenger vessels to meet SOLAS 90 resid-ual stability criteria when burdened with water on deck, and the SNAME Ad Hoc ROIRO Safety Panel made similar rec-ommendations.
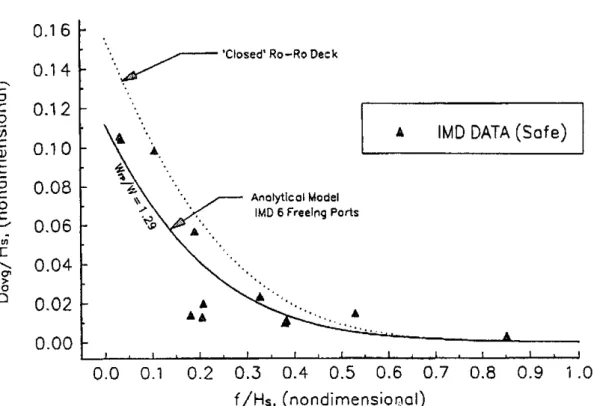
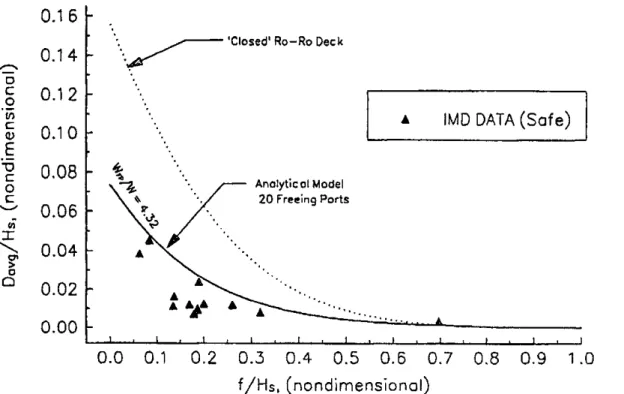
Figures 6 through II of the present paper compare, for dif-ferent freeing port and casing atTangements, experimental data for nondimensional depth of water on deck with the analytical carve determined hy the SNAME Ad Hoc ROIRO Safety Panel. An often overlooked contribution of the SNAME Ad Hoc Panel was an analytical model for the depth of water on deck when the vessel is provided with flow biased freeing ports. FigureS 20-23 herewith compare the predictions of the SNAME ana-lytical model with the model tests. Only the "safe" points fr.om the IMD tests are used for comparison. The agreement isfalrly
good, except perhaps at the very lowest values offlHs'In
gen-eral the test data seem to indicate slightly better perfonnance in terms of reduced depths of water on deck than the SNAME analytical model, which is therefore generally conservative.
The present paper makes it quite clear that casings increase the depth of water on deck and decrease survivability, andHィ。セ flow biased freeing ports decrease the depth of water on deck
AVERAGE WATER DEPTH ON DECK
IMD 6 Freeing Ports' with Cosing
Analytical Model
IMD 6 FreeIng Ports
...セ 'Closed' Ro-Ro Deck
IMD DATA (Safe)
I
A '" '..
..
..
..
....
0.16
0.14
.,;;::-0c:
0.12
0 .iiic:
0.10
Q)E
"00.08
c:
0c:
0.06
-....; .;; I ...0.04
CI' > 0 00.02
0.00
0.0
0.1
0.2
0.3
0.4
0.5
0.6
0.7
0.8
0.9
1.0
f
/Hs.
(nondimensioJ;)al)
Fig.20 SNAME analytical model compared with model test data with six freeing ports per side and a centertine casing.
AVERAGE WATER DEPTH ON DECK,
IMD 6 Freeing Ports per Side without Casing
j
0.16
0.14
...•.•セ 'Closed' Ro-Ro Deckセ
0
C
0.12
I
.2
IMD DATA (Safe)
VJ
..
c:
0.10
Q)E
..
"00.08
セ
cX
M.",,,,""",
0c:
1-
". 6 Freeing Ports -....;0.06
セ . '. Without CO:5ing"
.;;
Nセ I...
0.04
..
'"
..
>..
0 00.02
..
....
セ..
..
'..
" ....
0.00
...
"...
0.0
0.1
0.2
0.3
0.4
0.5
0.6
0.7
0.8
0.9
1.0
f
/Hs.
(nondimensional)
Fig. 21 SNAME analytical model compared with model test data with six freeing ports per side but no centerline casing.
0.16
0.14
---
Dc
0.12
0 In c:0.10
Q)E
"00.08
c: 0c
セ0.06
Iii I '-.,0.04
g-o 00.02
0.00
AVERAGE WATER DEPTH ON DECK
IMD 20 Freeing Ports with Casing
..•...セ 'Closed' Ro-Ro Deck
ol
IMD DATA (Safe)
I
'"
セ
X....
.
AnolyticolModel ....
"', 20 Freeing Ports.
' - ; ' "
ol '. '" ...0.0
0.1
0.2
0.3
0.4
0.5
0.6
0.7
0.8
0.9
1.0
f/Hs, (nondimensional)
Fig. 22 SNAME analytical model compared with model test data with twenty freeing ports per side and a centerline casing.
AVERAGE WATER DEPTH ON DECK
IMD 20 Freeing Ports per Side Without Casing
Fig. 23 SNAME analytical model compared with model test data with twenty freeing ports per side but no centerline casing.
318
0.16
0.14
---
Dc
0.12
.Q
Inc
0.10
Q)E
-00.08
c
0 c: セ0.06
Iii I '-.,0.04
'"
> 0 00.02
0.00
...セ 'Closed' Ro-Ro Deck
ol
IMD DATA (Safe)
I
Analytical Model
20 Freeing Ports per Side
Without Casing
W"/We 4.J2
M
MMBGZZZセMセセZZBZBZGGG[NN[N[GG
...
0.0
0.1
0.2
0.3
0.4
0.5
0.6
0.7
0.8
0.9
1.0
f/H s. (nondimensionol)
Technical&Research Session
ti n n 1< g; 10 ul