DOI 10.1007/s11548-009-0290-5 O R I G I NA L A RT I C L E
Guided review by frequent itemset mining: additional evidence
for plaque detection
Stefan C. Saur · Hatem Alkadhi · Lotus Desbiolles · Thomas J. Fuchs · Gábor Székely · Philippe C. Cattin
Received: 3 September 2008 / Accepted: 1 February 2009 / Published online: 11 March 2009 © CARS 2009
Abstract
Purpose A guided review process to support manual cor-onary plaque detection in computed tomography corcor-onary angiography (CTCA) data sets is proposed. The method learns the spatial plaque distribution patterns by using the frequent itemset mining algorithm and uses this knowledge to predict potentially missed plaques during detection.
Materials and methods Plaque distribution patterns from
252 manually labeled patients who underwent CTCA were included. For various cross-validations a labeling with miss-ing plaques was created from the initial manual ground truth labeling. Frequent itemset mining was used to learn the spa-tial plaque distribution patterns in form of association rules from a training set. These rules were then applied on a testing set to search for segments in the coronary tree showing evi-dence of containing unlabeled plaques. The segments with potentially missed plaques were finally reviewed for the exis-tence of plaques. The proposed guided review was compared to a weighted random approach that considered only the prob-ability of occurrence for a plaque in a specific segment and not its spatial correlation to other plaques.
S. C. Saur· G. Székely · P. C. Cattin
Computer Vision Laboratory, ETH Zurich, Zurich, Switzerland H. Alkadhi· L. Desbiolles
Institute of Diagnostic Radiology, University Hospital Zurich, Zurich, Switzerland
T. J. Fuchs
Department of Computer Science, ETH Zurich, Zurich, Switzerland
P. C. Cattin (
B
)Medical Image Analysis Center (MIAC), University Hospital of Basel, Spitalstrasse 21, 4031 Basel, Switzerland
e-mail: [email protected]
Results Guided review by frequent itemset mining performed significantly better ( p < 0.001) than the refer-ence weighted random approach in predicting coronary seg-ments with initially missed plaques. Up to 47% of the initially removed plaques were refound by only reviewing 4.4% of all possible segments.
Conclusions The spatial distribution patterns of
atheroscle-rosis in coronary arteries can be used to predict potentially missed plaques by a guided review with frequent itemset min-ing. It shows potential to reduce the intra- and inter-observer variability.
Keywords Computed tomography· Plaque · Plaque distribution patterns· Spatial distribution · Data mining
Introduction
In the western world, coronary heart diseases (CHD) account for approximately 40% of deaths in both the male and female population [1]. Coronary plaques may rupture and lead to acute coronary syndromes [2]. Thus, a correct localization and characterization is necessary. Computed tomography coronary angiography (CTCA) is today a widely used modal-ity for the non-invasive assessment of coronary arteries. Its diagnostic performance for the detection of stenoses in comparison with catheter angiography has been amply doc-umented [3–5]. Being a cross-sectional imaging modality, CTCA also allows the detection and characterization of plaques [6–10]. Although automatic approaches have been proposed [11] for plaque detection in CTCA images, plaques are still mainly manually detected which results in both an intra- and inter-observer variability. Therefore, a second read-ing to reduce this variability would be needed. Due to time constraints, this second reading is normally omitted. So it
would be preferable to make the first reading more robust by using computer aided tools.
Frequent itemset mining is an algorithm to derive relations among observed items. Originally, it was used for market basket analyses [12]. In such analyses, patterns of products frequently bought together are searched. Nowadays, frequent itemset mining is applied in many domains to search for pat-terns among items, like in computer vision [13] or in medical applications. Chen and Chen [14] identified potential corre-lations among the states of proteins using frequent itemset mining. Huang et al. [15] used frequent itemset mining for a systematic discovery of functional modules and context-specific functional annotation of the human genome. Wright and Sittig [16] used frequent itemset mining to create an ambulatory computerized physician order entry system.
So far, only correlations between risk factors and coronary artery diseases or between risk factors and the pure exis-tence of plaques were researched. Couturier et al. [17] relied on frequent itemset mining on the STULONG database to identify different patient groups on the basis of risk factors. Hausleiter et al. [7] researched the relation between non-calcified plaques and coronary artery diseases (CAD). The localization of thin cap fibroatheromas [18,19], ruptured plaques [18,20], stenoses [21], and occlusions [22] within the coronary artery tree have been reported. Shimada et al. [23] assessed the circumferential distribution pattern of plaques at bifurcations. Differences in calcification patterns in patients with acute coronary syndromes versus those with stable angina pectoris have been shown [24–27]. Ehara et al. [25] further reported typical patterns for patients with acute myocardial infarction, acute coronary syndromes, and stable angina pectoris.
In the aforementioned studies, all plaques have been regarded independently. A possible correlation among the localization of plaques within the coronary artery tree was not regarded. This study proposes a guided review by frequent itemset mining that uses these spatial distribution patterns to predict segments containing potentially missed plaques and thus support the manual plaque detection of a radiolo-gist.
Materials and methods
Patients
Coronary plaque distribution patterns of 252 consecutive patients (86 females, 166 males, mean age 64.5 ± 11.6, age range 28–88 years) who underwent CTCA for clinical indications are included. The retrospective study design was approved by the local ethic committee which waived the writ-ten informed consent requirement.
CT data acquisition and analysis
All patients were scanned on a dual-source CT scanner (Somatom Definition, Siemens Medical Solutions, Forch-heim, Germany) following a standard CTCA protocol previ-ously described in detail [4]. A graphical user interface has been developed with MeVisLab software (MeVis Research, Bremen, Germany) for the manual labeling of the coronary plaques.
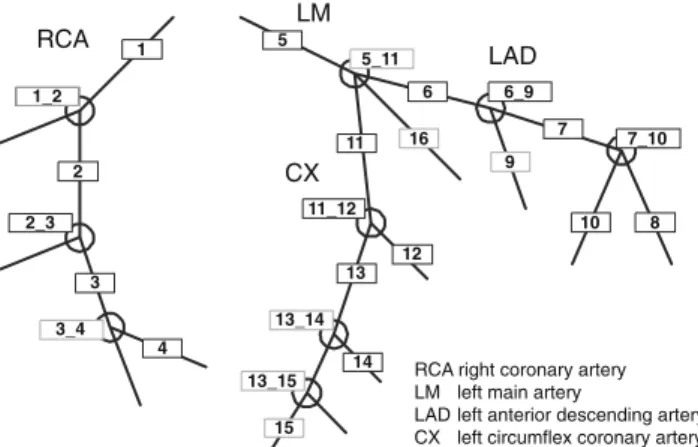
An experienced radiologist (with 7 years of experience in cardiovascular imaging) determined type, position, and the degree of stenosis for each plaque. Three different types of plaques are differentiated: hard plaques indicating purely calcified plaques, mixed plaques indicating a mixture of cal-cified and non-calcal-cified plaques, and soft plaques indicating purely non-calcified plaques. The position of the plaque is defined according to the scheme proposed by the American Heart Association [28] (Fig.1).
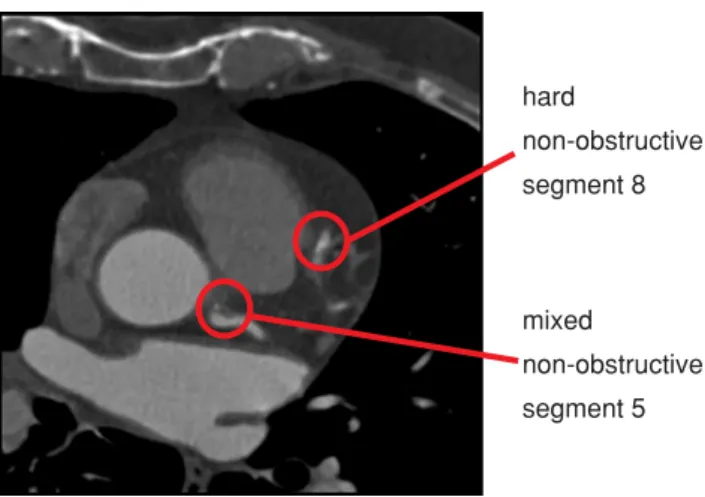
In addition to the 16 coronary segments, the 9 bifurcations of the model are also included as these are preferred loca-tions for the development of plaques. If a plaque is extended over more than one segment, it is labeled according to its most proximal position. For the degree of stenosis, two val-ues are distinguished, namely obstructive for a stenosis with a degree greater than 50% and non-obstructive otherwise. Figure2exemplarily depicts an axial CTCA slice showing two plaques with their corresponding manual labeling. Frequent itemset mining
Frequent itemset mining [12] is used to determine rules that describe spatial correlations between plaques. The method was introduced by Agrawal et al. [12] and was driven by market basket analysis. In such an analysis, the items in
1_2 2_3 3_4 10 7_10 6_9 5_11 11_12 13_14 13_15 8 16 11 1 2 3 4 5 6 9 7 12 13 14 15
RCA right coronary artery LM left main artery
LAD left anterior descending artery CX left circumflex coronary artery
RCA
LAD
CX LM
Fig. 1 Each detected plaque was assigned to one of 25 positions. In addition to the 16 segments from the coronary artery tree model pro-posed by the American Heart Association, the 9 bifurcations in this model were also included as possible positions
mixed non-obstructive segment 5 hard non-obstructive segment 8
Fig. 2 Axial slice from a CTCA data set of the human heart. For ground truth, coronary plaques (indicated by red circles) were manually labeled by an experienced radiologist according to their type, degree of stenosis and segment position within the coronary artery tree. This information was then used to learn spatial plaque distribution patterns
customers’ baskets are analyzed to find sets of products that are frequently bought together. After the observation of a number of baskets, so-called association rules can be derived to express the probability that—given a set of items
(item-set) in a basket—a certain other item is also present. These
association rules represent statistical correlations which can be used to research the dependencies among items and to predict the content of new baskets if only some items are given.
In this study, a patient corresponds to a basket. Multiple items are assigned to each plaque to describe its position in different hierarchical levels.
Itemset. The whole set of items created per patient is referred
to as an observation. The patient’s gender is considered by assigning either the item gender_male or gender_ female to an observation. For the plaque position, a multi-scale approach in form of an itemset tree was developed to assign several items per plaque position. This allows the statistical analysis within and between different levels, i.e. it is possi-ble to extract correlations between various segments but also between segments and certain areas (left, right, proximal, distal, …) of the coronary tree.
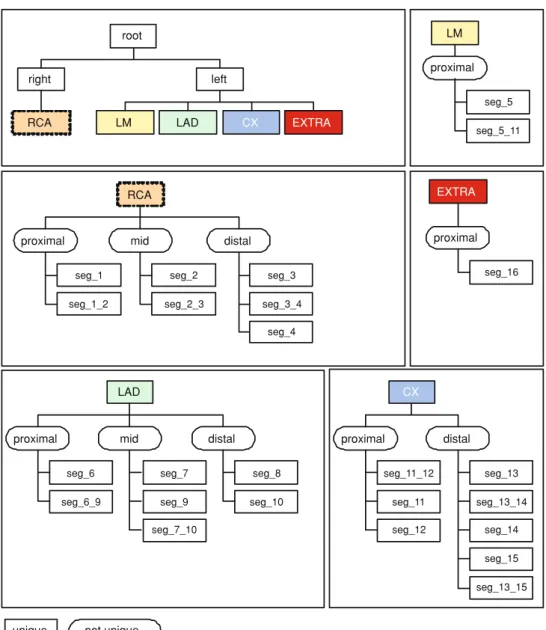
The proposed itemset tree (Figs.3and4) consists of six hierarchical levels:
1. It is distinguished whether a plaque is in the left or right coronary artery tree.
2. The position is further specified as right coronary artery (RCA), left main artery (LM), left anterior descending artery (LAD), left circumflex artery (CX), or segment 16 (EXTRA) which was not present in each patient’s anat-omy.
3. The relative position within one of the main coronary arteries is determined. A plaque is either proximal, mid, or distal.
4. The actual position seg_x in one of the segments of the coronary artery tree is regarded.
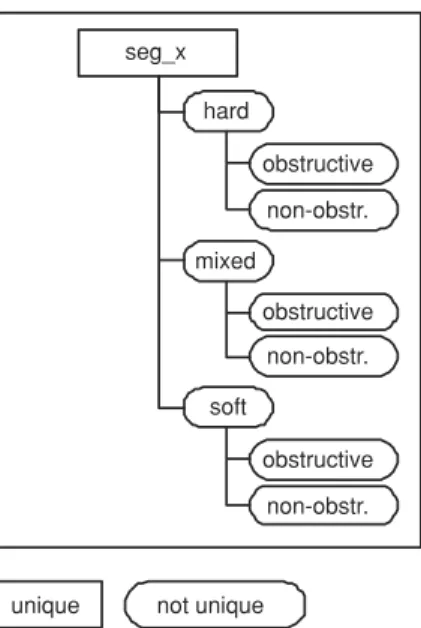
5. The plaque type is distinguished, namely hard, mixed, or
soft.
6. The plaque is either obstructive or non-obstructive.
Some items like the relative positions proximal, mid, or
distal are not unique as they appear in different branches
of the itemset tree. Therefore, those items—indicated by an elliptical shape in Figs.3and4—are combined with all unique items found while going up the itemset tree from the corresponding item to the root of the tree. Hence, the non unique item proximal in the right coronary artery tree, for example, is specified by the unique items RCA_proximal and
right_proximal. The items for an observation are created by
computing the union set of the items created for the various labeled plaques of a patient. The items for a labeled plaque are obtained by starting from the leaf in the itemset tree that describes the plaque and taking all items found while going from the leaf to the root. A soft plaque in segment 1 of a male patient will, therefore, get the following labels: gender_male,
right, rca, rca_proximal, right_proximal, seg_1, seg_1_soft, rca_soft, right_soft. For each patient, an observation is
com-puted by the previously described method.
Association rules. An association rule has the form
“con-ditions→ conclusion (support, confidence)” and expresses a relation of one or more items—the conditions—and one item as the conclusion. The quality of an association rule is expressed by its support and confidence measure. The
sup-port [29] of an association rule is the percentage of cases in which it applies in the training set. The confidence [12] of an association rule is the percentage of cases in which the rule is correct relative to the number of cases in which it is applicable, i.e. the conditions are met. An example associa-tion rule might be “seg_2, seg_3→ seg_1 (40%, 95%)”. So with the knowledge that plaques are present in “seg_2” and “seg_3”—which was true in 40% of all observations in the training data set—there is a probability of 95% that also a plaque in “seg_1” is present.
The software program apriori, a frequent itemset mining tool presented in [29], is used to determine association rules based on the given observations. The minimum confidence minconf and minimum support minsupp value for an associ-ation rule can be selected as parameters. Rules that have a confidence or support value below the selected minimum are discarded. The computed association rules are then filtered to only keep non trivial rules. An example of a discarded trivial rule would be “LAD→ left” as it is obvious that the LAD is per definition in the left coronary artery tree.
Fig. 3 Each plaque is described by a set of items. The items are derived from a developed itemset tree. The multi-scale approach in form of a tree allowed the statistical analysis of the plaque
distribution within and between different levels. The itemset tree consists of six levels whereof level one (left/right), level two (RCA/LM/LAD/CX/EXTRA), level three
(proximal/mid/distal), and level four (segment within the coronary artery tree) are illustrated in this figure
root right left LAD CX EXTRA LM RCA proximal LM seg_5 seg_5_11 RCA seg_1_2 mid distal proximal seg_1 seg_2 seg_2_3 seg_3 seg_3_4 seg_4 EXTRA LAD CX proximal seg_6 seg_6_9 mid seg_7 seg_9 seg_7_10 distal seg_8 seg_10 proximal seg_16 proximal distal seg_11 seg_11_12 seg_12 seg_13 seg_13_14 seg_13_15 seg_14 seg_15
unique not unique
Guided review
As an application that benefits from the acquired knowledge of the spatial plaque distribution patterns we introduce a guided review process. This guided review supports the radi-ologist by proposing additional segments to review, as they might contain initially missed plaques. For this, the current state of labeled plaques is taken and the association rules are searched for potentially not labeled plaques.
Guided review by frequent itemset mining is validated by simulating various settings of initially missed plaques. The quality of the segments proposed by frequent itemset mining is compared to a weighted random approach for the selec-tion of segments. Further, a parameter study discusses the selected parameter setting for the validation by showing the impact of the two parameters for frequent itemset mining, namely min and min .
Segment selection by frequent itemset mining
The plaque distribution of each patient is regarded separately: Given the observed items of each patient as possible val-ues for the conditions items, it is tested if there are associ-ation rules indicating the presence of additional plaques in segments not labeled yet. All segments where association rules match the form “any combination of observed items
−>seg_x” are then stored in a list Lreviewof segments to be reviewed.
Segment selection by weighted random approach.
A weighted random approach to select segments of poten-tially missed plaques is chosen as a benchmark as it repre-sents the most intuitive way to select segments for review: those segments where in general many plaques occur have
unique not unique seg_x hard obstructive non-obstr. mixed obstructive non-obstr. soft obstructive non-obstr.
Fig. 4 The itemset tree consists of six levels whereof level five (hard/mixed/soft) and level six (obstructive/non-obstructive) are illus-trated in this figure
a higher probability of containing missed plaques. So, given the plaques of the current labeling for all patients, the prob-ability
pi =
# of plaques in segment i total # of plaques
is computed that a plaque occurs in segment i . Then nreview segments having no labeled plaques are chosen by a random number generator weighted with the probability pi for each segment.
Validation and parameter study
For each measurement, the study population of 252 patients is randomly divided into a training set (70%, or 176 patients) and a testing set (30%, or 76 patients). The association rules are computed based on the observations from the training set. In order to get an incomplete labeling, psegmentspercent of the plaques in the testing set are randomly removed. This parameter is introduced to simulate radiologists who initially missed a different number of plaques. The incomplete label-ing of the testlabel-ing set is then taken to compute the list Lreview containing nreviewsegments with potentially missed plaques. All segments in Lreview are evaluated if plaques were ini-tially present in the ground truth labeling. The number nfound finally represents the number of segments where initially removed plaques are refound through the guided review. For comparison, the same number of segments proposed by frequent itemset mining is also chosen using the weighted random approach and evaluated for the presence of initially missed plaques. Simulations are done with varying values
for psegments, minconf and minsupp. Each measurement was repeated 100 times to get statistically more reliable results. Statistical analysis
All statistical analyses are performed by using the statistical software package R (Version 2.7.1 for Windows,http://www. r-project.org). For each parameter setting a paired Student’s t-test was used to compare the detection ratio between the results of guided review by frequent itemset mining and guided review by the weighted random approach.
Results
From the 252 patients of the study population, 200 patients showed to have at least one plaque in their coronary arteries. In total, 1229 plaques (990 hard, 227 mixed, 12 soft) were manually labeled.
Guided review
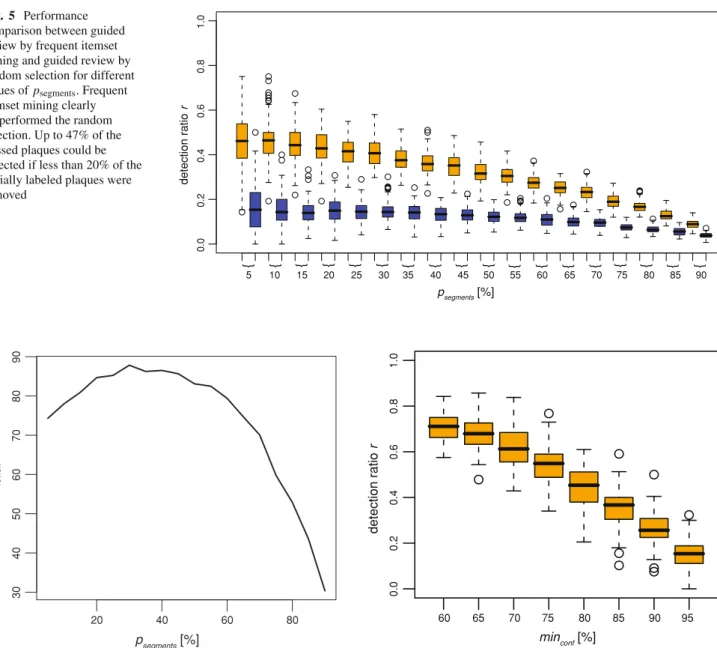
Guided review by frequent itemset mining clearly outper-formed ( p< 0.001) the weighted random selection approach in terms of the detection ratio r = nfound/nsegmentwhich is defined as the quotient between the number nfoundof found plaques and the number nsegmentof removed plaques. With the guidance of frequent itemset mining up to 47% of the initially removed plaques could be refound.
As it is generally not known how many plaques have been missed, psegments was varied between 5 and 95% in steps of 5%. Figure5shows boxplots of the detection ratio r for both the guided review by frequent itemset mining and the weighted random approach. The number of reviewed seg-ments in dependence of psegmentsis shown in Fig.6. On aver-age 84 segments—or 1.1 segments per patient—had to be reviewed if less then 50% of the initial labeled plaques were removed. For larger values of psegments, the performance of guided review by frequent itemset mining dropped which was predicable as in these cases, the available labeling is really sparse. So only a few association rules are valid from which segments to be reviewed could be determined.
The impact of the frequent itemset mining parameters minsupp and minconf on the outcome of the guided review was evaluated by varying the corresponding parameter while keeping the remaining parameters fixed.
The confidence expresses a probability that an associa-tion rule is valid when its condiassocia-tions are met. It can thus be expected that while using association rules with low con-fidence values, more segments have to be reviewed until a missed plaque is detected. To evaluate the impact of the con-fidence value, minconf was varied between 60 and 95% in steps of 5% whereas the remaining parameters were kept
Fig. 5 Performance comparison between guided review by frequent itemset mining and guided review by random selection for different values of psegments. Frequent
itemset mining clearly outperformed the random selection. Up to 47% of the missed plaques could be detected if less than 20% of the initially labeled plaques were removed 0.0 0 .2 0.4 0.6 0.8 1.0 detection ratio r } } } } } } } } } } } } } } } } } } psegments [%] 5 10 15 20 25 30 35 40 45 50 55 60 65 70 75 80 85 90 20 40 60 80 30 40 50 60 70 80 90 nreview psegments [%]
Fig. 6 Number of segments nreviewproposed by frequent itemset
min-ing for guided review. Above a certain percentage psegmentsof initially
removed plaques, the labeling was too sparse such that only a small number of segments to be reviewed were proposed
constant, i.e. psegments= 15% and minsupp= 15%. Figure7 shows the detection ratio r in dependence of the selected confidence level.
In general, a lower bound for the confidence value led to a higher percentage of detected plaques as with a small con-fidence value more rules and, therefore, more segments for review are created. A drawback of this higher detection ratio is, however, the higher number of segments to be reviewed (Fig.8a).
Figure8b finally confirms the initial expectation that with higher confidence values less segments had to be reviewed to detect an initially missed plaque.
60 70 80 90 0.0 0 .2 0.4 0.6 0.8 1.0 detection ratio r 65 75 85 95 minconf [%]
Fig. 7 Impact of the minimum confidence parameter minconf on the
detection ratio r . Less plaques were detected with higher values for minconf
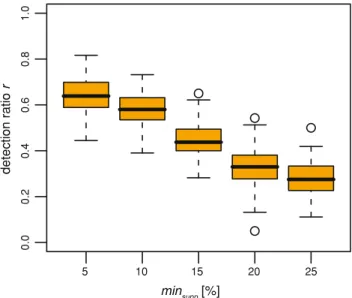
The support of a rule is a measure of its generality. A small value indicates that the rule was created from observations in only a small number of cases and, therefore, might depend more on the selection of the study population than a rule with a high support value. To evaluate the impact of the support value, minsupp was varied between 5 and 25% in steps of 5%, whereas the remaining parameters where kept constant, i.e. psegments = 15% and minconf = 80%. Figure9shows the detection ratio r in dependence of the selected minimum support value. A lower bound for the support value led to a higher percentage of detected plaques but also required a higher number of segments to be reviewed (Fig. 10a). Figure 10b finally shows the average number of detected initially missed plaques per reviewed segment.
minconf [%] nreview (a) nsegments /nreview minconf [%] (b) 60 70 80 90 50 100 150 200 0.10 0.15 0 .20 0.25 0.30 0.35 0.40 60 70 80 90
Fig. 8 Impact of the minimum confidence parameter minconfon a the
number of segments nreviewto be reviewed and on b the average number
of found plaques per reviewed segment. The number of segments to be reviewed declined with an increasing value for minconf
0.0 0.2 0.4 0.6 0.8 1.0 detection ratio r minsupp [%] 5 10 15 20 25
Fig. 9 Impact of the minimum support parameter minsuppon the
detec-tion ratio r . Less plaques were detected with higher values for minsupp
Considering the investigation above, the joint distribution of minsupp and minconf does not contain one distinct opti-mum. Hence, for the guided review the parameters minsupp= 15.0 and minconf = 80.0 were chosen as a good trade-off between the detection ratio and the number of segments to review. For this parameter setting, over 70,000 associations rules describing correlations between the spatial distributions of the 1,229 labeled plaques were obtained. Table1 exempl-arily shows association rules with different conditions indi-cating the presence of a plaque in segment 1.
60 80 100 120 140 160 0.15 0.20 0.25 0.30 minsupp [%] nreview (a) nsegments /n review minsupp [%] (b) 5 10 15 20 25 5 10 15 20 25
Fig. 10 Impact of the minimum support parameter minsuppon a the
number of segments nreviewto be reviewed and on b the average number
of found plaques per reviewed segment. The number of segments to be reviewed declined with an increasing value for minsupp
Table 1 Example of association rules indicating the presence of a plaque in segment 1 of the coronary artery tree
Condition(s) Conclusion [support (%),
confidence (%)] Segment 2, segment 7 → Segment 1 (17.1, 93.0) Segment 7, segment 11 → Segment 1 (17.9, 80.0)
Segment 13 → Segment 1 (17.5, 81.8)
Segment 3, segment 5 → Segment 1 (15.9, 95.0) Segment 3, segment 7 → Segment 1 (16.3, 90.2) Segment 3, segment 6 → Segment 1 (21.8, 85.5) Segment 2, segment 5 → Segment 1 (17.9, 91.1) LAD, segment 13 → Segment 1 (17.5, 81.8)
CX distal → Segment 1 (19.4, 81.6)
Discussion
This paper proposes a guided review of coronary segments for improved manual detection of plaques based on observed spatial distribution patterns of coronary plaques.
The method—based on frequent itemset mining—can be used to support the manual plaque detection process by list-ing coronary segments of potentially missed plaques. This can be realized either as an online- or an offline-tool. In the first case, the current labeling of a reader would be auto-matically analyzed and segments of potential plaque loca-tions would be highlighted while the reader is still detecting plaques. In the latter case, the guided review would be man-ually triggered after the labeling and a list of segments with potentially missed plaques would then be highlighted to the reader. Through this targeted review of specific segments
the observer variability can be decreased such that a time-consuming manual second reading—lasting on average 4 min for an experienced reader—might be avoided.
The proposed method is a tool to assist the manual detec-tion of coronary plaques by guiding the reader to specific segments of potentially missed plaques. Guided review is thereby independent of the underlying applied imaging modality because it only uses knowledge about the segments where plaques have been detected. The plaque detection itself as well as a subsequent classification and quantification of plaques is up to the reader who might get support for this task by additional existing tools and measures for the assessment of plaques [30–33].This study investigated the correlation of the spatial plaque distribution with frequent itemset mining expressed in association rules. Those association rules were used for a guided review by indicating segments with possi-bly missed plaques. The validation showed that up to 47% of the removed plaques could be refound by reviewing 84 seg-ments, corresponding to only 4.4% of all segments. With the same number of reviewed segments, the weighted random approach revealed only 16% of the removed plaques. As no clear optimum could be determined, a parameter pair for fre-quent itemset mining was empirically chosen that showed a good trade-off between the number of detected plaques and the number of segments that had to be reviewed for their detection. In general, it would be preferable to select associ-ation rules with higher support values as a high support value denotes that the association rule was applicable for a large number of observations. Thus, such rules could be regarded as universally valid.
Although being developed and evaluated to support the detection of coronary plaques, guided review by frequent itemset mining can also be applied to other arterial beds, for example the carotids. For this, only the definition of the item-set has to be adopted. In this study, the basis of the itemitem-set was the 16-segment coronary tree of the American Heart Associ-ation [28]. In general, there is no restriction on the selection for the items. However, it would be desirable to choose the items for a specific arterial bed according to some recognized model. In doing so, labelings from various centers might be used to learn statistical patterns from a larger set of patients. In future studies, guided review by frequent itemset min-ing will be introduced into the clinical praxis to prove its potential to decrease the intra- and inter-observer variability and, therefore, improve the plaque detection process itself by making it more robust. For this study, the time-consum-ing labeltime-consum-ing was done by one stime-consum-ingle reader such that an observer variability cannot be excluded. However, as we ran-domly removed plaques from the assumed complete labeling, observer variability had no impact on our simulations.
The results were achieved by using only correlations between the various plaque positions. Dependencies between the spatial plaque distribution pattern and the risk factors
as well as CAD were not considered. However, the guided review system can be easily extended such that in future stud-ies possible correlations between risk factors and the spa-tial plaque distribution can be included. Further, it would be desirable to include more patients in the training data to obtain more generalized rules.
Conclusion
This study evaluated the distribution patterns of plaques in coronary arteries. Spatial correlations were determined with frequent itemset mining expressed by association rules. A guided review process was proposed that uses these rules to identify segments in the coronary artery tree having a high probability for containing plaques that were initially missed. The verification has confirmed that guided review by fre-quent itemset mining performed significantly better than a weighted random approach which makes it a promising tool supporting plaque detection.
Acknowledgments This research has been supported by the CO-ME/NCCR research network of the Swiss National Science Foun-dation (http://co-me.ch). The authors thank MeVis Research (Bremen, Germany) for supporting the study.
References
1. Jougla E (2003) Health Statistics—Atlas on mortality in the Euro-pean Union. EuroEuro-pean Communities
2. Shinohara M, Yamashita T, Tawa H et al (2008) Atherosclerotic plaque imaging using phase-contrast X-ray computed tomography. Am J Physiol Heart Circ Physiol 294(2):H1094–H1100. doi:10. 1152/ajpheart.01149.2007
3. Alkadhi H, Scheffel H, Desbiolles L et al (2008) Dual-source computed tomography coronary angiography: influence of obes-ity, calcium load, and heart rate on diagnostic accuracy. Eur Heart J 29(6):766–776. doi:10.1093/eurheartj/ehn044
4. Leschka S, Alkadhi H, Plass A et al (2005) Accuracy of MSCT coronary angiography with 64-slice technology: first experience. Eur Heart J 26(15):1482–1487. doi:10.1093/eurheartj/ehi261 5. Scheffel H, Alkadhi H, Leschka S et al (2008) Low-dose CT
cor-onary angiography in the step-and-shoot mode: diagnostic perfor-mance. Heart 94(9):1132–1137. doi:10.1136/hrt.2008.149971 6. Achenbach S, Moselewski F, Ropers D et al (2004)
Detec-tion of calcified and noncalcified coronary atherosclerotic plaque by contrast-enhanced, submillimeter multidetector spiral com-puted tomography: a segment-based comparison with intravas-cular ultrasound. Circulation 109(1):14–17. doi:10.1161/01.CIR. 0000111517.69230.0F
7. Hausleiter J, Meyer T, Hadamitzky M et al (2006) Prevalence of noncalcified coronary plaques by 64-slice computed tomogra-phy in patients with an intermediate risk for significant coronary artery disease. J Am Coll Cardiol 48(2):312–318. doi:10.1016/j. jacc.2006.02.064
8. Hoffmann U, Moselewski F, Nieman K et al (2006) Noninvasive assessment of plaque morphology and composition in culprit and stable lesions in acute coronary syndrome and stable lesions in stable angina by multidetector computed tomography. J Am Coll Cardiol 47(8):1655–1662. doi:10.1016/j.jacc.2006.01.041
9. Leber AW, Knez A, Becker A et al (2005) Visualising noncalcified coronary plaques by CT. Int J Cardiovasc Imaging 21(1):55–61. formerly Cardiac Imaging. doi:10.1007/s10554-004-5337-7 10. Leber AW, Knez A, von Ziegler F et al (2005) Quantification of
obstructive and nonobstructive coronary lesions by 64-slice com-puted tomography: a comparative study with quantitative coro-nary angiography and intravascular ultrasound. J Am Coll Cardiol 46(1):147–154. doi:10.1016/j.jacc.2005.03.071
11. Saur SC, Alkadhi H, Desbiolles L et al (2008) Automatic detec-tion of calcified coronary plaques in computed tomography data sets. In: Medical image computing and computer-assisted inter-vention—MICCAI 2008. Springer, New York. doi: 10.1007/978-3-540-85988-8_21
12. Agrawal R, Imieli´nski T, Swami A (1993) Mining association rules between sets of items in large databases. In: Proceedings of the 1993 ACM SIGMOD international conference on Management of data. Washington, D.C., pp 207–216
13. Quack T, Ferrari V, Leibe B et al (2007) Efficient mining of fre-quent and distinctive feature configurations. In: International con-ference on computer vision. Rio de Janeiro, Brasil. doi:10.1109/ ICCV.2007.4408906
14. Chen Q, Chen Y-P (2006) Mining frequent patterns for AMP-acti-vated protein kinase regulation on skeletal muscle. BMC Bioinfor-matics 7(1):394. doi:10.1186/1471-2105-7-394
15. Huang Y, Li H, Hu H et al (2007) Systematic discovery of functional modules and context-specific functional annotation of human genome. Bioinformatics 23(13):i222–i229. doi:10.1093/ bioinformatics/btm222
16. Wright A, Sittig DF (2006) Automated development of order sets and corollary orders by data mining in an ambulatory computer-ized physician order entry system. In: AMIA annual symposium proceedings
17. Couturier O, Delalin H, Fu H et al (2004) A three-step approach for STULONG database analysis: characterization of patients’ groups. In: ECML-PKDD discovery challenge
18. Cheruvu PK, Finn AV, Gardner C et al (2007) Frequency and distribution of thin-cap fibroatheroma and ruptured plaques in human coronary arteries: a pathologic study. J Am Coll Cardiol 50(10):940–949. doi:10.1016/j.jacc.2007.04.086
19. Virmani R, Burke AP, Farb A et al (2006) Pathology of the vul-nerable plaque. J Am Coll Cardiol 47(8):C13–C18. doi:10.1016/j. jacc.2005.10.065
20. Pregowski J, Tyczynski P, Mintz GS et al (2006) Intravascular ultra-sound assessment of the spatial distribution of ruptured coronary plaques in the left anterior descending coronary artery. Am Heart J 151(4):898–901. doi:10.1016/j.ahj.2005.06.019
21. Maehara A, Mintz GS, Castagna MT et al (2001) Intravascu-lar ultrasound assessment of the stenoses location and morphol-ogy in the left main coronary artery in relation to anatomic left main length. Am J Cardiol 88(1):1–4. doi: 10.1016/S0002-9149(01)01575-2
22. Wang JC, Normand S-LT, Mauri L et al (2004) Coronary artery spa-tial distribution of acute myocardial infarction occlusions. Circula-tion 110(3):278–284. doi:10.1161/01.CIR.0000135468.67850.F4 23. Shimada Y, Courtney BK, Nakamura M et al (2006) Intravascular
ultrasonic analysis of atherosclerotic vessel remodeling and plaque distribution of stenotic left anterior descending coronary arterial bifurcation lesions upstream and downstream of the side branch. Am J Cardiol 98(2):193–196. doi:10.1016/j.amjcard.2006.01.073 24. Beckman JA, Ganz J, Creager MA et al (2001) Relationship of clinical presentation and calcification of culprit coronary artery ste-noses. Arterioscler Thromb Vasc Biol 21(10):1618–1622. doi:10. 1161/hq0901.095554
25. Ehara S, Kobayashi Y, Yoshiyama M et al (2004) Spotty calci-fication typifies the culprit plaque in patients with acute myo-cardial infarction: an intravascular ultrasound study. Circulation 110(22):3424–3429. doi:10.1161/01.CIR.0000148131.41425.E9 26. Fujii K, Carlier SG, Mintz GS et al (2005) Intravascular ultrasound
study of patterns of calcium in ruptured coronary plaques. Am J Cardiol 96(3):352–357. doi:10.1016/j.amjcard.2005.03.074 27. Hong M-K, Mintz GS, Lee CW et al (2007) Plaque ruptures in
sta-ble angina pectoris compared with acute coronary syndrome. Int J Cardiol 114(1):78–82. doi:10.1016/j.ijcard.2006.01.008 28. Austen W, Edwards J, Frye R et al (1975) A reporting system on
patients evaluated for coronary artery disease. Report of the ad hoc committee for grading of coronary artery disease, council on cardiovascular surgery, American Heart Association. Circulation (51):5–40
29. Borgelt C, Kruse R (2002) Induction of association rules: a priori implementation. In: Conference on Computational Statistics 30. Kerwin W, Han C, Chu B et al (2001) A quantitative vascular
anal-ysis system for evaluation of atherosclerotic lesions by MRI. In: Medical image computing and computer-assisted intervention— MICCAI. pp 786–794
31. Frangi AF, Niessen WJ, Nederkoorn PJ et al (2000) Three-dimen-sional model-based stenosis quantification of the carotid arteries from contrast-enhanced MR angiography. In: Proceedings of IEEE workshop on mathematical methods in biomedical image analysis. doi:10.1109/MMBIA.2000.852367
32. Anderson RW, Stomberg C, Hahm CW et al (2007) Automated classification of atherosclerotic plaque from magnetic resonance images using predictive models. Biosystems 90(2):456–466. doi:10.1016/j.biosystems.2006.11.005
33. Wolf RL, Wehrli SL, Popescu AM et al (2005) Mineral volume and morphology in carotid plaque specimens using high-resolution MRI and CT. Arterioscler Thromb Vasc Biol 25(8):1729. doi:10. 1161/01.ATV.0000173311.39867.65