Publisher’s version / Version de l'éditeur:
Vous avez des questions? Nous pouvons vous aider. Pour communiquer directement avec un auteur, consultez la première page de la revue dans laquelle son article a été publié afin de trouver ses coordonnées. Si vous n’arrivez pas à les repérer, communiquez avec nous à [email protected].
Questions? Contact the NRC Publications Archive team at
[email protected]. If you wish to email the authors directly, please see the first page of the publication for their contact information.
https://publications-cnrc.canada.ca/fra/droits
L’accès à ce site Web et l’utilisation de son contenu sont assujettis aux conditions présentées dans le site LISEZ CES CONDITIONS ATTENTIVEMENT AVANT D’UTILISER CE SITE WEB.
Cement and Concrete Composites, 31, 8, pp. 591-600, 2009-09-01
READ THESE TERMS AND CONDITIONS CAREFULLY BEFORE USING THIS WEBSITE.
https://nrc-publications.canada.ca/eng/copyright
NRC Publications Archive Record / Notice des Archives des publications du CNRC : https://nrc-publications.canada.ca/eng/view/object/?id=9a0571ca-8f2a-432e-946c-37de5274cd67 https://publications-cnrc.canada.ca/fra/voir/objet/?id=9a0571ca-8f2a-432e-946c-37de5274cd67
NRC Publications Archive
Archives des publications du CNRC
This publication could be one of several versions: author’s original, accepted manuscript or the publisher’s version. / La version de cette publication peut être l’une des suivantes : la version prépublication de l’auteur, la version acceptée du manuscrit ou la version de l’éditeur.
For the publisher’s version, please access the DOI link below./ Pour consulter la version de l’éditeur, utilisez le lien DOI ci-dessous.
https://doi.org/10.1016/j.cemconcomp.2009.05.008
Access and use of this website and the material on it are subject to the Terms and Conditions set forth at
Nonlinear relationships between parameters of simplified diffusion-based model for service life design of concrete structures exposed to chlorides
http://www.nrc-cnrc.gc.ca/irc
N online a r re la t ionships be t w e e n pa ra m e t e rs of sim plifie d diffusion– ba se d m ode l for se rvic e life de sign of c onc re t e st ruc t ure s e x pose d t o c hloride s
N R C C - 5 0 8 0 1
Z h a n g , J . Y . ; L o u n i s , Z .
A u g u s t 2 0 0 9
A version of this document is published in / Une version de ce document se trouve dans:
Cement and Concrete Composites, 31, (8), pp. 591-600, DOI:
10.1016/j.cemconcomp.2009.05.008
The material in this document is covered by the provisions of the Copyright Act, by Canadian laws, policies, regulations and international agreements. Such provisions serve to identify the information source and, in specific instances, to prohibit reproduction of materials without written permission. For more information visit http://laws.justice.gc.ca/en/showtdm/cs/C-42
Les renseignements dans ce document sont protégés par la Loi sur le droit d'auteur, par les lois, les politiques et les règlements du Canada et des accords internationaux. Ces dispositions permettent d'identifier la source de l'information et, dans certains cas, d'interdire la copie de documents sans permission écrite. Pour obtenir de plus amples renseignements : http://lois.justice.gc.ca/fr/showtdm/cs/C-42
Nonlinear Relationships between Parameters of Simplified Diffusion–Based Model for Service Life Design of Concrete Structures Exposed to Chlorides
Jieying Zhang∗ and Zoubir Lounis
National Research Council Canada, Institute for Research in Construction, Ottawa, ON K1A 0R6, Canada
Abstract
This paper presents an approach towards a performance-based durability design of concrete structures based on a simplified diffusion-based model, which overcomes some of the limitations of the current prescriptive rules of existing design standards. Numerical nonlinear relationships and relative sensitivities between the four parameters that govern the time to corrosion initiation of reinforced concrete structures are determined, including chloride diffusion coefficient, chloride threshold value of reinforcement, concrete cover and surface chloride exposure condition. To achieve a specified design life, it is found that in aggressive chloride-laden environments: (i) increasing the minimum concrete cover is more effective than selecting a resistant steel; (ii) it is necessary to use both high performance concrete and corrosion-resistant steel; (iii) a relative decrease in the concrete cover has to be compensated by a much greater increase in the corrosion resistance of steel; and (iv) the variations in chloride diffusion coefficient has a large impact on required concrete cover and chloride threshold value, especially in increasingly aggressive environments. These relationships can be used to identify the most relevant parameters and serve as a guide for service life-based design for durable concrete structures.
∗
Keywords: chloride-induced corrosion, durability design, diffusion, nonlinear relationship, reinforced concrete structures, sensitivity, service life.
1. Introduction
Chloride-induced corrosion of steel reinforcement has been identified as one of the main causes of deterioration of concrete structures, such as highway bridges, parking structures, marine structures, etc. It has been extensively studied for decades (Stratfull[1], Gouda[2], Tuutti[3], Rosenberg et al. [4], Cady and Weyers[5]), particularly, as a result of the high costs of highway bridge repair in North America and Europe from the effects of de-icing salts used during winter or from seawater for costal structures. From a durability-design point of view, the development of a performance-based approach is critical to ensure adequate safety and serviceability throughout the design life of concrete structures such as those in chloride-laden environments, as well as to help identify appropriate maintenance strategies to extend their service life and minimize the risk of failure.
The current practice of design of durable concrete structures is mainly based on prescriptive rules, such as specifying minimum concrete cover, maximum water/cement ratio, use of corrosion-resistant reinforcing steels, limitation of crack width, etc. They are deemed to satisfy the design life requirements of safety and serviceability without providing an explicit relationship between performance and service life (Rilem Report 14[6]). However, the observed extensive deterioration and failure of a large number of reinforced and prestressed concrete structures (e.g. bridge decks, girders, etc.) in North America well before the end of their design life have illustrated the serious shortcomings of the current “deem-to-satisfy” prescriptive rules. Most of the studies found in the literature have focused on the investigation of the mechanisms
of chloride transport in concrete and reinforcing steel corrosion, as well as development of corrosion protection, repair strategies and detection techniques; however, there are few studies on the development of reliable and practical design approaches for durability design and corrosion protection of concrete structures. In order to achieve a specified design life for concrete structures, it is imperative to develop mechanistic and practical models⎯deterministic or probabilistic [6][7][8]⎯that can be used for the design of durable concrete structures, as well as for predicting the deterioration and maintenance optimization of existing concrete structures.
In this paper, the emphasis is on the durability design of new concrete structures that are built in chloride-laden environments by using practical mechanistic models. These models represent quantitatively an adequate understanding of the physico-chemical processes that induce deterioration in concrete structures, namely: (i) simplified diffusion-based model for chloride ingress into concrete; and (ii) concept of chloride threshold value as a corrosion resistance indicator of the reinforcing steel. Using these simplified models, the quantitative relationships between the critical design parameters that govern the service life of concrete structures are determined and can be used as guidance to designers on how to select the appropriate values of design parameters to achieve a specified design life.
2. Simplified mechanistic models for durability design
2.1 Fickian diffusion model for chlorides ingress into concrete
The corrosion of concrete structures can be described as a two-stage process (Tuutti[3]): (i) corrosion initiation stage; and (ii) corrosion propagation stage. The corrosion initiation stage corresponds to the process of chloride ions (chlorides) ingress into concrete (and/or carbonation, which is outside the scope of this paper) while the steel remains passivated. The corrosion
propagation stage will start after the initiation of active corrosion, and it often occurs after the chloride concentration on the steel surface reaches a certain threshold value and steel is depassivated. Therefore, the duration of the initial stage, which is often used as a quantitative indicator of service life or durability of concrete structures, depends on the rate of chloride penetration in concrete. The needs to predict the service life of existing structures and to design more durable structures, as well as to extend their service life through effective maintenance strategies, are the objectives of the extensive efforts for modeling chloride ingress, corrosion initiation, and corrosion propagation in concrete structures in the last three decades [1-6].
Aggressive agents such as chloride, water, and oxygen penetrate into concrete through the pore spaces and micro-cracks in the cement paste matrix as well as at the paste/aggregate interface. The rate of penetration is dependent primarily on the quality of concrete and more particularly on the water-cement ratio of the concrete mix, the presence of supplementary cementing materials (e.g. silica fume, fly ash, or slag), and/or protective systems that delay or slow down chloride ingress. In porous solids, such as concrete, chlorides can penetrate concrete via different physical mechanisms, such as diffusion, capillary absorption, electrical migration, and permeation due to hydraulic pressure heads (Kropp 1995). Furthermore, the penetration process is also influenced by chemical reaction such as chloride binding.
Among the multiple transport mechanisms, diffusion and absorption have been extensively studied. Absorption mostly occurs in concrete surface layers that are subjected to wetting and drying cycles, and it only affects the exposed concrete surface down to 10-20 mm (Weyers et al. [9]; Tuutti[10]). Beyond this absorption zone, the diffusion process will dominate[10]. Chloride ingress driven by pressure gradient, which has to be maintained by a hydraulic head, is rarely found in highway concrete structures and its influence can be minimal[11,12]. Recently, a more
general ion transport process for predicting chloride ingress into concrete structures described by the Nernst-Planck Equation was used (i.e. Samson and Marchand 2008 [13]). This model, which is very well established in traditional electrochemical science (Glasstone 1946 [14]), describes the ion transport as a combination of three mechanisms, namely: (i) diffusion; (ii) convection (carried along by moisture movement, i.e. by absorption or hydraulic pressure); and (iii) electrical migration. Although the mechanism of electrical migration under an imposed electrical potential has been used to develop an accelerated method (Rapid Chloride Permeability Test) to determine the diffusion coefficient of concrete (Andrade 1993[15]), the study of its contribution to chloride ingress under normal service condition is only recent [13].
Depending on the exposure condition as well as on the moisture content of the concrete element, the ingress of chlorides into concrete is through coupled multiple transport mechanisms (Kropp 1995); however, most models for chloride ingress in concrete are still based on the assumption of a Fickian process of diffusion as the main transport mechanism. Moreover, diffusion based models have been found acceptable for long-term monitoring of chloride ingress in concrete structures (Bamforth 1999[16]; Tang and Gulikers 2007 [17]). The main differences between different diffusion based models were summarized by Andrade et al. (2006)[18] and possible approaches for improving the prediction of chloride ingress were suggested by Nilsson (2007)[19], which include: (i) use of more appropriate boundary conditions; (ii) adoption of an age factor for parameters defining concrete properties such as diffusion coefficient; and (iii) consideration of more than one transport mechanism.
It should be pointed that the uncertainty of this Fickian model has been recognized for a long time, since it has been used with the so-called “apparent” values of the diffusion coefficient and surface chloride concentration, which are obtained by calibrating the Fickian model with
available field data. Large amount of experimental data have shown that the diffusion coefficient depends on both concrete mix design, such as water/cement ratio, quantity of mineral admixtures, aggregate fraction, etc., and other parameters such as temperature and age of concrete (Bentz[20]; Thomas and Bamforth[21]). Few standards, e.g. Salt Ponding Test and
Rapid Chloride Permeability Test, have been developed over time to measure it as a material
parameter or property for durability of concrete structures exposed to chlorides.
There is a need to make a distinction between the mechanistic models and data needed for the design of new structures and those needed for predicting the service life of existing structures. For the evaluation of the safety and serviceability of existing structures, it is critical to use the most rigorous models and data (obtained from measurements on the existing structures) to predict the service life and to compare it to the specified design life. This is because the consequences of erroneous predictions can be catastrophic; e.g. impaired structural safety and potential collapse. For the design of new structures, a useful model should have the model parameters that either are design parameters or have (empirical) correlations with design parameters; e.g. chloride diffusion coefficient and concrete mix design. A reliable yet practical model such as the diffusion-based model can be therefore assumed acceptable, as long as the uncertainties in the model and design parameters are taken into account. This ensures acceptable levels of performance and probabilities of failure in terms of safety and serviceability within the design life of the structures [6,7].
In this paper, the focus is on the use of the diffusion-based model as a quantitative approach to service life design of concrete structures that overcomes some of the limitations of the current prescriptive rules-based approach, as well as the complexities and lack of data associated with the use of models of multi-transport mechanisms. Multi-mechanism models will be useful for the
predicting the service life of existing structures as well as for design purposes, when large number of experimental data become available in the future to establish an empirical correlation of model parameters with design parameters, as was done for correlating the chloride diffusion coefficient with concrete mix design parameters over the last two decades.
2.2 Simplified diffusion based service life design model
The onset of corrosion of the reinforcing steel is assumed to occur when the concentration of chlorides at the level of the reinforcement has reached the so-called “chloride threshold value”. Therefore, the duration of the initiation stage is from time zero to the onset of corrosion. Based on the concept of chloride threshold value for corrosion initiation and the assumption of a Fickian process of chloride diffusion as discussed above, a deterministic model of the time to corrosion initiation can be expressed as a function of four key parameters [3,8] as follows:
2 1 2 )] 1 ( [ 4 ) , , , ( s th c c th s i C C erf D d d D C C f T − = = − (1)
where Ti is the time to onset of corrosion, Cs is the surface chloride concentration, Cth is the chloride threshold value, D is the chloride diffusion coefficient, dc is the depth of concrete cover over the reinforcing steel, and erf is the error function. The model is a transformation of Crank’s solution to Fick’s second law of diffusion for one-dimensional flow over a semi-infinite medium (Crank[22]) with the mathematical interpretation of Tuutti’s corrosion initiation model [8], under the assumptions of a constant diffusion coefficient, constant surface chloride content as the boundary condition, and the initial chloride concentration condition specified as zero.
In this deterministic model (Eq.1), the four parameters are assumed to be four independent design parameters that are critical for corrosion protection: (i) structural parameter: concrete
cover depth dc; (ii) material parameters: chloride diffusion coefficient D, which is an indicator of the rate of chloride penetration into concrete, and chloride threshold value Cth, which is an indicator of the corrosion resistance of reinforcing steel; and (iii) environmental parameter: surface chloride concentration Cs, which is a measure of the corrosion load or exposure risk on concrete structures.
This model was used to study the sensitivity of the time to corrosion initiation to each of the four parameters [8]. This paper will explore the quantitative relationships between pairs of the governing parameters, when the time to corrosion initiation, which is defined as the design life or service life, is specified. For example, the relationship between concrete cover depth and chloride threshold value of steel can be solved through Eq. 1, which can be a guide for choosing appropriate concrete cover depth and type of steel that offers the required chloride threshold value. In this paper, the emphasis is on the physical performance, e.g. durability in terms of the length of corrosion initiation stage, and no consideration is given to cost implications. It should be pointed out that for a truly effective design of concrete structures, the cost implications of changing the different design parameters should be explicitly considered in order to determine the optimal combination of values that satisfy the design life and minimize the life cycle costs of concrete structures, including the costs of design, construction, maintenance, rehabilitation, etc. (Lounis 2007).
In order to evaluate the relationships between these four parameters for durability design, it is easier to examine the relationships by re-writing Eq. 1 as follows:
) 2 ( 1 i c s th DT d erf C C = − (2)
Equation 2 indicates that a relationship between two variables on the same side of the equation will be easily obtained for a specified design life (Ti), such as Cth and Cs or dc and D, for which an analytical solution can be obtained. Equation 2 shows that Cs and Cth are linearly related, which means that the corrosion resistance of embedded steel has to be chosen proportional to the severity of the surface exposure condition in order to achieve a specified design life. Two variables on either side of the equation are related through the error function and their relationships are highly nonlinear. Given the complexity of the error function and its
inverse, a numerical solution of the equation y=erf (x), where x=
i c DT d 2 and y= s th C C − 1 , will be
used to determine these relationships (e.g. the numerical relationship between
2 4 c i d DT , equivalent to 1/x 2 versus s th C C
, equivalent to 1-y, is obtained by using math tables or common computer
spreadsheets).
In addition to the relationships derived from Eq. 2, the sensitivity between parameters is also explored to take into account the considerable level of uncertainty and variability associated with each of the four governing parameters[8]. This parameter uncertainty is due to:(i) heterogeneity and aging of concrete with temporal and spatial variability of its chloride diffusivity; (ii) variability of concrete cover depth, which depends on quality control, workmanship and size of structure; (iii) variability of surface chloride concentration, which depends on the severity of the environmental exposure; and (iv) uncertainty in chloride threshold value that depends on the type of reinforcing steel, type of cementing materials, test methods, etc. (Bamforth and Price[16]). The study of sensitivity enables to illustrate the impact of variation (or uncertainty) of one
parameter on another, and how the value of one parameter needs to be adjusted to compensate for the variation in another parameter, especially for the case of negative impacts on service life. This is done through a numerical evaluation of the relationships of pairs of parameters by determining their respective relative changes when other parameters are kept constant [8].
3. Relationships between governing parameters 3.1 Range of values and variations of parameters
Realistic ranges of values of the four governing parameters, Cs, Cth, D, and dc, are summarized below, with emphasis on highway bridge deck applications [8]. A value of 50 years for Ti is assumed as the specific design life throughout the numerical illustrations in this paper.
The chloride threshold Cth is defined as the chloride concentration at which the passivation of the steel in concrete will be destroyed. It depends on the type of steel, electrochemical environment in concrete, and testing method and consequently, a considerable variation is expected for this parameter. Different types of steel have different Cth values, and even one type of steel (e.g. carbon steel) has a wide range of reported values of Cth [27]. In this paper, the values obtained from the same research study are used in order to minimize the variation induced by testing methods. The values of Cth are taken from the reported values from Trejo and Pillai [23,24], with the mean values of Cth for carbon steel, micro-composite steel, stainless steel SS304 and SS316LN, being 0.52 kg/m3, 4.6 kg/m3, 5.0 kg/m3, and 10.8 kg/m3, respectively.
The concrete cover depth is a design parameter that varies with the severity of environmental exposure. The variability of concrete cover depends on the quality of workmanship and control during construction. A constant value of dc is chosen to be 50 mm when studying the relationships between other parameters, and the associated variation of dc is between 20 mm and
80 mm, which is ±60%, representing a range of cast-in-pace bridge decks built in the sixties and seventies[7].
The chloride diffusion coefficient D of concrete is a material property that is a measure of the rate of chloride penetration into concrete. The value of D depends on both concrete mix design, such as water/cement ratio, quantity of mineral admixtures, aggregate fraction, etc., and other parameters such as temperature and age of concrete[20,21,27]. The typical values of D for normal concrete (e.g. w/c=0.4) were reported between 10−12 m2/s and 10−11 m2/s[21,25], e.g. D= 4×10⁻¹²
m2/s for a normal concrete with w/c=0.4 and D= 10−11 m2/s for w/c=0.55 (Bijen[25] ). The incorporation of mineral admixtures (e.g. fly ash, slag, silica fume), however, can lead to orders of magnitude reduction of D in the long term (Thomas and Bamforth [21]). In this study,
D of normal concrete is considered to vary from 10−12 m2/s to 10−11 m2/s. Lower values of D from 10−13 m2/s to 10−12 m2/s are referred as high-performance concrete (HPC) only in terms of resistance to chloride penetration in this paper. It should be noted that the possible mechanism of chloride transport though potential cracking in concrete (e.g. caused by early-age autogeneous shrinkage in HPC or due to service load on structures) is not considered in the model.
Weyers et al. [16] classified the corrosive environments surrounding bridge decks into four categories in terms of surface chloride concentration: Light, Moderate, Heavy, and Severe
Exposures. In this paper, the mean value for each exposure condition is used when a constant Cs value is needed to study, for example, the relationships of Cth versus dc under these exposure conditions. The exposure condition is deemed as a corrosion load for concrete structures with a constant value for each of the exposure conditions. The constant values Cs are 1.8 kg/m3, 3.5 kg/ m3, 5.3 kg/ m3,and 7.4 kg/ m3, respectively, for the four exposure conditions.
3.2 Relationship between design parameters
The selection of an appropriate concrete cover depth (dc) and type of steel with sufficient corrosion resistance can be determined by the relationship between dc and Cth. Their relationship will be affected by chloride diffusion coefficient and exposure condition. Figure 1 illustrates this relationship under four exposure conditions when D = 10-12 m2/s, which implies a low chloride diffusion coefficient of either a high-quality normal concrete or an HPC. As expected, Cth increases as dc decreases. The slopes of these curves indicate that increasing dc is more effective
under heavier exposure to chlorides, while increasing Cth is more effective under lighter exposure conditions. For example, under “Light Exposure”, the concrete cover has to be 60 mm for carbon steel with Cth=0.52 kg/m3 in order to achieve a design life of 50 years, but only 30 mm if using a steel with Cth=1.0 kg/m3. On the other hand, under “Severe Exposure”, the chloride threshold needs to be increased from about 2.0 kg/m3 to 4.6 kg/m3 (e.g. that of a micro-composite steel) if the cover depth is reduced from 60 mm to 30 mm.
Figure 2 illustrates the relationship between dc and Cth under “Heavy Exposure” condition for different D values, which ranges from those of normal concrete to HPC. The slopes of the curves indicate that increasing dc is more effective in HPC than in normal concrete. For a concrete with D = 5×10-13 m2/s (e.g. HPC) an increase of dc to about 65 mm can bring down the requirement on
Cth to 0.52 kg/m3 (that of carbon steel) even under “Heavy Exposure” condition. The dc - Cth relationship also provides other useful information for design: Figure 2 shows that if the design value of dc is less than 80 mm for “Heavy Exposure” condition and carbon steel is to be used, the use of a concrete with D < 10-12 m2/s (e.g. that of HPC) should be considered.
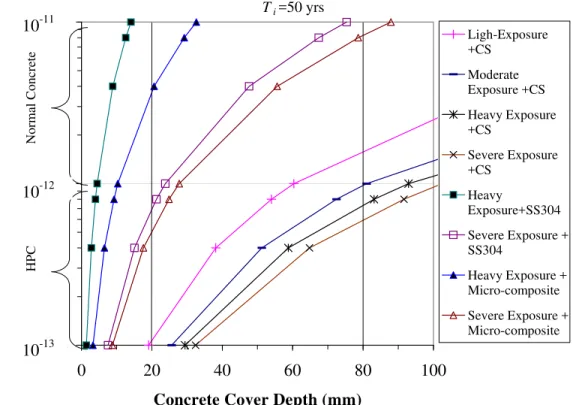
Figure 3 presents the relationship between D and dc by determining the curves for different combinations of steel type (characterized by Cth) and exposure conditions. For carbon steel and
Micro-composite steel under Light, Moderate and Severe Exposures, the required concrete cover increases at a relatively fast rate as D increases. For example, an increase in D from 10-12 m2/s (HPC) to 10-11 m2/s (normal concrete) requires an increase in the cover depth from 30 mm to about 90 mm for Micro-composite steel under “Severe Exposure”. On the other hand, for corrosion-resistant steels steel under Heavy Exposure, the required concrete cover increases at a much slower rate as D increases. Figure 3 also shows that curves between D and dc can be generated in different ways to meet specific design purposes and serve as guidelines for choosing different combinations of values for the design parameters governing service life.
The relationship between D and Cth, i.e. between concrete diffusion coefficient and corrosion resistance of steel is affected by design of concrete cover depth and exposure condition. Figure 4 illustrates the relationship under “Heavy Exposure” for different dc values. An increase of dc from 20 mm to 80 mm can reduce the requirement on Cth from about 3.6 kg/m3 to 0.52 kg/m3 (that of carbon steel) in HPC, as indicated by line A, for a value of D slightly lower than 10-12 m2/s; however, in normal concrete it will reduce the requirement on Cth slightly from about 4.8 kg/m3 (about that of Micro-composite steel or SS 304) only to 3.3 kg/m3, as indicated by line B, for a value of D slightly lower than 10-11 m2/s. This means that a larger D value of normal concrete results in a limited choice of types of steel that can be used to achieve the design life. Their relationship also suggests that the use of a steel with Cth around 5.0 kg/m3 (e.g. that of stainless steel 304) under “Heavy Exposure” will help achieve Ti = 50 years, even for a low cover (dc = 20 mm) and normal concrete (D = 10-11m2/s).
Figure 5 illustrates the relationship of dc and Cs for concrete with D = 10-12 m2/s, but for different types of steel. It clearly shows the necessity to use both HPC and high performance steel for both “Heavy Exposure” and “Severe Exposure” conditions; e.g., the micro-composite
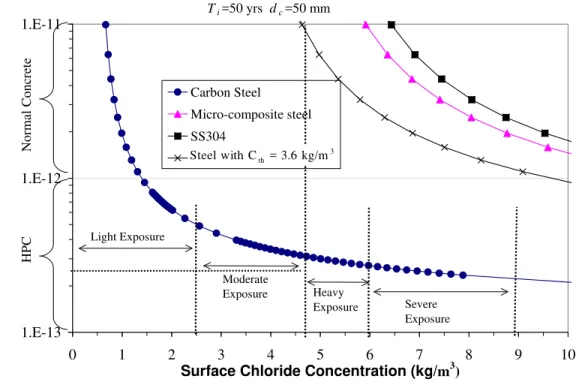
and SS304 steels can be used under “Severe Exposure” without increasing concrete cover above 50 mm. This relationship can also be used to identify a threshold value of Cth of steel that can be used to provide required resistance under a specified exposure condition, and Figure 5 shows that a value of about 3.4 kg/m3 for Cth is needed under exposure conditions if the concrete cover is less than 50 mm. Therefore, the requirement on the corrosion resistance of steel can be conveniently estimated for design by using the developed curves. This is further illustrated in the relationship of D and Cs in Figure 6. It shows that for a concrete cover of 50 mm, Cth needs to be greater than about 3.6 kg/m3 to achieve a design life of 50 years under “Heavy Exposure” condition for a normal concrete; otherwise, a concrete (HPC) with D < 2×10-13
m2/s should be specified if carbon steel is to be used.
3.3 Relative sensitivities of service life parameters
Consider the cover depth (dc) of a concrete structure with a mean value of 50 mm and a range variation from 20 mm (−60%) to 80 mm (60%); the sensitivity of Cth to the variation in dc is presented in Figure 7. It shows the necessary relative change in Cth (by selecting the appropriate type of steel) to satisfy the specified design life of Ti=50 years under four different exposure conditions. The reference values for the curves are Ti =50 years, Cth = 0.52 Kg/m3 (carbon steel) and dc =50 mm, and the values of D are 7.1×10⁻¹³
m2/s, 3.8×10⁻¹³ m2/s, 2.9×10⁻¹³ m2/s, 2.4×10⁻¹³ m2/s, respectively, for the four exposure conditions from “Light Exposure” to “Severe
Exposure”. The relative change in Cth means by how much its value has to be adjusted from the base value of a carbon steel, in order to compensate for the effect of change in dc, especially in the case of a negative change in dc, and satisfy the design life of 50 years. It can be seen that the variation in dc has a considerable impact on Cth. A value of dc = 20 mm (i.e. −60% of the base
value of 50 mm) will require to use a steel with a corrosion resistance about five to six times higher than that of carbon steel. Furthermore, the four curves show that Cth is more sensitive to the variation in dc under more severe exposure conditions, which means for a decrease in concrete cover depth, the corrosion resistance of steel has to increase more for more severe exposure conditions. If dc is reduced by 60%, it requires an increase in Cth by about 5.8 times under “Severe Exposure” and an increase by about 1.3 times under “Light Exposure.”
On the other hand, the sensitivity of dc to Cth is not as much. Figure 8 was plotted from the same data as those in Figure 8 but with reversed x and y axes to focus on the range of variation in
Cth, which is ±40% from the base value for carbon steel. It shows that the variation in Cth causes the necessary change in dc by about 30% to -20% for “Light Exposure”, which means an increase in dc from 50 mm to 65 mm will suffice to compensate the adverse effect of a reduction in Cth by 40%. Also in reverse, dc is more sensitive to variation in Cth under lighter exposure conditions. For a relative decrease in chloride threshold value, the relative increase in concrete cover is much higher for lighter conditions. If Cth is reduced by 40%, it requires an increase in dc by about 18% under “Severe Exposure” (low D) and an increase by about 30% under “Light Exposure” (high
D). Note for Figure 7 and Figure 8, Ti is kept a constant 50 years for different exposure conditions, which is the main interest of study in this paper, instead of keeping D constant.
Figure 9 shows the sensitivity of Cth to the variation in D. The reference values are Ti =50 years, dc =50 mm, and Cth = 0.52 Kg/m3 (carbon steel) and the reference values of D (noted in Figure 9 as Dref) are, 7.1×10⁻¹³
m2/s, 3.8×10⁻¹³ m2/s, 2.9×10⁻¹³ m2/s, 2.4×10⁻¹³ m2/s, respectively, for the four exposure conditions from light to severe. In Figure 10, instead of showing the change by percentage (which is ΔD/D=(D-Dref)/Dref), the variation is illustrated by D/Dref. This is because the change of D can be significant in linear scale and up to one order of magnitude. The
ratios D/Dref 0.1 and 10 represent the variation by one order of magnitude for decreasing and increasing, respectively. It is clear that D has a significant impact on Cth: an increase in D by one order of magnitude (e.g. from HPC to normal concrete) requires an increase in Cth by about 6.9 times under “Severe Exposure”. Furthermore, Cth is more sensitive to the variation in Dunder more severe exposure conditions, which means for an increase in chloride diffusion coefficient, the relative increase in corrosion resistance of steel has to be higher for more severe exposure conditions. If D is increased by one order of magnitude (e.g. from 7.1×10⁻¹³
m2/s to7.1×10-12 m2/s), it requires an increase in Cth by about 6.9 times under “Severe Exposure” and an increase by about 1.6 times under “Light Exposure.”
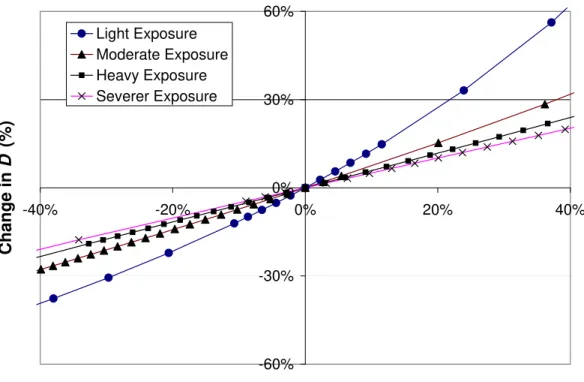
Figure 10 was plotted from the same data as in Figure 10 but with reversed x and y axes to focus on relative change in Cth (from the base value of carbon steel by ±40%) versus the relative change of D. The sensitivity of D to Cth is less significant than the sensitivity of Cth to D. It shows that the variation in Cth causes the necessary change in D by about 60% to -40% for “Light
Exposure”, which means that a decrease in D from 7.1×10⁻¹³ m2/s to 4.3×10⁻¹³ m2/s will suffice to compensate the adverse effect of a reduction in Cth by 40%. In reverse, D is more sensitive to the variation in Cth under lighter exposure conditions, which means that for a reduction in chloride threshold value, the relative decrease of chloride diffusion coefficient has to be higher for decreasing severity of exposure environments. If Cth is reduced by 40%, it requires a decrease in D by about 20 % under “Severe Exposure” and a decrease by about 40% under “Light
Exposure”.
The sensitivity between dc and D are more straightforward because they are not related by the error function (Eq.1), and the percentage change of Δdc/dc versus ΔD/D can be obtained analytically when other parameters are kept constant as follows:
) ( 2 2 c c c c d d d d D D Δ + Δ = Δ (3)
Equation 3 shows that for small variations of dc (e.g., less than 10%), the relative change (ΔD/D) is approximately twice, i.e. a 10% decrease in dc will require decreasing D by 21%. The
increase and decrease in Dare asymmetrical with dc; an increase in dc will induce a much greater increase in D than a decrease of dc for the same percentage, e.g. variation in dc from –60% to 60% will result in the change of D from −84% to 156%. Considering that variation in D can be up to one order of magnitude, an increase by one order of magnitude (ΔD/D =9, e.g., from 10-13 m2/s to 10-12 m2/s) will require an increase in dc by 2.16 times (e.g. from 50 mm to 108 mm); a decrease by one order of magnitude (ΔD/D = -0.1, e.g., from 10-12
m2/s to 10-13 m2/s) can reduce
dc by 68% (e.g. from 50 mm to 16 mm). It implies that the quality of concrete mix in terms of
chloride permeability can have a significant impact on selecting the concrete cover depth to achieve the specified design life. By choosing HPC over normal concrete, assuming its D is reduced by one order of magnitude, the concrete cover depth can be reduced by 68%. On the other hand, choosing a normal concrete over an HPC, assuming its D is increased by one order of magnitude, the concrete cover depth must be more than doubled.
4. Summary and conclusions
This paper presented an approach towards a performance-based durability design of concrete structures based on the simplified diffusion-based model, which overcomes some of the limitations of the current prescriptive rules of existing design standards. A quantitative
evaluation of the nonlinear relationships and relative sensitivities between the four governing parameters for service life design and corrosion protection of concrete structures, including surface chloride concentration, chloride diffusion coefficient, chloride threshold value of steel, and concrete cover depth have been presented.
The relationships can be used to identify the parameters that are more effective in achieving a specific design life, which is defined as the time to corrosion initiation in this paper. It was found that increasing concrete cover depth is more effective under heavier chloride exposure conditions, while selecting a type of reinforcing steel with higher chloride threshold value is more effective under lighter exposure conditions. Under heavy chloride exposure conditions, increasing concrete cover depth is more effective in HPC (chloride diffusion coefficient from 10 -13
m2/s to 10-12 m2/s) than in normal concrete (chloride diffusion coefficient from 10-12 m2/s to 10 -11
m2/s).
The relationships can also be used as guidelines for a selection of an adequate value for one parameter or for choosing the most appropriate combination of values of the governing parameters to achieve a specified design life for concrete structures. The main findings can be summarized as follows: i) The relationship between concrete cover depth and exposure condition (in terms of surface chloride concentration) reveals the necessity of using both HPC with chloride diffusion coefficient less than 10-12 m2/sand high performance steel under heavy chloride exposure conditions. This relationship can also be used to identify the appropriate type of steel with the required corrosion-resistance that can withstand a specified exposure condition; and ii) Similarly, the requirement on the concrete mix design in terms of chloride diffusion coefficient can be estimated by using the relationship between chloride diffusion coefficient and surface chloride concentration.
The study of relative sensitivities illustrated how the value of one parameter needs to be adjusted to compensate for the variation in another parameter in order to achieve the specified design life. It was found that chloride threshold value is more sensitive to concrete cover depth. It means that for a relative decrease in concrete cover depth, the relative increase in corrosion resistance of steel has to be higher by choosing an appropriate type of steel. Similarly, variation in chloride diffusion coefficient, which depends on the design and quality control of concrete mix, has a significant impact on chloride threshold value as well, especially under severe chloride exposure condition. If chloride diffusion coefficient is increased by one order of magnitude (e.g. from 7.1×10⁻¹³
m2/s to7.1×10-12 m2/s), it requires an increase in chloride threshold value by about 6.9 times by choosing a proper type of steel under severe chloride exposure and an increase by about 1.6 times under light chloride exposure, in order to compensate for the adverse effect and satisfy the specified design life.
The sensitivity study also implies that the design and quality of concrete mix in terms of chloride permeability has a significant impact on the design of concrete cover depth. By choosing an HPC over a normal concrete, assuming its chloride diffusion coefficient is reduced by one order of magnitude, the concrete cover depth can be reduced by 68%. On the other hand, choosing a normal concrete over an HPC and assuming that its chloride diffusion coefficient is increased by one order of magnitude, the concrete cover depth must be doubled.
Note that the results presented in this paper are illustrated for the case of a reinforced concrete structure with a specified design life of 50 years and the quantitative correlations of the parameters for other specified design lives can be obtained by using the methodology presented in this paper. When more rigorous mechanistic models are used at the design stage, the similar approach can be adopted to study the nonlinear relationships and sensitivities between the model
parameters that are correlated with design parameters, and the use of more rigorous mechanistic models will overcome the potential shortcomings of the simplified diffusion models. In addition, a study of the costs of changing the different design parameters and their impacts on the life cycle costs of concrete structures is needed to determine a truly optimal service life design of concrete structures that are subjected to chlorides.
5. References
1. Stratfull, RF. The corrosion of steel in a reinforced concrete bridge, Corros 1956; 13: 173-178.
2. Gouda VK. Corrosion and corrosion inhibition of reinforcing steel. Br Corros J 1970; 5: 198.
3. Tuutti K. Corrosion of steel in concrete, CBI Research Report 4:82. Swedish Cement and Concrete Research Institute, Stockholm, 1982.
4. Rosenberg A, Hansson CM, Andrade C. Mechanisms of corrosion of steel in concrete. In: Skalny J, editor. Materials Science of Concrete. Westerville: The American Ceramic Society, Inc., 1989. p.285-313.
5. Cady PD, Weyers RE. Chloride penetration and deterioration of concrete bridge decks. Cem Concr Aggreg 1983; 5(2): 81-87.
6. Rilem Report 14. Durability Design of Concrete Structures. Sarja A. Vesikari E. editors. E&FN Spon, 1996.
7. Lounis Z. Uncertainty modeling of chloride contamination and corrosion of concrete bridge. In: Ayyub B, Attoh-Okine NO, editors. Applied Research in Uncertainty Modeling and Analysis. Springer, Chapter 22, 2004. p. 491-511.
8. Zhang J, Lounis Z. Sensitivity study of control parameters for onset of corrosion Induced by chloride diffusion. Cem Concr Res 2006; 36 (7):1312-1323.
9. Weyers RE, Prowell BD, Sprinkel MM. Concrete Bridge protection, repair, and rehabilitation relative to reinforcement corrosion: a methods application manual, SHRP-S-360. 1993.
10. Tuutti K. Chloride induced corrosion in marine concrete structures. in: Durability of Concrete on Saline Environment, Uppsala 1996; pp. 81-93.
11. Stanish KD, Hooton RD, Thomas MDA. Testing the chloride penetration resistance of concrete: a literature review. FHWA Contract DTFH61-97-R-00022. University of Toronto, Canada. 2000.
12. Boddy A, Bentz E, Thomas MDA, Hooton RD. An Overview and sensitivity study of a multimechanistic chloride transport model. Cem Concr Res 1999; 29:827-837.
13. Samson E, Marchand J. Modeling the transport of ions in unsaturated cement-based materials. Comput Struct 2008; 85:1740-1756.
14. Glasstone S. Textbook of physical chemistry. Van Nostrand Ed. New York, 1946.
15. Andrade C. Calculation of chloride diffusion coefficient in concrete from ionic migration measurements. Cem Concr Res 1993; 23:724-742.
16. Bamforth PB, Price WF. An international review of chloride ingress into structural concrete. Transport Research Laboratory Report 359. Scotland, 1997.
17. Tang LP, Gulikers JP. On the mathematics of time-dependent apparent chloride diffusion coefficient in concrete. Cem Concr Res 2007; 37:589-595.
18. Andrade C, Tavares F, Castellote M, Petre-Lazars I, Climent MA, Vera G. Comparison of chloride models: the importance of surface condition. In: Second International Symposium
on Advances in Concrete through Science and Engineering, September 2006, Quebec City, Canada.
19. Nilsson LO. Present limitations of models for predicting chloride ingress into reinforced concrete structures. J Phys IV France 2006; 136: 123-130.
20. Bentz DP. Influence of silica fume on diffusivity in cement based materials, II. Multi-scale modeling of concrete diffusivity, Cem Concr Res 2000; 30: 1121-1129.
21. Thomas MDA, Bamforth PB. Modeling chloride diffusion in concrete- effect of fly ash and slag. Cem Concr Res 1999; 29:187-495.
22. Crank J. The mathematics of diffusion. Oxford: Clarendon press, 1975.
23. Trejo D, Pillai RG. Accelerated chloride threshold testing—Part I: ASTM A 615 and A 706 reinforcement. ACI Mater J 2003; 100 (6): 519-527.
24. Trejo D, Pillai RG. Accelerated chloride threshold testing—Part II: Corrosion-resistant reinforcement. ACI Mater J 2004; 101 (1):57-64.
25. Bijen J. Benefits of slag and fly ash. Construct Build Mater 1996: 10 (5): 309–314.
26. Boddy A, Bentz E, Thomas MDA, Hooton RD. An overview and sensitivity study of a multimechanistic chloride transport model. Cem Concr Res 1999; 29:827-837.
27. Bamforth PB, Price WF. An international review of chloride ingress into structural concrete. Contractor Report 359, Transport Research Laboratory, UK, 1996.
28. Lounis Z. Risk-based maintenance optimization of aging highway bridge decks. In
Advances in Engineering Structures, Mechanics & Construction, Springer Netherlands,
2007. pp.723-734
29. Kropp J. Chlorides in concrete. In Performance Criteria for Concrete Durability. RILEM
0 50 100
0 1 2 3 4 5 6
Chloride Threshold Value (kg/m3)
Concrete Cover Depth (m
m ) Light Exposure Moderate Exposure Heavy Exposure Severe Exposure Carbon steel: 0.52 kg/m3 Micro-composite steel: 4.6 kg/m3 SS304: 5.0 kg/m3 Ti=50 yrs D=10-12 m2/s
Figure 1: Concrete cover vs. chloride threshold value for different environments
0 50 100
0 1 2 3 4 5 6
Chloride Threshold Value (kg/m3)
Concrete Cover Depth (mm)
D = 5.0 x 10⁻¹² m2/s D=10-12 m2/s D = 5.0 x 10⁻¹³ m2/s(HPC) D=10-13 m2/s (HPC) Carbon steel: 0.52 kg/m3 Micro-composite steel: 4.6 kg/m3 SS304 : 5.0 kg/m3 Ti=50 yrs and Heavy Exposure
/s
m
10
−12 2=
D
/s
m
10
5
×
−12 2=
D
(HPC)
/s
m
10
5
×
−13 2=
D
(HPC)
/s
m
10
−13 2=
D
Figure 2: Concrete cover vs. chloride threshold value for different concretes
1.E-13 1.E-12 1.E-11
0 20 40 60 80 100
Concrete Cover Depth (mm)
Chloride Diffusion Coefficient (m
2 /s ) Ligh-Exposure +CS Moderate Exposure +CS Heavy Exposure +CS Severe Exposure +CS Heavy Exposure+SS304 Severe Exposure + SS304 Heavy Exposure + Micro-composite Severe Exposure + Micro-composite Ti=50 yrs Normal Concrete HPC 10-13 10-12 10-11
Figure 3: Concrete cover vs. concrete diffusion coefficient for different environments and types of steel
1.E-13 1.E-12 1.E-11
0 1 2 3 4 5 6 7 8
Chloride Threshold Value (kg/m3)
Chloride Diffusion Coefficient (m
2 /s ) dc=20 mm dc=30 mm dc=50 mm dc=80 mm Carbon steel: 0.52 kg/m3 Micro-composite steel: 4.6 kg/m3 SS304 : 5.0 kg/m3 Ti=50 yrs and Heavy Exposure
Normal HPC A B 10-11 10-12 10-13
Figure 4: Chloride threshold vs. concrete diffusion coefficient for different concrete covers
20 30 40 50 60 70 80 0 1 2 3 4 5 6 7 8 9 10
Surface Chloride Concentration (kg/m3)
Concrete Cover Depth (mm
) Carbon Steel Micro-composite steel SS304 Steel with Cth=3.4 kg/m^3 Light Exposure Ti=50 yrs D =10 -12 m2/s Moderate Exposure Heavy Exposure Severe Exposure 3 th =3.4kg/m C with Steel
Figure 5: Concrete cover vs. surface chloride exposure for different types of steel
1.E-13 1.E-12 1.E-11
0 1 2 3 4 5 6 7 8 9 10
Surface Chloride Concentration (kg/m3)
Chloride Diffusion Coefficient (m
2 /s ) Carbon Steel Micro-composite steel SS304 Steel with Cth=3.6 kg/m^3 Light Exposure Ti=50 yrs dc=50 mm Normal Concrete HP C Moderate Exposure Heavy Exposure Severe Exposure 3 th=3.6kg/m C with Steel
Figure 6: Concrete diffusion coefficient vs. surface chloride exposure for different types of steel
-100% 0% 100% 200% 300% 400% 500% 600% -60% -40% -20% 0% 20% 40% 60% Change in dc(%) Change in Cth (%) D=7.1*10-13 m2/s, Light Exposure D=3.8*10-13 m2/s, Moderate Exposure D=2.9*10-13 m2/s, Heavy Exposure D=2.4*10-13 m2/s, Severe Exposure Base values for (x,y)=(0,0): dc= 50 mm,Clth= 0.52 kg/m3
7.1*10-13 m2/s 3.8*10-13 m2/s 2.9*10-13 m2/s 2.4*10-13 m2/s
Figure 7: Sensitivity of chloride threshold value to variation in concrete cover depth
-30% -20% -10% 0% 10% 20% 30% -40% -20% 0% 20% 40% Change in Cth(%) Change in dc (%) D=7.1*10-13 m2/s, Light Exposure D=3.8*10-13 m2/s, Moderate Exposure D=2.9*10-13 m2/s, Heavy Exposure D=2.4*10-13 m2/s, Severe Exposure
Base values for (x,y)=(0,0): dc= 50 mm,Clth= 0.52 kg/m3
7.1*10-13 m2/s 3.8*10-13 m2/s 2.9*10-13 m2/s 2.4*10-13 m2/s
Figure 8: Sensitivity of concrete cover depth to variation in chloride threshold value -100% 0% 100% 200% 300% 400% 500% 600% 700% 0.1 1.0 10.0
Change in D by D/Dref, in log scale
Change in Cth (%) Light Exposure Moderate Exposure Heavy Exposure Severer Exposure
-60% -30% 0% 30% 60% -40% -20% 0% 20% 40% Change in Cth (%) Change in D (%) Light Exposure Moderate Exposure Heavy Exposure Severer Exposure
Figure 10: Sensitivity of chloride diffusion coefficient to variation in chloride threshold value
Figures List
Figure 1: Concrete cover vs. chloride threshold value for different environments
Figure 2: Concrete cover vs. chloride threshold value for different concretes
Figure 3: Concrete cover vs. concrete diffusion coefficient for different environments and types of steel
Figure 4: Chloride threshold vs. concrete diffusion coefficient for different concrete covers
Figure 5: Concrete cover vs. surface chloride exposure for different types of steel
Figure 7: Sensitivity of chloride threshold value to variation in concrete cover depth
Figure 9: Sensitivity of concrete cover depth to variation in chloride threshold value
Figure 9: Sensitivity of chloride threshold value to variation in chloride diffusion coefficient