Publisher’s version / Version de l'éditeur:
Proceedings. International Workshop on Smart Materials and Structures. Cansmart 2009., 2009-10-22
READ THESE TERMS AND CONDITIONS CAREFULLY BEFORE USING THIS WEBSITE. https://nrc-publications.canada.ca/eng/copyright
Vous avez des questions? Nous pouvons vous aider. Pour communiquer directement avec un auteur, consultez la première page de la revue dans laquelle son article a été publié afin de trouver ses coordonnées. Si vous n’arrivez pas à les repérer, communiquez avec nous à PublicationsArchive-ArchivesPublications@nrc-cnrc.gc.ca.
Questions? Contact the NRC Publications Archive team at
PublicationsArchive-ArchivesPublications@nrc-cnrc.gc.ca. If you wish to email the authors directly, please see the first page of the publication for their contact information.
NRC Publications Archive
Archives des publications du CNRC
This publication could be one of several versions: author’s original, accepted manuscript or the publisher’s version. / La version de cette publication peut être l’une des suivantes : la version prépublication de l’auteur, la version acceptée du manuscrit ou la version de l’éditeur.
Access and use of this website and the material on it are subject to the Terms and Conditions set forth at
Generation and detection of guided acoustic waves for NDT using high temperature wedges
Wu, K. -T.; Jen, C. -K.; Murayama, R.; Oliveira, J. E. B.
https://publications-cnrc.canada.ca/fra/droits
L’accès à ce site Web et l’utilisation de son contenu sont assujettis aux conditions présentées dans le site LISEZ CES CONDITIONS ATTENTIVEMENT AVANT D’UTILISER CE SITE WEB.
NRC Publications Record / Notice d'Archives des publications de CNRC:
https://nrc-publications.canada.ca/eng/view/object/?id=40d9abf4-7778-4933-a611-233ee8dd4ada https://publications-cnrc.canada.ca/fra/voir/objet/?id=40d9abf4-7778-4933-a611-233ee8dd4ada
Cansmart 2009
International Workshop
SMART MATERIALS AND STRUCTURES
22 - 23 October 2009, Montreal, Quebec, Canada
GENERATION AND DETECTION OF GUIDED ACOUSTIC
WAVES FOR NDT USING HIGH TEMPERATURE WEDGES
K.-T. Wu1, C.-K. Jen2, R. Murayama2#, J.E.B. Oliveira2*,
1Department of Electrical and Computer Engineering, McGill University, Montreal, Quebec, Canada H3A 2A7
Kuo-Ting.Wu@cnrc-nrc.gc.ca
2Industrial Materials Institute, National Research Council, Boucherville, Quebec, Canada J4B 6Y4
Cheng-Kuei.Jen@cnrc-nrc.gc.ca
#Permanent address: Faculty of Engineering, Fukuoka Institute of Technology, Fukuoka, Japan Riichi.Murayama@imi.cnrc-nrc.gc.ca
*Permanent address : CTA-ITA-IEEC, 12225 Sao Jose Dos Campos, Sao Paulo, Brazil J.EdimarB.Oliveira@imi.cnrc-nrc.gc.ca
ABSTRACT
Ultrasonic wedges which can propagate one longitudinal L and two orthogonally polarized shear S waves are presented. In order to use this wedge to generate and received guided plate acoustic waves along a metal plate at high temperatures brass which has a slow L and S wave velocities was chosen. Mode conversion method was used to convert L to S waves in the wedge. The mode conversion efficiency is 90.8%. The wedge has been tested up to 150°C. The L and S waves in the wedge have been converted to symmetrical, anti-symmetrical and shear horizontal plate acoustic waves in a stainless steel plate. Experimental measurements demonstrated that the guided acoustic waves, in particular, shear horizontal plate waves using high temperature wedges may be an excellent approach for non-destructive testing and structural health monitoring of metal structures.
Keywords: Ultrasonic wedge, Structural health monitoring, Non-destructive testing, integrated ultrasonic transducers, Guided plate acoustic waves, Piezoelectric thick films, Sol-gel process.
INTRODUCTION
Guided acoustic waves are of attraction for non-destructive testing (NDT) [1, 2] and structural health monitoring (SHM) applications [3, 4] because they may inspect parts or structures, in particular, made of metals of a large area within a short time period using a few ultrasonic transducers (UTs). For aerospace industry such NDT and SHM may require that the UTs operate from -80°C to 100°C. In other areas the operation temperatures may be required to be higher [5-7]. Guided waves may be plate (PAWs) or surface acoustic waves (SAWs).
Wedges made of Plexiglas are commonly used to convert longitudinal (L) or shear (S) waves in the Plexiglas into guided PAWs and SAWs along metallic plates or pipes for NDT [1, 8] and SHM purposes. The main advantages of Plexiglas are due to its low ultrasonic velocity, VL,Wedge, or VS,Wedge and ease for machining, where VL and VS are the L and S wave
velocity, respectively. The low velocity of a wedge is a necessary to meet the conversion angle according to the Snell’s law (or acoustic phase matching condition). For example, in the case of a plate, Sin θ = VWedge/VPAW or Sin θ = VWedge/VSAW, where θ is the angle of the wedge and VPAW and VSAW, are the phase velocity of specific mode of PAWs and SAWs, respectively of a plate. It also means that VWedge is slower than VPAW or VSAW. However, the
operation temperature of the Plexiglas is limited to less than 100°C. In order to operate at high temperature (HT) wedges made of metal may be preferred. In general, brass provides low VL and VS and it may function up to more than 600°C, thus it is chosen as the HT wedge
material in this investigation.
For NDT and SHM broad bandwidth of the ultrasonic signals is also desired. Normally the broad bandwidth of an ultrasonic transducer (UT) is to have the proper backing. However, it is difficult to construct a robust backing material for HT UT [5-7]. In this study sol-gel fabricated HT integrated L wave UTs [9-11] will be used together with L to S wave mode conversion technique [12, 13] to produce broad bandwidth shear waves in the brass wedge in order to launch PAWs and SAWs in the metal plate for NDT and SHM purposes.
INTEGRATED ULTRASONIC TRANSDUCER AND MODE CONVERSION
Recently, integrated ultrasonic transducers (IUTs) have been made using the sol-gel based fabrication process [10, 11] consists of six main steps: (1) preparing high dielectric constant lead-zirconate-titanate (PZT) solution, (2) ball milling of piezoelectric PZT powders to submicron size, (3) sensor spraying using slurries from steps (1) and (2) to produce a layer of PZT composite (PZT-c) film, (4) heat treatment to produce a solid composite PZT-c film, (5) corona poling to obtain piezoelectricity, and (6) electrode painting or spraying for electrical connections. Steps (3) and (4) are used multiple times to produce proper film (IUT) thickness for optimal ultrasonic operating frequencies. It is the objective to use such IUTs to achieve L UTs. The typical PZT-c film thickness in this study is about 84 µm. Such IUTs has been operated with a center frequency ranging from 4 to 30 MHz. Their ultrasonic signal strength and bandwidth is comparable to those of the commercially available broadband UTs with backing, however, IUTs can be used at high temperatures [11].
The mode conversion from L to S waves due to reflection at a solid-air interface, as shown in Figure 1, was reported [12, 13]. It means that the L wave IUT together with L-S mode conversion caused by the reflection at a solid-air interface can generate S waves effectively and be used as an S wave probe. Our approach considers a simple way to
fabricate the L wave IUT and let the L IUT be in a plane parallel to axial direction of the probe as shown in Figure 1. The only criterion is that in Figure 1 Cot θ is equal to VS / VL in
the probe so that the mode converted shear waves will propagate in the direction parallel to the axial direction of the probe. In Figure 1 Li, Lr and Sr are the incident L, reflected L and reflected S wave, respectively. In this study, a brass with the L wave velocity VL = 4295 m/s
and S wave velocity VS = 2223 m/s was used as the probe material. Therefore one can obtain
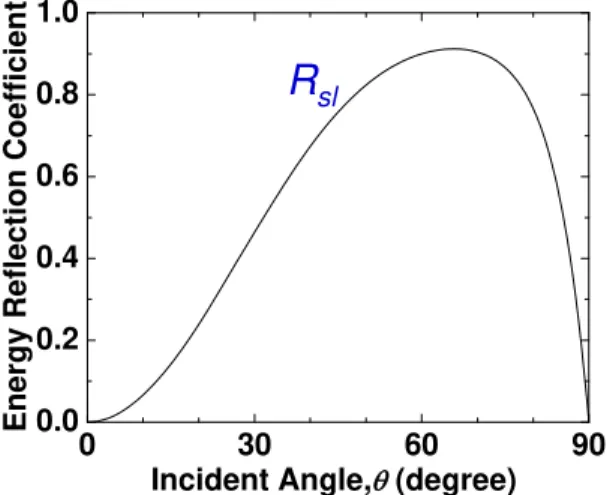
θ = 62.6°. Using the energy reflection coefficient formula reported in Reference [13] the calculated energy conversion rate versus θ is given at Figure 2. In Figure 2 at θ = 62.6° the energy conversion rate is 90.8% that is 0.4% smaller than the maximum conversion rate at θ = 65.7°. In Figure 1 an L wave IUT is also made at the top flat surface of the wedge and it can generate and receive the L wave along the axial direction of the probe as well. The arrangement shown in Figure 1 enables both L and S waves propagate together along the axial direction of the probe which will be further explained below.
L UT Li Lr Sr ϕ θ θ θ Probing End L L UT
Fig. 1: Reflection and mode conversion with an incidence of L wave at a solid-air interface.
0 30 60 0.0 0.2 0.4 0.6 0.8 1.0 90
Energy Reflection Coefficient
Incident Angle,θ (degree)
R
sl
Fig. 2: Reflection and mode conversion with an incidence of L wave at a brass-air interface. Using the L to S wave mode conversion principle shown in Figure 1 if one would like to generate two shear waves with orthogonal polarizations (birefringence) simultaneously, then
θ = 62.6° will be made at two orthogonal edges as shown in Figure 3. Figure 3 shows an integrated probe having three L wave IUTs which will generate and receive one L and two S waves with orthogonal polarizations. Let one S be S⊥ polarized in Y direction and the other
S// polarized in X direction. L wave is polarized in Z direction. S⊥ and S// are designated arbitrarily. Figure 4 shows the measured ultrasonic signal Ln in time domain and pulse-echo mode from the end of the probe at 150°C. Ln is the nth trip echo through the axial direction of the probe. Figures 5a and 5b show the measured ultrasonic signal S⊥n and S//n, respectively reflected from the end of the probe in time domain and pulse-echo mode at 150°C where the time delay of Sn is that of the nth trip S echo through the probe length plus that of the L wave travelling through the length from L IUT to the brass/air interface. The measurement results shown in Figures 4, 5a and 5b can be made simultaneously using a three-channel ultrasonic system or the electrical connections of the three L IUTs can be connected to use ultrasonic system of reduced channel such as two or one. The center frequency and 6 dB bandwidth of the L2 signal shown in Figure 4 are 6 MHz and 3.7 MHz, respectively. Its SNR is 43.7 dB. The SNR is defined as the ratio of the signal L2 over that of the surrounding noises. The center frequency and 6 dB bandwidth of the S⊥2 and S//2 signals shown in Figures 5a and 5b are 5.6 MHz and 3.1 MHz, and 4.9 MHz and 2.8 MHz, respectively. Their SNRs are 15.5 dB and 23.9 dB, respectively. The echo LS indicated in Figures 5a and 5b are undesired and it comes from the reflection of L waves from the edge opposite to the L IUT surface within the probe head area shown in Figure 3 because its arrival time is shorter than L2 shown in Figure 4. It is noted that such probe shown in Figure 3 may be used as an ultrasonic interferometer which is sensitive to, for example, the anisotropy of the material to be measured, which induces a difference in particle displacement direction or velocity or both between two shear wave propagations along the material.
Y
X L IUT for S//
L IUT for S⊥ L IUT
Fig. 3: An integrated S wave probe having two polarizations (S⊥ and S//) generated and received by two IUTs.
10 20 30 40 Amplit ude (ar b . uni t) Time Delay (µs) L2 L4
Fig. 4: Ultrasonic signal in time domain of the L wave generated by the L IUTs shown in Fig. 3 reflected from the end of the probe at 150°C.
10 20 30 40 Amplitud e (arb. unit) Time Delay (µs) S⊥2 LS (a) 10 20 30 40 Amplit
ude (arb. unit
)
Time Delay (µs)
S//2
LS
(b)
Fig. 5: Ultrasonic signal in time domain of the (a) S⊥ and (b) S// wave generated by the L IUTs shown in Fig. 3 reflected from the end of the probe at 150°C.
CONVERSION FROM L AND S WAVES IN BRASS WEDGE TO PAWS IN A SS PLATE
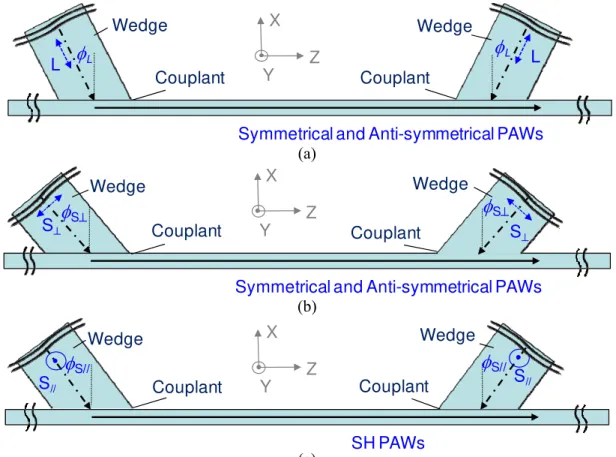
Figures 6a, 6b and 6c shows the intended NDT and SHM applications in which the probe shown in Figure 3 is cut into a slanted angle φ to become a wedge so that the L wave in Figure 6a and S⊥wave in Figure 6b and S// in Figure 6c propagating along the axial direction of the wedge will be converted to the desired PAWs along the metal plate which is made of a SS here.
Symmetrical and Anti-symmetrical PAWs L Wedge Couplant
φ
L Z X Yφ
L L Wedge Couplant (a)Symmetrical and Anti-symmetrical PAWs S⊥ Wedge Couplant
φ
S⊥ Z X Y Wedge Couplant S⊥φ
S⊥ (b) SH PAWs S// Wedge Couplant φS// Z X Y S// Wedge Couplant φS// (c)Fig. 6: Configurations of wedges for (a) L waves to Sn and/or an (b) S⊥ waves to Sn and/or an and (c) S// waves to SHn PAWs.
If the thickness of the plate is more than ten wavelengths, then SAW propagation will be feasible if a proper angle φ is chosen. Let Sn be the symmetrical, an be the anti-symmetrical and SHn be the shear horizontal (SH) PAWs, where n denotes high order modes. The tips of the wedges in Figure 6a, 6b and 6c are not given but will be shown below. The operation can be in transmission mode which means that the one wedge shown in Figures 6a, 6b and 6c is used as the transmitting transducer and the other the receiver. If the wedge is operated in pulse-echo mode, each of them can be used as both the transmitting and receiving transducer. It is also one major interest of this study that can the same wedge angle φ be used for φL, φS⊥,
and φS// to generate different PAWs efficiently and even simultaneously if the L IUTs can be
connected electrically. Theoretical Calculations:
A stainless steel (SS) plate with a thickness of 1.9 mm, a width of 50.8 mm is selected for this study. For this SS the dispersion curves of both phase (dashed lines) and group velocities (solid lines) of Sn, an and SHn waves are calculated and given in Figures 7, 8 and 9, respectively, where n indicates the high order modes. The frequency of the PAW and the plate thickness are expressed as f and h, respectively.
0 5 10 15 20 25 30 0 1000 2000 3000 4000 5000 6000 7000 8000 9000 10000
Velocity (m/s)
fh (MHz-mm)
S0 S1 S2 S3 S4 S5 S6 S7 S8 S9 S10 S11 S12 S0 S1 S2 S3 S4 S5 S6 S7 S8 S9 S10 S11 S12Fig. 7: Theoretical calculated velocities versus f*h, curves for the Sn PAWs in the 1.9 mm thick SS plate. Dashed and solid lines represent phase and group velocities,
0 5 10 15 20 25 30 0 1000 2000 3000 4000 5000 6000 7000 8000 9000 10000
Velocity (m
/s)
fh (MHz-mm)
a0 a1 a2 a3 a4 a5 a6 a7 a8 a9 a10 a11 a12 a0 a1 a2 a3 a4 a5 a6 a7 a8 a9 a10 a11 a12Fig. 8: Theoretical calculated velocities versus f*h, curves for the an PAWs in the 1.9 mm thick SS plate. Dashed and solid lines represent phase and group velocities,
respectively. 0 5 10 15 20 25 30 0 1000 2000 3000 4000 5000 6000 7000 8000 9000 10000
Velocity (m/s)
fh (MHz-mm)
SH8 SH9 SH10 SH11 SH12 SH0 SH1 SH2 SH3 SH4SH5 SH6 SH7 SH13 SH14SH15 SH16 SH17 SH8 SH9SH 10 SH11 SH12 SH2 SH3SH 4 SH5SH 6 SH7 SH13SH 14 SH15SH 16 SH17 SH1Fig. 9: Theoretical calculated velocities versus f*h, curves for the SHn PAWs in the 1.9 mm thick SS plate. Dashed and solid lines represent phase and group velocities,
respectively.
Experimental Results:
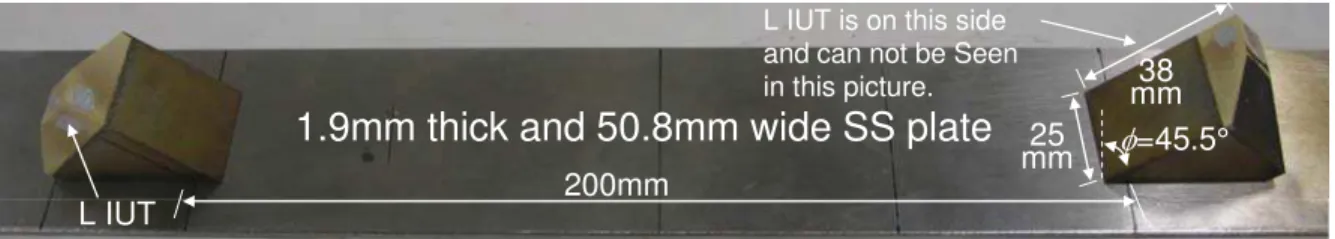
The experimental setup for the S// wave in the wedge to excite and receive SH PAWs in the plate is shown in Figure 10. The angle 45.5° of φS// is chosen because of Snell’s law φS// =
is preferred for many NDT and SHM applications. Also the higher order modes of SHn (n ≠ 0) have slower group velocities than that of SH0 and may not be excited and received efficiently. Figure 11 shows the result of the measurement in transmission mode at room temperature. The separation distance between the centers of the two wedges on the SS plate is also 200 mm. The echo PSH0 indicated in Figure 10 does not go through any signal processing. The preliminary analysis indicates that the echo comes mainly from SH0 mode shown in Figure 9 because little dispersion is exhibited. Its center frequency and 6 dB bandwidth of the PSH0 signal are 5.3 MHz and 3 MHz, respectively.
L IUT
1.9mm thick and 50.8mm wide SS plate
200mm
38 mm 25
mm
L IUT is on this side and can not be Seen in this picture.
φ=45.5°
Fig. 10: The experimental setup for the S// wave in the wedge to excite and receive SH PAWs in the SS plate.
50 100 150 200
Amplitude (arb. unit)
Time Delay (µs)
PSH0
Fig. 11: Ultrasonic measurement results in transmission mode shown in Fig. 10 at room temperature. The distance between the centers of the two wedges is 200 mm.
Figure 12 shows the experimental setup for the L wave in the wedge to excite and receive PAWs in the SS plate. The angle of φL equal to 45.5° which is the same as φS// is
chosen because it is the intention to see which Sn or an PAWs can be generated and received. From the Snell`s law if φL is equal to 45.5°, the VPAW should be a value of near 6022 m/s,
then according to the data shown in Figures 7 and 8 S5 and/or a5 PAWs may be excited and received. Figure 13 shows the measurement result in transmission mode at room temperature. The separation distance between the centers of the two wedges is also 200 mm. The echo Pa5 indicated in Figure 13 has gone through a band pass filter between 7.5 MHz and 8.5 MHz. The preliminary analysis indicates that this echo with a group velocity of 4160 m/s comes mainly from a5 mode shown in Figure 8 and S5 was not efficiently excited and received using this configuration.
L IUT L IUT
φ=45.5°
1.9mm thick and 50.8mm wide SS plate
200mm
38 mm 25
mm
Fig. 12: The experimental setup for the L wave in the wedge to excite and receive PAWs in the SS plate
50 100 150 200
Amplitude (arb. unit)
Time Delay (µs) Pa5
Fig. 13: Ultrasonic measurement results in transmission mode shown in Fig. 12 at room temperature. The distance between the centers of the two wedges is 200 mm.
L IUT
1.9mm thick and 50.8mm wide SS plate
200mm 38 mm 25 mm L IUT φ=45.5°
Fig. 14: The experimental setup for the S⊥ wave in the wedge to excite and receive PAWs in the SS plate.
50 100 150 200
Amplitude (arb. unit)
Time Delay (µs) Pa0
Fig. 15: Ultrasonic measurement results in transmission mode shown in Fig. 14 at room temperature. The separation distance between the center of the two wedges is 200 mm.
For the S⊥ wave in the wedge to excite and receive Sn and an PAWs in the plate the angle of φS⊥ equal to 45.5° is again chosen with an intention to see that if the same wedge
used in Figures 10 and 12 is used, which PAW can be excited and received. The measurement setup is shown in Figure 14. Figure 15 provides the measurement result in transmission mode at room temperature. The separation distance between the centers of the two wedges is 200 mm as well. The echo Pa0 indicated in Figure 15 has gone through a band pass filter between 2 MHz and 3 MHz. The preliminary analysis indicates that the echo comes mainly from a0 mode shown in Figure 8 because of the slow velocity of 2941 m/s.
It is interesting to note that the wedges used in the measurement setups shown in Figures 10, 12 and 14 have the same φ. The reason is that in the future work it is the intention to see for a specific plate sample whether one can use wedges of same φ to excite and receive three different PAWs efficiently using the L, S⊥ and S// waves in the wedge. If this can be achieved, this wedge will be an excellent candidate for NDT and SHM of this plate sample.
CONCLUSIONS AND DISCUSSIONS
Wedges in which L, S⊥ and S// waves can propagate simultaneously are presented. In order to use this wedge to generate and received guided PAWs along a SS plate with a thickness of 1.9 mm and a width of 50.8 mm at high temperatures brass which has a slow L and S wave velocities was chosen. Mode conversion method was used to convert L to S⊥ and L to S// waves in brass wedge. The energy conversion efficiency is 90.8%. The wedge has been tested up to 150°C. By way of proper electrical connections L, S⊥ and S// waves can be generate and received simultaneously or individually. In the experiments it is demonstrated that with a wedge angle of 45.5° L, S⊥ and S// waves in the wedge has generated and received a5, a0 and SH0 PAW, respectively in the SS plate. The same angle φ of 45.5° is used so that one may use wedges of same φ to excite and receive three different PAWs efficiently in the wedge via proper electrical connections of all three L IUTs shown in Figure 3. Experimental measurements demonstrated that the guided PAWs using high temperature wedges may be an excellent approach for NDT and SHM of metal structures.
ACKNOWLEDGMENT
Financial support from the Natural Sciences and Engineering Research Council of Canada and technical assistance of M. Kobayashi are acknowledged.
REFERENCES
1. Moore, P.O., Workman, G.L. and Kishoni, D., “Nondestructive Testing Handbook”, 3rd ed., vol.7: Ultrasonic Testing, ASNT, 2007.
2. Dalton, R.P., Cawley, P. and Lowe, M.J.S., “The potential of guided waves for monitoring large areas of metallic aircraft structure”, J. Nondestructive Evaluation, vol.20, pp.29-46, 2001.
3. Giurgiutiiu, V., “Structural Health Monitoring with Piezoelectric Wafer Active Sensors”, New York: Elsevier, 2007.
4. Ihn, J.-B. and Chang, F.-K., “Ultrasonic non-destructive evaluation for structure health monitoring: built-in diagnostics for hot-spot monitoring in metallic and composite structures”, Chapter 9 in Ultrasonic Nondestructive Evaluation Engineering and Biological Material Characterization, edited by Kundu T., CRC Press, NY, 2004.
5. Kazys, P., Voleisis, A., Sliteris, R., Voleisiene, B., Mazeika, L. and Abderrahim, H.A., “Research and development of radiation resistant ultrasonic sensors for quasi-image forming systems in a liquid lead-bismuth”, Ultragarsas, vol.62, 2008, pp.7-15.
6. Kelly, S.P., Atkinson, I., Gregory, C. and Kirk, K.J., “On-line ultrasonic inspection at elevated temperatures”, Proc. IEEE Ultrasonics Symp., pp. 904-908, 2007.
7. Kobayashi, M., Jen, C.-K., Bussiere, J.F. and Wu, K.-T., “High temperature integrated and flexible ultrasonic transducers for non-destructive testing”, NDT&E Int., vol.42, pp.157-161, 2009.
8. Kino, G.S., “Acoustic Waves, Devices, Imaging & Analog Signal Processing”, New Jersey, Prentice-Hall, 1987.
9. Barrow, D.A., Petroff, T.E., Tandon, R.P. and Sayer, M., “Characterization of thick lead zirconate titanate films fabricated using a new sol gel based process”, J. Appl. Phys., vol.81, pp. 876-881, 1997.
10. Kobayashi, M. and Jen, C.-K., “Piezoelectric thick bismuth titanate/PZT composite film transducers for smart NDE of metals”, Smart Materials and Structures, vol.13, pp.951-956, 2004.
11. Kobayashi, M., Jen, C.-K., Bussiere, J.F. and Wu, K.-T., “High temperature integrated and flexible ultrasonic transducers for non-destructive testing”, NDT&E Int., vol.42, pp.157-161, 2009.
12. Si-Chaib, M.O., Djelouah, H., and Bocquet, M., “Applications of ultrasonic reflection mode conversion transducers in NDT,” NDT&E Int’l, vol. 33, pp. 91-99, 2000.
13. Jen, C.-K., Ono, Y., and Kobayashi, M., “High temperature integrated ultrasonic shear wave probes”, Applied Phys. Lett., vol.89, pp.183506_1 to 3, 2006.