Publisher’s version / Version de l'éditeur:
Journal of Power Sources, 195, 22, pp. 7594-7599, 2010-06-16
READ THESE TERMS AND CONDITIONS CAREFULLY BEFORE USING THIS WEBSITE. https://nrc-publications.canada.ca/eng/copyright
Vous avez des questions? Nous pouvons vous aider. Pour communiquer directement avec un auteur, consultez la
première page de la revue dans laquelle son article a été publié afin de trouver ses coordonnées. Si vous n’arrivez pas à les repérer, communiquez avec nous à PublicationsArchive-ArchivesPublications@nrc-cnrc.gc.ca.
Questions? Contact the NRC Publications Archive team at
PublicationsArchive-ArchivesPublications@nrc-cnrc.gc.ca. If you wish to email the authors directly, please see the first page of the publication for their contact information.
NRC Publications Archive
Archives des publications du CNRC
This publication could be one of several versions: author’s original, accepted manuscript or the publisher’s version. / La version de cette publication peut être l’une des suivantes : la version prépublication de l’auteur, la version acceptée du manuscrit ou la version de l’éditeur.
For the publisher’s version, please access the DOI link below./ Pour consulter la version de l’éditeur, utilisez le lien DOI ci-dessous.
https://doi.org/10.1016/j.jpowsour.2010.06.023
Access and use of this website and the material on it are subject to the Terms and Conditions set forth at
Degradation of a polymer exchange membrane fuel cell stack with
Nafion® membranes of different thicknesses: Part I. In situ diagnosis
Yuan, Xiao-Zi; Zhang, Shengsheng; Wang, Haijiang; Wu, Jinfeng; Sun, Jian
Colin; Hiesgenb, Renate; Friedrichc, K. Andreas; Schulzec, Mathias; Haug,
Andrea
https://publications-cnrc.canada.ca/fra/droits
L’accès à ce site Web et l’utilisation de son contenu sont assujettis aux conditions présentées dans le site LISEZ CES CONDITIONS ATTENTIVEMENT AVANT D’UTILISER CE SITE WEB.
NRC Publications Record / Notice d'Archives des publications de CNRC:
https://nrc-publications.canada.ca/eng/view/object/?id=5f8a3ff8-68db-408b-ac51-d608cccf1b01
https://publications-cnrc.canada.ca/fra/voir/objet/?id=5f8a3ff8-68db-408b-ac51-d608cccf1b01
Other uses, including reproduction and distribution, or selling or
licensing copies, or posting to personal, institutional or third party
websites are prohibited.
In most cases authors are permitted to post their version of the
article (e.g. in Word or Tex form) to their personal website or
institutional repository. Authors requiring further information
regarding Elsevier’s archiving and manuscript policies are
encouraged to visit:
Author's personal copy
Journal of Power Sources 195 (2010) 7594–7599
Contents lists available atScienceDirect
Journal of Power Sources
j o u r n a l h o m e p a g e :w w w . e l s e v i e r . c o m / l o c a t e / j p o w s o u r
Degradation of a polymer exchange membrane fuel cell stack with Nafion
®
membranes of different thicknesses: Part I. In situ diagnosis
Xiao-Zi Yuan
a, Shengsheng Zhang
a, Haijiang Wang
a,∗, Jinfeng Wu
a, Jian Colin Sun
a,
Renate Hiesgen
b, K. Andreas Friedrich
c, Mathias Schulze
c, Andrea Haug
c aInstitute for Fuel Cell Innovation, National Research Council Canada, Vancouver, BC, Canada V6T 1W5bUniversity of Applied Sciences Esslingen, Department of Basic Science, Kanalstrasse 33, 73728 Esslingen, Germany cInstitute of Technical Thermodynamics, German Aerospace Center, Pfaffenwaldring 38-40, 70569 Stuttgart, Germany
a r t i c l e
i n f o
Article history:
Received 4 May 2010
Received in revised form 8 June 2010 Accepted 9 June 2010
Available online 16 June 2010
Keywords:
Proton exchange membrane fuel cell Stack In situ Durability Idle conditions Degradation
a b s t r a c t
The durability of polymer exchange membrane (PEM) fuel cells, under a wide range of operational conditions, has been attracting intensive attention, as durability is one of the largest barriers for com-mercialization of this promising technology. In the present work, membrane electrode assembly (MEA) degradation of a four-cell stack with Nafion membranes of different thicknesses, including N117, N115, NR212, and NR211, was carried out for 1000 h under idle conditions. By means of several on-line electro-chemical measurements, the performance of the individual cells was analyzed at different times during the degradation process. The results indicate that the cells with thinner membranes have a lower open circuit voltage (OCV) due to the higher fuel crossover. Before degradation, the thickness of the membranes correlates with performance of the cell. However, with the advancement of degradation, the performance of cells with thinner membranes degraded much faster than those with thicker membranes, especially after 800 h of operation. The fast performance degradation for thinner membranes is evident by a dramatic increase in hydrogen crossover indicating membrane thinning or pinhole formation.
Crown Copyright © 2010 Published by Elsevier B.V. All rights reserved.
1. Introduction
The durability of proton exchange membrane (PEM) fuel cells is one of the biggest challenges and barriers for commercializing this promising technology. As a result, numerous research activi-ties have investigated the failure modes of degradation in order to reduce the wide gap that exists between the ideal and the state-of-the-art lifetimes of PEM fuel cells. Only a relatively small number of studies have investigated degradation across real PEM fuel cell lifetimes due to high costs and prolonged testing periods required. However, various ex situ accelerated tests have been proposed and implemented to explore degradation mechanisms of individual components in PEM fuel cells.
To reduce the experimental time required, different undesirable operating conditions have been utilized as the in situ accelerated stressors, such as load cycling[1,2], start–stop cycles[3], low rel-ative humidity (RH)[4,5] or RH cycling[6], freeze–thaw cycles [7]as well as fuel[8,9]or air starvation[10]. Open circuit (OC)
∗Corresponding author at: Institute for Fuel Cell Innovation, National Research Council Canada, 4250 Wesbrook Mall, Vancouver, BC, Canada V6T 1W5.
Tel.: +1 604 221 3038; fax: +1 604 221 3001.
E-mail address:haijiang.wang@nrc-cnrc.gc.ca(H. Wang).
operation has also been recognized as an effective stressor for accel-erated testing and the accelaccel-erated effects of OC operation on the degradation of PEM fuel cell components, including the PEM and catalyst layers, have been investigated[11–15]. The increased gas crossover due to zero reactant consumption under OC conditions was believed to be the major reason for the high degradation rate of the membrane[16]. Similar to the zero electric load condition of OC operation, another effective stressor is close to OC opera-tion, which utilizes so called idle conditions with a very low current density running on the cell. In practice, the degradation of fuel cell components under OC or idle conditions is one of the most crucial deterrents that affect a fuel cell’s durability, especially for automo-tive fuel cell systems[17], because these two circumstances occur frequently over the entire lifetime of a PEM fuel cell. For example, the idle time may amount to several thousand hours over the entire lifetime of the fuel cell[18].
While investigating the degradation of different components, accelerated stress tests have shown that membrane degradation is one of the major failure modes of a PEM fuel cell. Various accel-erated testing for membrane degradation has been conducted: for example, Fenton’s test, using a H2O2 solution containing a trace
amount of Fe2+, has been commonly employed as an ex situ method
to analyze the chemical degradation of membranes[19,20]. The stress–strain test[21]and relative humidity (RH) cycling[6]have
0378-7753/$ – see front matter. Crown Copyright © 2010 Published by Elsevier B.V. All rights reserved. doi:10.1016/j.jpowsour.2010.06.023
Table 1
Properties of Nafion®PFSA membranes.
Membrane type Typical thickness (m) Basis weight (gm−2)
NR211 25.4 50
NR212 50.8 100
N115 127 250
N117 183 360
been selected as accelerated means for understanding the mechan-ical degradation of membranes. Other conditions such as load cycling[22,23], and subzero storage, start-up and operation[24,25], which relate to frequent and/or severe humidity condition changes, were also addressed as accelerated stressors in membrane degra-dation research. Although there has been extensive research into membrane degradation, further understanding is still needed.
Previously, we looked at performance degradation of a single cell under open circuit voltage (OCV)[15]and a six-cell stack under idle conditions[26]. In this study, we will report our preliminary results of a four-cell stack degradation using Nafion membranes of different thicknesses, including N117, N115, NR212, and NR211. This four-cell stack, with a 50 cm2 active area, was tested on an
Arbin 500W Fuel Cell Test Station under idle conditions. The cell performance and electrochemical characteristics were measured around every 200 h of operation. The electrochemical diagnostic tools used in this experiment included OCV, polarization curve (IV), electrochemical impedance spectroscopy (EIS), and linear sweep voltammetry (LSV). Ex situ measurements, including SEM, IR imag-ing, gas permeability, exhaust species detection, FTIR, and XPS, before and after degradation will be discussed in a separate paper.
2. Experimental
2.1. Fuel cell materials and testing apparatus
The fuel cell tested was a four-cell stack with an active area of 50 cm2. The materials used were Ion Power customized catalyst
coated membranes (CCMs) (N117, N115, NR212, and NR211) with a Pt catalyst loading of 0.3 mg cm−2supported on carbon on both
sides and SGL gas diffusion layers (GDLs). The major properties of these membranes are listed inTable 1.
After assembling the MEAs in the four-cell stack, the stack was connected to the gas supplies of a 500W Arbin Test Station. In the stack the cells were named as Cell 1 (with N117 CCM), Cell 2 (with N115 CCM), Cell 3 (with NR212 CCM), and Cell 4 (with NR211 CCM) from the bottom to the top. Before activating the stack by load cycling, the stack was checked for leaking. For the activation pro-cess, each cycle consisted of a constant voltage at 1.6 V for 5 min, and a constant current at 7.5 A for 5 min. The cycle was repeated for 24 h.
After activation and before the membrane degradation test under idle conditions, the baseline performance data were mea-sured. During the degradation test, the four-cell stack was operated at a constant current of 0.5 A (10 mA cm−2). The fuel cell stack
temperature was kept at 70◦C and air and hydrogen were fully
humidified prior to their delivery into the fuel cell. The flow rates for air and hydrogen were set at 1.0 and 2.0 standard litres per minute (slpm), respectively.
2.2. In situ electrochemical measurements
Before and after every 200 h of operation under idle condi-tions, OCV, IV, EIS, and LSV were conducted to determine the performance, the fuel cell internal resistance, and the hydrogen crossover rate. For impedance measurements, a Solartron SI-1260 Impedance/Gain-Phase Analyzer was used in combination with
Fig. 1. Voltage degradation trends for individual cells under idle conditions for 1000 h (operating conditions: flow rate H2/air = 1/2 slpm, cell temperature 70◦C and
fully humidified on both sides).
the Solartron SI-1287 Electrochemical Interface. For hydrogen crossover measurements, only the Solartron SI-1287 Electrochem-ical Interface was used.
During the polarization curve measurement, the stack was oper-ated at 70◦C and fully humidified air and hydrogen were supplied
to the stack at stoichiometries of 2.5 and 1.5, respectively. When the LSV and EIS measurements were performed, the testing stack was also kept at 70◦C and hydrogen and nitrogen were introduced
to the anode and cathode at constant flow rates of 1.0 and 2.0 slpm, respectively. For the LSV measurement, the potential of the cath-ode was linearly swept from 0.05 to 0.5 V against the ancath-ode at a rate of 5 mV s−1. The EIS measurement was carried out at the open
circuit potential. A small alternating voltage perturbation (10 mV) was imposed on the cell over a frequency range from 10 kHz to 0.03 Hz.
3. Results and discussion
3.1. Degradation curves
Fig. 1shows the voltage degradation curves of each individ-ual cell of the stack up to 1000 h under idle conditions (0.5 A or 10 mA cm−2). A decreasing trend of voltage can be observed. During
the 1000 h of degradation, the operation of the stack was stopped to carry out electrochemical measurements of OCV, IV, EIS, and LSV about every 200 h of operation. Two accidental shutdowns of the station occurred due to a computer update at about 500 h, and an air compressor shutdown at around 900 h. As can be seen inFig. 1, from 600 to 800 h Cell 4, with the NR211 membrane, degrades significantly whereas other cells do not have drastic degradation; from 800 to 1000 h, both Cell 4 and Cell 3 (with the NR212 mem-brane) degrade dramatically while Cell 1 and Cell 2 still retain a slight degradation rate. From these results we believe that: (1) significant degradation occurred for Cell 4 during 600–800 h; (2) devastating degradation for Cell 4 and significant degradation for Cell 3 occurred during 800–1000 h. The reason for these degrada-tions may be the membrane failure after the long-term operation, which will be examined later by other results in this work. Also, from this degradation trend we can see that for all the MEAs with membranes of different thicknesses, the voltage degradation is par-tially recoverable after an interruption. This is in agreement with our previous degradation tests under idle conditions[26]and OC operation[15].
The individual cell degradation rate under this accelerated stres-sor is listed in Table 2. At different stages, the cell degrades with a different rate. For Cell 1 and Cell 2 with thicker mem-branes, the degradation rate during the first 200 h was much higher than those during the subsequent periods. This phenomenon was also observed in our previous OCV experiment [15], and can be explained by the size effect of the catalyst. At the beginning of
Author's personal copy
7596 X.-Z. Yuan et al. / Journal of Power Sources 195 (2010) 7594–7599
Table 2
Degradation rate of individual cells with membranes of different thicknesses for each session.
Membrane type 0–200 h mV h−1 200–400 h mV h−1 400–600 h mV h−1 600–800 h mV h−1 800–1000 h mV h−1 Average mV h−1 N117 0.54 0.27 0.26 0.28 0.27 0.09 N115 0.53 0.21 0.21 0.25 0.22 0.09 NR212 0.65 0.20 0.19 0.19 0.45 0.18 NR211 0.64 0.21 0.25 0.25 0.64 0.26
degradation, the nano-scale catalyst particles are facile to grow at a relatively high speed under these accelerated conditions. As the degradation proceeds, the growth of the catalyst particle size becomes relatively stable. This particle size effect has also been noticed in different potential oriented experiments[27,28]. For Cell 3 and Cell 4 with thinner membranes, the degradation rate also follows the same trend as thicker membranes for about 600 h. How-ever, when the experiment further proceeds to the last few hundred hours within this test, the degradation rates of Cell 3 and Cell 4 increase significantly, which implies the cells degrade severely. Apparently, the loss of catalyst surface area with concurrent gradual performance decrease is not the dominant failure mode in this time domain. FromTable 2, we also see that the average degradation rate of each cell for the entire degradation process is much lower than those for each session, as the entire process was interrupted sev-eral times, which partially recovered the potential loss. Obviously, the degradation rates for different cells increase with decreas-ing the membrane thickness. In addition, the degradation rates (>0.09 mV h−1) observed under idle conditions are much higher
than those under steady state operation (with a degradation rate between 2 and 10 V h−1[29]). This can be explained by the high
reactant concentration under idle conditions due to an extremely small operating current, resulting in a high reactant crossover, and then a high radical formation rate. The radicals produced are known to be the major cause for the chemical/electrochemical degradation of the membrane[30–32].
3.2. Electrochemical characterization during degradation testing 3.2.1. OCV
Fig. 2shows the OCV degradation trend as a function of time. Similar to the degradation trend of the idle potential inFig. 1, we can see: (1) at the very beginning and any testing times, the OCV decreases in the order of N117, N115, NR212, and NR211, due to higher hydrogen crossovers for thinner membranes (NR212 and NR211); (2) for all the MEAs with membranes of different thick-nesses, the OCV degrades faster for the first 200 h; (3) after 200 h, OCVs for MEAs with thicker membranes (N117 and N115) do not change much due to unchanged hydrogen crossover; (4) dramatic OCV decay occurred for thinner membranes after 800 h of opera-tion due to significantly increased membrane degradaopera-tion. Similar phenomena were also observed for performance degradation using
Fig. 2. OCV degradation trend for individual cells under idle conditions for 1000 h of degradation.
polarization curves. These phenomena can be attributed to the differing hydrogen crossover through membranes with different thicknesses.
Zhang et al.[33]have calculated the deviation of theoretical and measured OCVs. They believe that the OCV drop from the theoret-ical value is a result of the mixed potential and H2crossover. As
expected by the prediction, they also observed that a cell with a thicker membrane would have a higher OCV due to a lower gas crossover, which completely agrees with our results shown inFig. 2. More recently, Vilekar and Datta[34]built a model to predict the effect of H2permeation on OCV in PEM fuel cells. They found that
hydrogen crossover is a critical parameter for OCV drop. As a result, they considered OCV as an important indicator that determines the physical well being of the membrane during prolonged oper-ation, and identifies any membrane degradation in the form of membrane thinning or pinhole formation. In our case, we can con-sider that after 800 h of operation under idle conditions, membrane thinning or pinhole formation is being developed for the thinner membranes, NR212 and NR211.
3.2.2. Polarization curve
Before and after each 200 h of operation under idle conditions, polarization curves were measured to observe the performance degradation for each MEA with membranes of different thicknesses. Just as with OCV, we compared the performances of individual cells before and after each 200 h of degradation. For the thicker membranes, we can observe a marginal decrease in performance between the baseline and 200 h of degradation, and very little change after 200 h. This result agrees with what we have obtained from OCV measurements shown inFig. 2. Similar results can also be observed for the NR212 cell and the NR211 cell within about 600 h, but another marginal decrease after 800 h.
Figs. 3 and 4, respectively, only show the performances of dif-ferent cells before and after 1000 h of degradation. As we can see from these polarization curves, the current was not able to go higher than 36A due to the high thickness of N117 membrane, lim-iting the proton transfer through it. It can also be seen that before degradation, the thinner the membrane is, the better the cell per-forms. However, after 1000 h of operation, cell performances of
Fig. 3. Baseline polarization curves for each cell with membranes of different thick-nesses before degradation (operating conditions: stoichiometry of H2/air = 1.5/2.5
with a minimum flow rate of H2/air = 1/2 slpm, cell temperature 70◦C and fully
Fig. 4. Polarization curves for each cell with membranes of different thicknesses after 1000 h of degradation (operating conditions: stoichiometry of H2/air = 1.5/2.5
with a minimum flow rate of H2/air = 1/2 slpm, cell temperature 70◦C and fully
humidified at both sides).
the thinner membranes drop significantly, indicating significant component deterioration during these 1000 h of operation. This performance deduction will be further confirmed by the LSV mea-surements below. Although performances for thinner membranes at low currents or current densities drop dramatically, similarly to OCV, they are still higher than thicker membranes at high currents or current densities due to the fast proton transfer through thinner membranes. Also, we noticed that after 1000 h of operation, the per-formance of NR211 becomes lower than that of NR212, which could be attributed to the higher hydrogen crossover through NR211.
Fig. 5. (a) Comparison of hydrogen crossover through MEAs with membranes of different thicknesses before degradation and (b) comparison of hydrogen crossover through the MEA with NR211 membrane before and after degradation.
Fig. 6. The effect of thickness on hydrogen crossover through membranes at differ-ent times of degradation.
3.2.3. Hydrogen crossover
Before and after each 200 h of operation under idle conditions, a LSV was scanned to observe hydrogen crossover for each cell with different membranes.Fig. 5(a) compares the crossover limiting cur-rent of the individual cells before degradation. We can see that before degradation the thinner the membrane, the more hydrogen crosses over, which explains the lower values of OCV for cells with thinner membranes.Fig. 5(b) shows the LSV result for Cell 4 (with NR211 membrane) before and after each degradation session. An obvious crossover limiting current increase can be observed after 600 h of degradation. The hydrogen crossover is further developed significantly during the subsequent degradation session and then increases dramatically and exceeds the measurement limit of the equipment after 1000 h of degradation. This measurement confirms the dominant degradation mode switch from catalyst surface area loss to membrane decay.
The effect of thickness on hydrogen crossover with degrada-tion for each cell is plotted inFig. 6. It can be seen that for thicker membranes there is no significant change in hydrogen crossover before and after degradation. However, hydrogen crossover jumps significantly for NR212 after 1000 h of operation whereas for NR211 hydrogen crossover starts to increase after 600 h of operation, and keeps increasing with degradation. This result, demonstrating a faster performance degradation of thinner membranes, agrees very well with the degradation curves shown inFig. 1, and explains the OCV degradation shown inFig. 2, as well as performance degrada-tion measured by polarizadegrada-tion curves.
3.2.4. EIS
Utilizing the EIS curves before and after every 200 h of degrada-tion, high frequency resistance (HFR) and low frequency resistance
Fig. 7. Comparison of HFR for cells with membranes of different thicknesses before and after every 200 h of degradation.
Author's personal copy
7598 X.-Z. Yuan et al. / Journal of Power Sources 195 (2010) 7594–7599
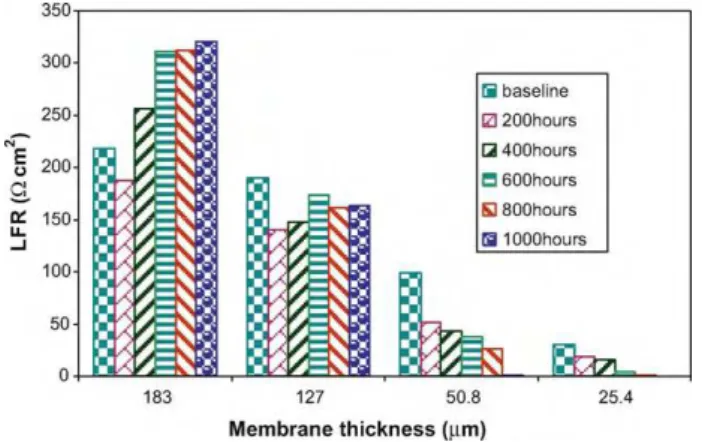
Fig. 8. Comparison of LFR for cells with membranes of different thicknesses before and after every 200 h of degradation.
(LFR) can be obtained by fitting the curves to a Randles electri-cal circuit. The results are plotted inFigs. 7 and 8, respectively. At the beginning of life, The HFR increases with thickness, as shown in Fig. 7. Also, for both thinner and thicker membranes, the HFR shows an obvious increasing trend with degradation, as shown inFig. 8. This result is in good agreement with our previous results obtained under OCV and idle conditions[15,26], and could be explained by the structural and interfacial changes in the membrane due to the degradation under accelerated stressors. However, for the cell with the thickest membrane (N117), we can observe a slight decrease in HFR during the first 200 h and then an increase during the subsequent degradation sessions like the other cells. This might be attributed to the insufficient humidification of the membrane, resulting in a lower conductivity at the very beginning. Hence, at the beginning of degradation, membrane resistance is dominated by the humidity condition of the membrane. As degradation pro-ceeds, the membranes have been fully humidified, and the structure change in the membrane becomes crucial, leading to a HFR increase with degradation time.
As for LFR, it decreases with degradation for thinner membranes, whereas for thicker membranes it decreases at the beginning of degradation, then increases. As the EIS was measured at OCV, we have:
LFR =nFiRT
0
(1)
where R is the universal gas constant (8.314 J mol−1K−1), T is the
temperature (K), n is the electron transfer number in the rate-determining step for oxygen reduction reaction, and F is Faraday constant (96,485 C mol−1). Thus, this measured LFR is related to
the apparent exchange current density, i0 (A cm−2). Parameters
that affect exchange current density include reaction type, catalyst, temperature, and electrolyte (membrane). Here obviously, mem-brane and catalyst are the two major stimuli for the measured LFR difference. As seen inFig. 8, the thicker the membrane, the higher the LFR and the lower the apparent exchange current density resis-tance it has due to the higher crossover current though thinner membranes.
For thinner membranes, as the hydrogen crossover and its lim-iting current are much higher and increase with degradation, a steady decreasing trend of LFR can be observed. This is explained by a decrease in charge transfer resistance with current due to the increased driving force[35]. For thicker membranes, the change in hydrogen crossover before and after degradation is not obvi-ous. Therefore, catalyst degradation plays a key role in these cases. With the progress of catalyst degradation under idle conditions, the kinetics of the ORR decreases, resulting in an increased LFR. The LFR decrease during the first 200 h of degradation might be due to the
inadequate activation of the cells with thicker membranes during the conditioning process.
4. Conclusions
Using a four-cell stack with Nafion membranes of different thicknesses, an accelerated stress test under idle conditions was carried out. The results show that the open circuit voltage (OCV) of the individual cells decreases with decreasing the membrane thickness, and it decreases much faster for thinner membranes, especially after 800 h of operation. Before degradation, the thin-ner the membrane, the better the cell performs. However, with the progress of degradation, the cells with thinner membranes degrade much faster with an average degradation rate of approximately 0.18 mV h−1for NR212 and 0.26 mV h−1for NR211, especially after
800 h, while cells with thicker membranes retain a slight degrada-tion rate throughout the test with an average degradadegrada-tion rate of approximately 0.09 mV h−1. The results indicate that it is the
mem-brane degradation that accounts for the major source of the entire cell performance degradation under idle conditions. The main rea-son for the drastic performance decay that occurred after 800 h for thinner membranes is the dramatic increase in hydrogen crossover, while the moderate degradation for the first 800 h may result from the dominance of different degradation mechanisms, e.g., catalyst decay. Further post-analyses of the degraded MEA samples are cur-rently being conducted to better understand the failure modes of this degradation.
Acknowledgements
The authors acknowledge the NRC-Helmholtz Joint Research program, NRC-MOST Joint Research Program, and NRC-IFCI’s inter-nal program for financial support.
References
[1] A. Kusoglu, A.M. Karlsson, M.H. Santare, S. Cleghorn, W.B. Johnson, J. Power Sources 161 (2006) 987–996.
[2] D. Liu, S. Case, J. Power Sources 162 (2006) 521–531. [3] Y. Takagia, Y. Takakuwa, ECS Trans. 3 (2006) 855–860.
[4] J. Yu, T. Matsuura, Y. Yoshikawa, M.N. Islam, M. Hori, Phys. Chem. Chem. Phys. 7 (2005) 373–378.
[5] E. Endoh, S. Terazono, H. Widjaja, Y. Takimoto, Electrochem. Solid-State Lett. 7 (2004) A209–A211.
[6] X. Huang, R. Solasi, Y. Zou, M. Feshler, K. Reifsnider, D. Condit, S. Burlatsky, T. Madden, J. Polym. Sci. 16 (2006) 2346–2357.
[7] R.C. McDonald, C.K. Mittelsteadt, E.L. Thompson, Fuel Cells 4 (2004) 208– 213.
[8] T.R. Ralph, S. Hudson, D.P. Wilkinson, ECS Trans. 1 (2006) 67–84.
[9] A. Taniguchi, T. Akita, K. Yasuda, Y. Miyazaki, J. Power Sources 130 (2004) 42–49.
[10] S.J.C. Cleghorn, D.K. Mayfield, D.A. Moore, J.C. Moore, G. Rusch, T.W. Sherman, N.T. Sisofo, U. Beuscher, J. Power Sources 158 (2006) 446–454.
[11] H. Xu, R. Borup, E. Brosha, F. Garzon, B. Pivovar, ECS Trans. 6 (2007) 51–62. [12] T.A. Aarhaug, A.M. Svensson, ECS Trans. 3 (2006) 775–780.
[13] S. Kundu, M. Fowler, L. Simon, R. Abouatallah, J. Power Sources 182 (2008) 254–258.
[14] A. Ohma, S. Suga, S. Yamamoto, K. Shinohara, J. Electrochem. Soc. 154 (2007) B757–B760.
[15] S. Zhang, X.Z. Yuan, J.N.C. Hin, H. Wang, J. Wu, K.A. Friedrich, M. Schulze, J. Power Sources 195 (2010) 1142–1148.
[16] A. Collier, H. Wang, X. Yuan, J. Zhang, D.P. Wilkinson, Int. J. Hydrogen Energy 31 (2006) 1838–1854.
[17] S. Sugawara, T. Maruyama, Y. Nagahara, S.S. Kocha, K. Shinohra, K. Tsujita, S. Mitsushima, K. Ota, J. Power Sources 187 (2009) 324–331.
[18] M.F. Mathias, R. Makharia, H.A. Gasteiger, J.J. Conley, T.J. Fuller, G.J. Gittleman, S.S. Kocha, D.P. Miller, C.K. Mittelsteadt, T. Xie, S.G. Yan, P.T. Yu, Electrochem. Soc. Interface 14 (2005) 24–35.
[19] A.B. LaConti, M. Hamdan, R.C. McDonald, in: W. Vielstich, H.A. Gasteiger, A. Lamm (Eds.), Handbook of Fuel Cells: Fundamentals, Technology and Applica-tions, vol. 3, John Wiley & Sons, Ltd., 2003, pp. 647–662.
[20] Y. Chikashige, Y. Chikyu, K. Miyatake, M. Watanabe, Macromolecules 38 (2005) 7121–7126.
[21] P. Genova-Dimitrova, B. Baradie, D. Foscallo, C. Poinsignon, J.Y. Sanchez, J. Membr. Sci. 185 (2001) 59–71.
[22] V.O. Mittal, H.R. Kunz, J.M. Fenton, Effect of catalyst properties on membrane degradation rate and the underlying degradation mechanism in PEMFCs, J. Electrochem. Soc. 153 (2006) A1755–1759.
[23] D. Liu, S. Case, Durability study of proton exchange membrane fuel cells under dynamic testing conditions with cyclic current profile, J. Power Sources 162 (2006) 521–531.
[24] Q.G. Yan, H. Toghiani, Y.-W. Lee, K.W. Liang, H. Causey, Effect of sub-freezing temperatures on a PEM fuel cell performance, startup and fuel cell components, J. Power Sources 160 (2006) 1242–1250.
[25] R.C. McDonald, C.K. Mittelsteadt, E.L. Thompson, Effects of deep temperature cycling on Nafion 112 membranes and membrane electrode assemblies, Fuel Cells 4 (2004) 208–213.
[26] J. Wu, X.Z. Yuan, J. Martin, H. Wang, D. Yang, J. Qiao, J. Ma, In-situ diagnosis of proton exchange membrane fuel cell degradation under close to OC condition, J. Power Sources 195 (2010) 1171–1176.
[27] A.S. Aricò, A. Stassi, E. Modica, R. Ornelas, I. Gatto, E. Passalacqua, V. Antonucci, Evaluation of high temperature degradation of Pt/C Catalysts in PEM fuel cells, ECS Trans. 3 (2006) 765–774.
[28] J. Xie, D.L. Wood III, K.L. More, P. Atanassov, R.L. Borup, Microstructural changes of membrane electrode assemblies during PEFC durability test-ing at high humidity conditions, J. Electrochem. Soc. 152 (2005) A1011– A1020.
[29] J. Wu, X.Z. Yuan, J.J. Martin, H. Wang, J. Zhang, J. Shen, S. Wu, W. Merida, A review of PEM fuel cell durability: degradation mechanisms and mitigation strategies, J. Power Sources 108 (2008) 104–119.
[30] F.D. Coms, The chemistry of fuel cell membrane chemical degradation, ECS Trans. 16 (2008) 235–255.
[31] M.K. Kadirov, A. Bosniakovic, S. Schlick, Membrane-derived fluorinated rad-icals detected by electron spin resonance in UV-irradiated Nafion and Dow ionomers: effect of counterions and H2O2, J. Phys. Chem. B 109 (2005)
7664–7670.
[32] M. Danilczuk, F.D. Coms, S. Schlick, Visualizing chemical reactions and crossover processes in a fuel cell inserted in the ESR resonator: detection by spin trapping oxygen radicals, Nafion-derived fragments, and hydrogen and deuterium adducts, J. Phys. Chem. B 113 (2009) 8031–8042.
[33] J. Zhang, Y. Tang, C. Song, J. Zhang, H. Wang, PEM fuel cell open circuit voltage (OCV) in the temperature range of 23◦C to 120◦C, J. Power Sources 163 (2006)
532–537.
[34] S.A. Vilekar, R. Datta, The effect of hydrogen crossover on open-circuit volt-age in polymer electrolyte membrane fuel cells, J. Power Sources 195 (2010) 2241–2247.
[35] X.Z. Yuan, J.C. Sun, M. Blanco, H. Wang, J. Zhang, D.P. Wilkinson, AC impedance diagnosis of a 500 W PEM fuel cell stack. Part I. Stack impedance, J. Power Sources 161 (2006) 920–928.