Biomass Energy: A Real Estate Investment Perspective
by
Chester Ren Jie Foo
Bachelor of Engineering (First Class Honours), Mechanical Engineering, 2010 National University of Singapore
Submitted to the Program in Real Estate Development in Conjunction with the Center for Real Estate in Partial Fulfillment of the Requirements for the Degree of Master of Science in Real
Estate Development at the
Massachusetts Institute of Technology September, 2014
©2014 Chester Ren Jie Foo All rights reserved
The author hereby grants to MIT permission to reproduce and to distribute publicly paper and electronic copies of this thesis document in whole or in part in any medium now known or hereafter created.
Signature of Author_____________________________________________________________ Center for Real Estate
July 30, 2014
Certified by____________________________________________________________________ Albert Saiz
Associate Professor of Urban Economics and Real Estate, Department of Urban Studies and Planning
Thesis Supervisor
Accepted by___________________________________________________________________ Albert Saiz
Chair, MSRED Committee, Interdepartmental Degree Program in Real Estate Development
2
Biomass Energy: A Real Estate Investment Perspective
Chester Ren Jie Foo
Submitted to the Program in Real Estate Development in Conjunction with the Center for Real Estate on July 30, 2014 in Partial Fulfillment of the Requirements for the Degree of Master of
Science in Real Estate Development
ABSTRACT
A central consideration in real estate is how value is created in real estate development and investment deals. A biomass power plant is not only an asset which generates revenues, but from a real estate perspective, it also creates additional value to the owners’ existing farmlands. Biomass energy assets are similar to traditional real estate and infrastructure in a lot of ways. On the other hand, biomass energy assets are characterized by the feedstock fuel and multiple revenue generators such as sale of power, carbon credits and biomass ash. Furthermore, favorable regulatory policies make biomass energy assets more distinct and attractive.
The current biomass investment market is a relatively young and evolving market. Southeast Asia has a huge potential for biomass investment. The market players are mostly dominated by investors and firms with specialized technical knowledge about renewable energy and/or traditional power production, and private equity and venture capital firms are not very active in this market. The lack of technical insight and information transparency are stopping these financial institutions from entering the market.
Therefore the Biomass Valuation Model (BVM), developed in Excel®, allow the critical technical and financial components to communicate effectively, which would help to determine the viability of the biomass investment projects with greater certainty. The BVM would be able to generate financial outputs from the perspectives of real estate development, financial and economic conditions, and the biomass power generation technical process. This valuation model (BVM) would be helpful to investors, considering the amount of time and effort required in overcoming the technical barrier, hence providing investors the “first-mover” advantage in tapping into the biomass investment market.
Thesis Supervisor: Albert Saiz
3
Acknowledgement
I would like to express my sincere gratitude and appreciation towards my thesis advisor, Associate Professor Albert Saiz for his invaluable advice and assistance in my research for this thesis.
Prof. Saiz has given me a lot of guidance and insightful comments during regular meetings which often help me progress in my research. I would like to recognize his guidance, encouragement and friendship, which allow me to grow and to discover new challenges. Moreover, I take this opportunity to acknowledge Prof. Saiz’s supervisory skills, especially the way he motivates students who are engaged in research for their thesis. I would like to express my appreciation for his continuous support during the long period that I took to collect, compile and analyze the extensive documentation and developing the methodologies for this project. Those careful guidance and insightful comments have reduced the defects of this thesis to the minimum. From him, I received expert suggestions and unfailing patience, which makes this thesis possible. Without him, this thesis would not have been successfully completed.
I would like to thank Prof. David Geltner, Prof. Bill Wheaton and Mr. John Kennedy from MIT Center for Real Estate and Prof. Christopher Noe and Prof. Jean-Noël Barrot from MIT Sloan for sharing with me their professional knowledge and expertise in real estate and finance through their courses at MIT, which provides a strong foundation for this project to be built on. In addition, I would like to express my appreciation to Mr. George Ochs (J.P. Morgan) and Mr. Sam Davis (MIT CRE). I have benefited a lot from their vast professional experience. I thank them for their encouragement and recognition.
I would also like to express my sincere gratitude to Ms. Rocelyn Dee (MIT SM’02). She is a great mentor and I benefited greatly both professionally and in my personal life throughout my time at MIT. I really appreciate her help and generosity, and our friendship.
Lastly but not least, I would like to thank my wife, Roo for her love and encouragement, and our families for their support.
4
Table of Contents
List of Figures...6 List of Tables ...7 Chapter 1 Introduction ...8 1.1 Motivation ...8 1.2 Research Scope ...9Chapter 2 Infrastructure and Real Estate: Real Assets ...11
2.1 Introduction to Real Assets ...11
2.2 Real Estate: A Brief Introduction ...12
2.3 Real Estate: Characteristics ...12
2.4 Infrastructure: A Brief Introduction ...15
2.5 Infrastructure: Characteristics ...16
2.6 Moving Forward: Biomass Energy ...18
Chapter 3 Analysis of the Market Potential ...19
3.1 Global Infrastructure Market ...19
3.2 Renewable Energy Market ...20
3.3 Biomass Energy Market ...24
3.4 Southeast Asia Region (ASEAN) ...26
3.5 Biomass Investment Market: Thailand ...27
Chapter 4 Biomass Energy Investments ...31
4.1 Introduction ...31
4.2 Biomass: Characteristics ...31
4.3 Biomass Power Generation Using Combustion Technology ...33
4.4 Biomass Power Plant Development Considerations ...34
4.4 Investing in Biomass Power Plant Projects ...38
4.5 Biomass Investment Decision Process ...44
Chapter 5 Biomass Valuation Model (BVM) ...47
5.1 Introduction ...47
5.2 Methodology ...47
5.3 Development of Biomass Valuation Model...49
5.3.1 Technical Considerations for Biomass Power Plant ...49
5.3.2 Financial Considerations for Biomass Power Plant ...51
5.3.3 Constructing the BVM...58
5.4 Analyses, Results and Discussions ...61
5.5 Why the Use of BVM? ...73
5.5 Limitations of BVM...73
5
Chapter 6 Conclusion ...74
Bibliography ...75
Appendix 1: Real Estate vs. Stocks ...77
Appendix 2: Energy Crops ...78
Appendix 3: Licensing and Permitting for Biomass Power Plant Projects ...79
Appendix 4: Operating Parameters ...81
Appendix 5: Traveling grate ...82
Appendix 6: Steam Turbine ...83
Appendix 7: Cost of Connecting to the Grid, ...84
Appendix 8: Cost of Investing in Cyclone ...85
Appendix 9: Biomass Plant Configuration ...86
Appendix 10: Steam Condition at Various Stages, ...87
Appendix 11: Flue Gas Condition at Various Stages ...87
Appendix 12: Feedstock List ...88
Appendix 13: Investment of Equipment ...89
Appendix 14: Investment of Equipment ...90
Appendix 15: Details of Loan ...91
Appendix 16: Wholesale Electricity Tariff Growth Rates ...93
Appendix 17A: Cash Flow Model (No leverage Model) ...94
Appendix 17B: Cash Flow Model (Leverage Model, Equity 40%, Debt 60%) ...97
Appendix 18A: Levered Cash Flow Distribution (Debt 60%, Equity 40%) ... 100
Appendix 18B: Unlevered Cash Flow Distribution vs. Levered Cash Flow Distribution (Debt 60%, Equity 40%) ... 101
Appendix 19: IRRs of Cash Flow with Leverage (Debt 60%, Equity 40%) ... 102
Appendix 20: Variation of IRR with Depreciation Rate (Years of depreciation) ... 103
6
List of Figures
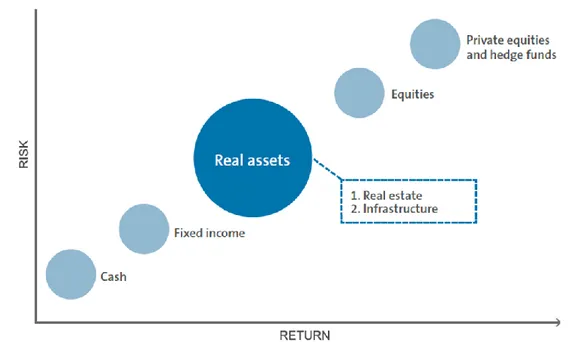
Figure 1: Risk-Return Ranking of Real Assets ...11
Figure 2: Infrastructure Sector Breakdown ...16
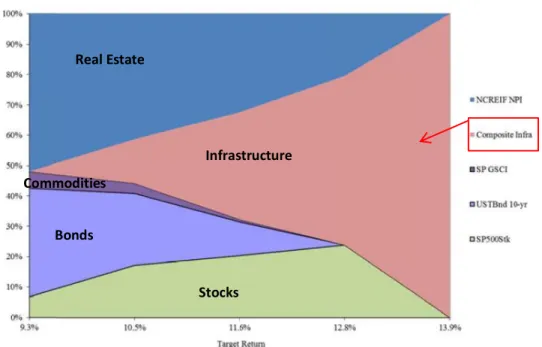
Figure 3: Asset Composition of Efficient Frontier ...17
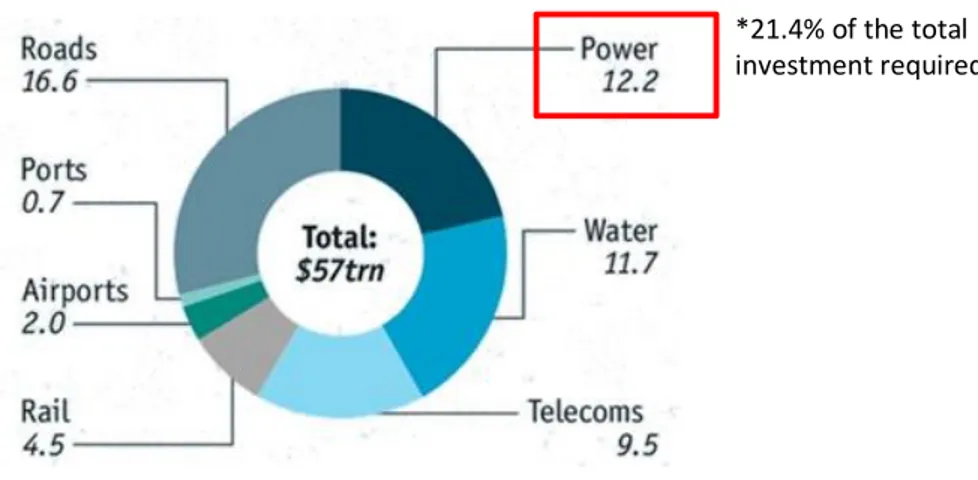
Figure 4: Global Infrastructure Investments Required for 2013-2030, $ trillion ...19
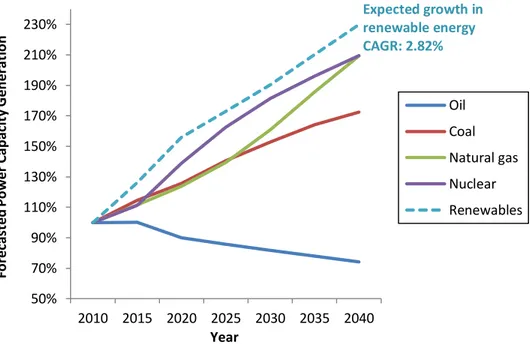
Figure 5: Forecasted Generation of Various Energy Types Benchmarked to 2010 Levels ...21
Figure 6: Estimated Share of Global Energy Consumption, 2012...25
Figure 7: Breakdown of Global Electricity Production, 2013 ...25
Figure 8: Biomass Feedstock Availability in ASEAN ...26
Figure 9: Level of Support for Biomass Investment in ASEAN ...27
Figure 10: Characteristics of Biomass Energy Asset ...32
Figure 11: Biomass Power Generation Process ...34
Figure 12: Risk-Return for Greenfield Biomass Projects ...39
Figure 13: Conceptual Representation of a Biomass Power Plant Project Structure ...40
Figure 14: Project Financing Model ...41
Figure 15: On-Balance-Sheet Financing Model ...43
Figure 16: Biomass Power Plant Project Development Overview ...45
Figure 17: Biomass Investment Decision Process ...46
Figure 18: Approach in Developing the BVM ...48
Figure 19: Biomass Power Production Model ...51
Figure 20: Biomass Financial Model...57
Figure 21: Biomass Valuation Model (BVM) Process ...59
Figure 22: Cost and Revenue of the Biomass Power Plant ...60
Figure 23: Key Parameters for Analysis ...61
Figure 24: Cash Flow Distributions (Unlevered and levered) ...62
Figure 25: Effect of Levered Cash Flow ...63
Figure 26: NPV of Revenue and Cost ...64
Figure 27: IRR of Unlevered Cash Flow ...64
Figure 28: Parametric Analysis of Select Parameters ...66
Figure 29: Variation of IRR with Price of Carbon Credits ...67
Figure 30: Variation of IRR with Depreciation Rate (No Leverage) ...68
Figure 31: IRR Variation to Feedstock Price Growth Rate (Year 1-25) ...69
Figure 32: IRR Variation to Feedstock Price Growth Rate (Year 1-10 only, thereafter stabilizes at 2.5%) ...70
Figure 33: IRR Variation to Biomass Ash Price Growth Rate (Year 1-25) ...70
Figure 34: IRR Variation to Biomass Ash Price Growth Rate (Year 1-10 only, thereafter stabilizes at 2.5%) ...71
7
List of Tables
Table 1: Declines in Inflation-Adjusted Returns for “Big Bear” event from 1970 – 2011...14
Table 2: Characteristics of Direct and Indirect Investment ...15
Table 3: Similarities and Differences between Infrastructure and Real Estate ...18
Table 4: Drivers of the Renewable Energy Market ...22
Table 5: Potential of Biomass from Rice ...28
Table 6: Thailand's Adder Scheme for Biomass Energy ...29
Table 7: Power Generation Capacity Assumptions...51
Table 8: Power Generated Results ...52
Table 9: Investment Costs of Equipment Based a Project 9.8 MW Capacity ...53
Table 10: Investment Costs of Preliminary and Construction Phase ...54
Table 11: Power Plant Operating Parameters ...55
Table 12: Cost of Feedstock Parameters ...55
Table 13: Revenue Generators Parameters ...55
Table 14: Further Details on Revenue from Biomass Ash ...56
Table 15: Capital Structure Parameters ...56
Table 16: NPV Assumptions ...57
Table 17: Ranking of Parameters ...66
Table 18: IRR for 20 years Straight Line Depreciation ...67
Table 19: IRR for 5 years Straight Line Depreciation ...68
Table 20: The Optimal Depreciation Rate ...68
Table 21: Default IRRs ...72
Table 22: Without Subsidy of Electricity Sale (i.e. no adder) ...72
Table 23: Without Adder and Tax Incentives ...72
8
Chapter 1 Introduction
1.1
Motivation
Infrastructure asset, an emerging asset class presents investment opportunities in both developed (US and Europe – Replacement of existing infrastructures) and developing (Asia and Africa – New-Built infrastructures) nations. As investors begin to search out and invest strategically in alternative assets that can deliver returns which bonds and equities could not, real asset class is gaining acceptance as an essential asset in portfolio construction alongside equities and fixed income (Azelby & Hudgins 2007).
Infrastructure is the foundation of any growing economy. Infrastructure assets provide essential services to society, such as the movement and storage of goods, people, data or resources. In many instances, these assets operate on a monopolistic basis. Experts estimate that Asia’s economies will require about $750 billion per year to be spent on infrastructure (Bhattacharyay 2010; Tahilyani, Tamhane & Tan 2011). Therefore, the importance of investment in infrastructure is evident. In addition, the trend in which governments have given up their monopoly or investments in infrastructure projects has made infrastructure an investable asset for investors. To capitalize on the huge need for infrastructure in the region, the investment focus is on investing primarily in growth opportunities and providing expansion capital.
An important component of infrastructure is energy, which is a key item on everyone’s agenda. The dependence on fossil fuel as well as its cost would influence both the stability and growth of any economies. Political turmoil in the Middle East and between Russia and Ukraine has sent across a very strong message on the importance of reducing the energy dependence on other countries.
To reduce the reliance on countries for energy, renewable energy has become an important component for diversification of the overall energy needs, and it is now a mandate in any country’s energy portfolio. Key factors for driving the adoption of renewable energy includes national and international policies, energy prices, technologies available and capital market. There are several forms of renewable energy such as solar, wind, biomass power and they share a common characteristic which is they would need certain a medium – operating assets such as solar panels, windmills and power plant to generate electricity. Therefore investments in these assets are expected. The scope of this thesis focuses on the real estate that produces the renewable energy.
9
In a typical real estate, an important consideration is its rental value where the rent forms the bulk of the property’s income. For a biomass power plant, the rental value instead consists of electricity and heat sales, carbon credits and sales of fertilizers. Another important consideration is the costs. They are typical real estate costs like development, financing and operation & maintenance costs and depreciation. Pro renewable energy legislations are also an important factor toward a good investment in biomass power plant.
Investments in renewable energy power generation are broadly gathering interest and could ultimately form part of an investor’s asset allocation. Biomass in particular can be of interest to real estate investors due to its small size i.e. relative lower investment cost and private ownership i.e. more control over asset. However, one limiting factor on investment in biomass energy is that investors have limited experience and lack of technical expertise, due to fact that the biomass energy market is still developing but fast growing. Hence, the key focus of this thesis is to introduce a mechanism to analyze biomass energy investments that could provide in-depth insight and analysis towards investment decisions.
1.2
Research Scope
The renewable energy market very broad and operates differently in different regions. The scope of this thesis would focus on a targeted geographical region i.e. Southeast Asia (also known as ASEAN1) in order to achieve a thorough and in-depth analysis. Thereafter, this
research will focus on biomass power plants and how real estate investors should approach the fast-growing market of biomass power plants in Southeast Asia and how these assets could be a real estate as an investment opportunity and be added as part of the investors’ portfolios. ASEAN has rich resources of biomass fuel and provide a vast potential for biomass energy investors. A review of these markets can be used as a guide for other biomass investment projects. The thesis will attempt to address the central question: “How to make a determination of good biomass investments”.
The thesis structure would be as follows. Chapter 2 will explore the definitions and uses of real estate and infrastructure as investments, and how biomass energy investment can be included in investors’ portfolios. In Chapter 3, the thesis will address the renewable energy market broadly and focusing on the ASEAN region and biomass energy market with an aim to better understand the market dynamics and opportunities.
1 The Association of Southeast Asian Nations (ASEAN) is a political and economic organisation of ten countries
located in Southeast Asia, which was formed on 8 August 1967. The 10 members include Brunei Darussalam, Cambodia, Indonesia, Laos, Malaysia, Myanmar, Philippines, Singapore, Thailand, and Vietnam.
10
In Chapter 4, the thesis would delve in to review biomass energy asset characteristics, understand biomass energy assets in-depth, and develop the Biomass Investment Decision Process provide some guidelines of the process of biomass investment for investors who are interested in entering the biomass investment market. The thesis would then develop a Biomass Valuation Model (BVM) to analyze the project feasibility in Chapter 5. The BVM would help to analyze the assets’ performance over its life cycle vis-à-vis its operating parameters i.e. the technical and financial aspects. The technical aspect is often ignored by financial institution investors. Coupled with the lack of technical expertise, financial institution investors are not well equipped to enter the biomass investment market readily. The thesis would focus on ASEAN – Thailand, an early mover in biomass investment.
11
Chapter 2 Infrastructure and Real Estate: Real Assets
2.1
Introduction to Real Assets
Real asset is an asset class that is gradually gaining acceptance as an important component of the investors’ portfolio. It is the third asset class alongside with traditional asset like equities and fixed income (Azelby & Hudgins 2007). Real assets consist of physical asset investments in real estate, infrastructure, timberland, farmland, etc. that provide investors the ability to perform while operating in market uncertainties. These assets could provide a stable source of income in weak markets and capital appreciation in strong markets.
Real assets’ typical performance bridges the gap between fixed income and equity (see Figure 1). First, they generate yields that are competitive with other fixed income alternatives. Their stable bond-like payment structure can serve as a reliable base for stable mid- to long-term total returns by contributing to price appreciation in up markets and offsetting losses when values decline. Second, as a higher yielding, non-bond complement to fixed income, real assets also offer the potential for equity-like upside and the ability to respond positively to healthy, growth-induced inflation. While bonds pay out a regular fixed coupon until they reach maturity, real asset payouts can grow in line with cash flow growth. Real asset investments also provide better geographic diversification with its localized operating environment, and, perhaps most importantly, in most cases, with competitive returns.
Figure 1: Risk-Return Ranking of Real Assets
12
This chapter will explore the definitions and uses of real asset as an investment. Within the real asset group, the real estate sector has become a substantial part of asset allocation for investors. Subsequently, the market for real estate investments has become more transparent and efficient with the introduction of REITs2, listed funds and indices. Real assets have become
more diversified beyond real estate, and investment portfolios are gradually moving towards including infrastructure asset, a different asset class from real estate (Finkenzeller, Dechant & Schäfers 2010).
2.2
Real Estate: A Brief Introduction
Real Estate is defined as “Land plus anything permanently fixed to it, including buildings, sheds and other items attached to the structure.” 3 In addition, real estate is directly affected by the
condition of the environment where the property operated in i.e. “location, location, location”. Delving deeper into real estate, it is an essential component of the global economy. It is an asset class that comprises commercial, residential, retail, industrial, etc. It is one of the four major traditional asset classes for investment portfolio planning, which includes, (1) Cash (T-Bills), (2) Stocks, (3) Bonds and (4) Real Estate. Each of this asset class possess a unique combination of the five dimensions of investment performance (Geltner et al. 2013) which includes, (1) Risk, (2) Return on Investment, (3) Current Yield, (4) Growth and (5) Inflation Protection.
2.3
Real Estate: Characteristics
Real estate is asset class is a hybrid of income and capital growth. Real estate has a component similar to a coupon bond, which pays a regular, stable income stream, and it also has a component similar to a stock, which its property value tends to fluctuate when influenced by its operating environment. Some of the other characteristics (Geltner et al. 2013) that make real estate unique are as follows:
Tangible Asset – Real estate asset are physical assets, hence this corresponded to the importance of location.
Information Inefficiency – Real estate deals are usually executed in the private market. Hence information is not efficiently disseminated among market participants. This increases the difficulty in determining the value of assets in comparison to stocks and bonds. On the other hand, this also creates information asymmetry among market
2 Real Estate Investment Trust
13
participants, which allows investors with access to this special information, expertise or resources to achieve greater returns.
Illiquidity – The sellers and buyers would have to source for their deals, usually through brokers. There is usually a significant time lag4between the decision of a property’s sale
and when the transaction is completed. An exception would be listed real estate securities that are traded on public exchange.
Management of Property – Because real estate is tangible, it needs to be managed in a hands-on manner. Tenant complaints must be addressed. Landscaping must be handled. And, when the building starts to age, it needs to be renovated.
High Transaction Costs – Real estate transaction in the private market has high costs. There are broker’s commissions, legal fees, design fees and many other costs that would raise the investment cost above the purchase price. The high transaction costs resulted in investors taking a long term horizon when accessing the risk and return of the property
No fixed maturity – Compared to a bond investment which has a fixed maturity date, real estate investment does not normally mature. Therefore real estate investors have a rather long term horizon on the risk and return of the property. An exception would be real estate debt investment which has a fixed-term.
Why do investors invest in real estate? Firstly, from a portfolio theory perspective, real estate provides diversification benefits as it possess a unique risk-return combination and low correlation with the traditional asset classes5, which help to push the efficient frontier inwards
resulting in lower risk for a given return i.e. yield enhancement. Geltner has observed that, by looking at the four asset classes’ cumulative total returns net of inflation for their past 41 years history from December 1969 to December 2011 (see Table 1 and Appendix 1), (a) the magnitude of the real estate average “big bear6”was 2/3 of change in magnitude of stocks, (b)
the change in the magnitude of real estate is more regular i.e. predictable and, (c) the frequency of real estate is lower which half of the frequency of stocks (Geltner 2014).
4 The process could take up to a few months.
5 The 4 main asset classes are Cash, Stocks, Bonds and Real Estate. 6 Denote by a decline of more than 20% of the asset’s value.
14
Table 1: Declines in Inflation-Adjusted Returns for “Big Bear” event from 1970 – 2011 Stocks Real Estate Remarks
Average Drop -38.1% -25.7% 2/3 of stocks
Standard Deviation of the Drop 14.4% 9.3% More regular than stocks
Range of the years between the Drops 3 to 7 12 to 15 1/2 of stocks
(Source: Dr. Geltner, RE & "Fat Tails" Risk, 15.427: Real Estate Capital Markets, MIT, Spring 2014)
Secondly, real estate is able to hedge inflation better than bonds. The returns from real estate investments are directly linked to the rents received from the tenants. Some tenant lease agreements contain certain lease provisions that indexed the increase in rents to inflation, or sometime a step-up lease agreement is used, which stipulates the rent increment by predetermined amounts at various points in the future. In other cases, the rents are increased when a lease term expires and the tenant renewed the lease. The income from real estate would trend to increase faster in an inflationary environment. Therefore, this would allow investors to maintain the real returns.
Investors can invest in real estate via direct investments and indirect investments. Direct real estate investment refers to buying real estate directly with no active real estate market. The real estate owners have control over management decisions and are considered active investors. Indirect real estate investment refers to owning the investment through the public markets and securitized market. The investors are passive and do not have any direct day to day control over the operation of the properties. Therefore indirect real estate investing involves investing in the skills and expertise of other people, such as property or fund managers by investing in REITs, Unit Trusts, Property Funds, Limited Partnerships and Real Estate Operating Companies. The two types of investment channels are have their own set of characteristics (Geltner et al. 2013) as shown in Table 2 below:
15
Table 2: Characteristics of Direct and Indirect Investment
Direct Real Estate Investment Indirect Real Estate Investment
• Illiquidity • High liquidity
• Large amount capital required to invest • Low amount of capital required to invest • High transaction and management costs • Low management fees and transaction
costs • Control of the property, rental income
and capital gains generated
• No control over underlying property • Risk is concentrated by putting a very
large investment into an individual property
• Risk is diversified across regions and sectors.
• Low correlation with stocks and bonds which helps in portfolio diversification.
• Publicly traded shares tend to exhibit a higher correlation with stocks and bonds than direct real estate, which diminishes the diversification advantages of
investing in real estate. (Source: Author)
2.4
Infrastructure: A Brief Introduction
In this and the next section, the thesis will introduce the infrastructure asset class and review its characteristics. Conceptually, infrastructure relates to large scale public systems, services and facilities that are necessary for daily life and economic activity. It can be further broken down by the market types, risk-return spectrum, or most directly, the industry sectors. Most commonly, infrastructure is divided into four categories: energy, transportation, social, and telecommunications.
Firstly, energy includes oil and gas, coal nuclear and renewable energy (wind, solar, biomass etc.) power generation and power transmission systems. Secondly, transportation assets, includes toll roads, bridges, tunnels, railroads, rapid transit links, seaports, and airports. Thirdly, communications assets, includes radio and television broadcast towers, wireless communications towers, cable systems, and satellite networks. Lastly, social infrastructure assets, includes water system, healthcare facilities, and waste management (see Figure 2 for a graphical representation of the different categories).
16 Figure 2: Infrastructure Sector Breakdown
(Source: Author)
The trend in which governments have given up control in some infrastructure assets has made infrastructure an investable asset for investors. Broadly, infrastructure assets are usually large physical properties such as bridges, toll roads and rail, and they are very capital intensive to invest in. To understand the distinctions of infrastructure with real estate, its general characteristics will first be presented in the next section.
2.5
Infrastructure: Characteristics
Like real estate, infrastructure is not homogenous. It spans the risk-return spectrum from lower risk public-private-partnerships in developed countries to higher risk private equity-like assets. Infrastructure assets have a differentiated set of characteristics (Markard 2010) compared to other asset classes as follows,
Provision of essential services
Low volatility and inflation hedge – Infrastructure assets tend to have contracted revenue and/or predictable consumer demand, and hence cash flows are generally stable, which makes volatility low. In most cases, for example like power utility has inflation-linked contracts and pricing that protects investors from the effects of inflation on long-term cash flows.
Infrastructure
Energy
Oil and Gas Coal Nuclear Power Renewable Energy
Biomass Energy Power Plants
Transportation Telecommunication Social
17
High barrier to entry – Regulation and legislation as well as the capital intensive nature i.e. high upfront cost create significant barrier to entry for other investors.
Long term investment – Infrastructure is long duration asset, often with a life of 15 to 30+ years. Infrastructure contracts are in most cases long term. For example, Toll road concessions can last up to perpetuity and the capital intensiveness adds to a long term character of investments.
Low correlation with other assets – This provides diversification benefits for the investor’s portfolio.
Generally, infrastructure assets have defensive characteristics, such as high barriers to entry, relatively inelastic demand and stable cash flows that can support higher levels of debt service across economic cycles. However, the thesis would note that given that fact that infrastructure assets possess characteristics such as no flexibility for other uses, large capital investments, directly affected by changes in policies and regulations, it presents a possible significant level of risk, which corresponded to higher expected returns. Li’s research (see Figure 3) has shown that infrastructure assets are high risk-return assets.
Figure 3: Asset Composition of Efficient Frontier
(Source: Xiangyu Li, Beyond Real Estate: Examining Global Real Asset Allocation Frameworks for Institutional Investors, MIT Master Thesis, 2012)
Real Estate Infrastructure Stocks Bonds Commodities
18
The thesis will briefly discuss about the similarities and differences of infrastructure and real estate7. These characteristics have been tabulated in Table 3.
Table 3: Similarities and Differences between Infrastructure and Real Estate
Similarities with Real Estate Differences with Real Estate
• Illiquidity
• Cash yield is significant part of return • Absolute return objective focus • Importance of location
• Inflation hedge
• Long term investment horizon
• Barriers to entry
• Less exposure to economic cycles • Longer cash flow predictability, hence
higher gearing is possible
• Normally larger individual asset size • No flexibility for other uses
(Source: Author)
2.6
Moving Forward: Biomass Energy
The focus of this thesis would be on biomass energy power plants. Although the biomass energy asset class is grouped under infrastructure, it has its own set of unique characteristics that constitute a combination of infrastructure and real estate assets.
Referring to the definition of real estate8 in section 2.2, biomass power plants share the same
characteristics. A biomass power plant requires land and a permanent structure i.e. the plant for power generation. In addition, it is too, directly affected by the condition of the environment where it operated in i.e. availability of the biomass feedstock and the demand for its product – power. A central consideration in real estate is how value is created in real estate development and investment deals. A biomass power plant can add value to existing plots of land by converting a traditional cost e.g. agriculture waste into an additional revenue stream (The Biofore Company 2010; Biomass Thermal Energy Council n.d.).
Moving forward, we will look at the biomass industry in depth. The global infrastructure is a still a relatively immature9, and the biomass energy sector is especially the case. ASEAN would be a
potential market for biomass investment and the geographical focus of this thesis. The market analysis will be covered in chapter 3.
7 UBS Global Asset Management, 2014
8 “Land plus anything permanently fixed to it, including buildings, sheds and other items attached to the structure.” 9 CNBC News, Norway's $890 bln oil fund cuts bond stakes in long-term bet, Jun 26, 2014,
19
Chapter 3 Analysis of the Market Potential
3.1
Global Infrastructure Market
Infrastructure investments for the past 18 years from 1994 to 2012 totaled $36 trillion and it will cost $57 trillion (see Figure 4 for infrastructure investments required by type) to build and maintain the global infrastructure till 2030 to maintain the project economic growth10. Energy
(Power) investment attribute to near a quarter (21.4%) of the total investment required. Global spending on basic infrastructure such as transportation, power, water and communications currently stands at $2.7 trillion a year instead of the required $3.7 trillion a year11. This gap is
expected to widen.
Figure 4: Global Infrastructure Investments Required for 2013-2030, $ trillion
(Source: McKinsey Global Institute, 2013)
A significant proportion of the governments globally are unable to make up the entire shortfall in infrastructure investment, although notably, China can pay outright for the development projects that need to be built. Therefore to make up for this shortfall, private capital could have a larger role to play as public financing could only make up for part of the solution. Private capital could come from financial institutions such as banks, pension funds, sovereign-wealth funds, insurance companies and other institutional investors.
However in today’s context, as the Basel 3 capital rules12 make such lending less attractive, the
big global banks which used to provide loans to finance infrastructure projects are less willing
10 Mckinsey Infrastructure Practice, Mckinsey Global Institute, 2013 11 The Economist, The Trillion-Dollar Gap, March 2014
12 Basel III is primarily related to the risks of the bank by requiring differing levels of reserves for different forms of
bank deposits and other borrowings. (http://www.federalreserve.gov/bankinforeg/basel/USImplementation.htm#baseIII)
*21.4% of the total investment required
20
to do so. These banks have become very cautious and conservative about making long-term loans13and they are less willing to take lesser risk than it used to be. In the same way that the
development and construction of residential real estate slows when banks reduced the supply of cheap mortgages, infrastructure development will fall behind its required level when its financing gets tighter, for example there would be higher equity contribution requirement. Potential sources of capital could however be found in institutional investors such as pension funds, sovereign-wealth funds and insurance companies where they managed a total capital of $50 trillion globally. Infrastructure investment consists only 0.8%14 of their portfolio. A study on
U.S. institutions that consist of endowments & foundations, public pension, corporate pension and Taft-Hartley i.e. unions have suggested that the real estate allocations to their portfolio is about 10% (Geltner et al. 2013). Therefore, this thesis views that an allocation somewhere around the range of 10% of their portfolio in infrastructure would be ideal.
In Asia alone, experts estimate that the Asian’s economies will require about of $750 billion per year on investing in infrastructure (Bhattacharyay 2010; Tahilyani et al. 2011). Trends where investors are beginning to gravitate to infrastructure assets are observed. The assets include infrastructure, transport and natural resources, where these assets to provide higher income than bonds and superior risk adjusted returns to equities (Azelby & Hudgins 2007).
3.2
Renewable Energy Market
The renewable energy sector is a growing subset of the infrastructure asset class. In today’s environment of persistent high oil prices and the growing concerns over energy security which is closely linked to a nation’s political and economic stability, most governments have directed policies to encourage the investment and adoption of renewable energy. In addition, increased concerns of the climate change and global warming, coupled with the recurrence of oil price increases, renewable energy has thus further strengthening its position as a meaningful provider of global energy supply.
Hence, this has attracted investors’ interest in the recent years. There is an increasing number of private investors i.e. private equity15 and venture capital16 investment companies focusing on
13 A typical infrastructure loan term can be about 25 years. 14 The Economist, A long and winding road, March 2014
15 Live Mint, PE firms’ interest in renewable energy sector remains high, May 13, 2014
(http://www.livemint.com/Industry/zE0tkCGsJCQX8Vggf3Q8aL/PE-firms-interest-in-renewable-energy-sector-remains-high.html?utm_source=copy)
16 RenwableEnergyWorld.com, VC Funding in Renewable Energy: Tracking the New Normal, Apr 16, 2013 (http://www.renewableenergyworld.com/rea/news/article/2013/04/vc-funding-in-renewable-energy-tracking-the-new-normal)
21
the renewable energy sector, and a growing base of institutional investors17 have set aside
allocations in such companies as part of their alternative asset strategies.
Renewable energy18 currently represents about 22% of global electricity generating capacity,
producing more than 4 trillion Kilowatt-hour (kWh) per annum globally19. The renewable
energy industry’s existing capacity currently stands more than 1500 gigawatts (GW) and about 100 GW would be added annually. This translates to more than $200 billion of investment annually (REN21 2013). As a result, industry projections indicate that renewable energy will be the fastest growing source of electricity generation over the next 30 years20 (see Figure 5).
Figure 5: Forecasted Generation of Various Energy Types Benchmarked to 2010 Levels
(Source: Author; Data from U.S. Energy Information Administration International Energy Outlook 2013)
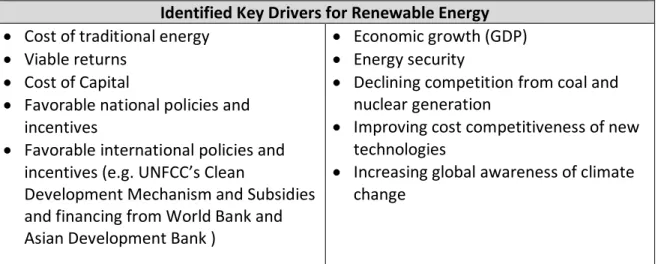
The noteworthy forecasted growth for the renewable energy is expected to be driven by the key drivers ensuring the sustainability of the global economy and environment. The several key market drivers and trends (Gan & Smith 2011) leading to the increasing demand for renewable energy are identified as follows (see Table 4):
17 United Nations Environment Program, Renewable Energy Market Share Climbs Despite 2013 Dip in Investments,
Apr 7, 2014 (http://www.unep.org/NEWSCENTRE/Default.aspx?DocumentID=2787&ArticleID=10824&l=en) 18 Includes mainly biomass, biofuel, hydropower, solar, wind and geothermal
19 U.S. Energy Information Administration, International Energy Outlook 2013 20 U.S. Energy Information Administration, International Energy Outlook 2013
50% 70% 90% 110% 130% 150% 170% 190% 210% 230% 2010 2015 2020 2025 2030 2035 2040 Fo rec as te d P o w e r C ap ac it y G en e ra ti o n Year Oil Coal Natural gas Nuclear Renewables Expected growth in renewable energy CAGR: 2.82%
22 Table 4: Drivers of the Renewable Energy Market
Identified Key Drivers for Renewable Energy
Cost of traditional energy Viable returns
Cost of Capital
Favorable national policies and incentives
Favorable international policies and incentives (e.g. UNFCC’s Clean
Development Mechanism and Subsidies and financing from World Bank and Asian Development Bank )
Economic growth (GDP)
Energy security
Declining competition from coal and nuclear generation
Improving cost competitiveness of new technologies
Increasing global awareness of climate change
(Source: Author)
The thesis would explain select key drivers below:
Increasing global awareness of climate change – In recent years, increasing concern over global warming has become a significant catalyst for environmental policy action around the world, including new legislation mandating renewable energy investment targets and implementation of feed-in-tariffs that offer cost-based compensation or other cases, including an adder21 to renewable energy producers.
Declining competition from coal and nuclear generation – Following the recent Fukushima nuclear disaster in Japan, public concern over the safety of nuclear power generation has caused other nations to legislate the early retirement of existing nuclear capacity, as well as to delayed or halted new nuclear power plant development activities. Additionally, coal plants are also facing increasing political pressures to comply with environmental compliance and this resulted in the increasing retirement of coal generation facilities.
Favorable national policies and incentives – at least 67 countries, including all 27 European Union (EU) member nations have national targets for renewable energy supply. ASEAN, China, the EU, U.S., have made a target of 20% renewable energy by 2020. In addition, incentives to encourage renewable energy could include, tax rebate, subsidy, subsided financing, long term contracts to secure future cash flow, easy of doing business, etc.
23
Improving cost competitiveness of new technologies – Technological innovation over the last decade continues to reduce the cost of investing and operating renewable energy generation technologies such as wind, solar and bio-energy. The development in technology helps to enhance the competitiveness of renewable resources. The increasing cost competitiveness would provide an attractive means to meet increasingly stringent environmental standards.
UNFCC’s Clean Development Mechanism – There is a possibility of obtaining the carbon credits through the United Nations Framework Convention on Climate Change (UNFCC) through the Clean Development Mechanism (CDM).
The Kyoto Protocol to the United Nations Framework Convention on Climate Change (UNFCCC) entered into force on February 16, 2005. Under the Protocol, countries have committed in greenhouse gas (GHG) emission reduction to moderate global warming by pledging certain quotas for GHG emission22. The first commitment started in 2008 and
end in 2012. The second commitment started in 2013 and will end in 2020. The developed parties to the Protocol may use the flexibility mechanisms (the Kyoto Mechanisms) through international cooperation, including the Clean Development Mechanism (CDM) and the Joint Implementation (JI), to achieve their targets of GHG emission reductions23.
The CDM allows emission-reduction projects in developing countries to earn certified emission reduction (CER) credits, each equivalent to one ton of CO2. The Certified Emission Reductions (CERs) are climate credits or better known as carbon credits which are issued by the Clean Development Mechanism (CDM) Executive Board. These CERs or also known as “carbon credits” can be traded and sold, and used by industrialized countries to a meet part of their emission reduction targets under the Kyoto Protocol24.
CERs are widely used carbon trading instruments worldwide and are traded between developed and emerging countries. The price of CERs, which had been traded for as much as $20 a ton25 before the global financial crisis in 2008-2009 to less than $1 a ton
currently. The market for trading CERs currently stands at 703 million ton, a market
22 For the list of countries and their pledges for the reduction of greenhouse gas emissions please see: http://unfccc.int/kyoto_protocol/doha_amendment/items/7362.php
23 United Nations Framework Convention on Climate Change, Kyoto Protocol
24 United Nations Framework Convention on Climate Change, Clean Development Mechanism 25 The Guardian, Global carbon trading system has 'essentially collapsed', Sep 10, 2012
24
capitalization value of $324 million26. Gan and Smith’s analysis on the drivers on
renewable energy market has indicated that the drive for sustainable environment is greatly motivated by the nation’s GDP growth (Gan & Smith 2011). Therefore it is expected the CER price to return to pre-crisis levels as the global economic environment pick up its momentum.
Sale of CERs represents possible source revenue from Biomass investments. From a real estate point of view, it can be seen as an additional (revenue related) rent. The trading levels of CERs would affect the assets’ performance, value and thus attractiveness. Focusing on the emerging markets such as the ASEAN region, the growth in energy demand, concern about climate change and increasing cost of traditional sources of energy will force emerging markets to give political commitment to develop of renewable energy generation capacity. In addition, from an investor point of view, with the right combination of country’s policies, technology and the specific asset class, investments in the renewable energy sector could generate significant returns. Investors’ ability to identify the most appealing geographical target, sector and type of investment, in bid to yield attractive returns, would help to catalyze growth in the renewable energy market.
3.3
Biomass Energy Market
In this section, thesis will analyze the market potential of the biomass energy. The distributions of energy consumed and the electricity generated. Firstly, as shown in Figure 6 below, we can see that biomass energy constituted to more than half of the renewable energy consumed (boxed in red). The thesis would like to point out that the main bulk of the biomass is still consumed through traditional27 method, and this would also represent a huge untapped
potential for harnessing the supply of traditional biomass using modern technologies which energy could be derived efficiently.
26 Business Spectator, Global carbon market to reach record volumes by 2016, Feb 2014
(http://www.businessspectator.com.au/news/2014/2/28/carbon-markets/global-carbon-market-reach-record-volumes-2016)
27 Combusting biomass in an inefficiently and creating pollution. This includes using open fires, stoves, or furnaces
to provide heat energy for small-scale agricultural, industrial processing, and cooking. It is typically found in rural areas of developing countries.
25
Figure 6: Estimated Share of Global Energy Consumption, 2012
(Source: Renewables 2014 Global Status Report, REN21, 2014)
Figure 7: Breakdown of Global Electricity Production, 2013
(Source: Renewables 2014 Global Status Report, REN21, 2014)
Secondly, in terms of production of electricity, biomass energy is the third largest source of renewable energy used (see Figure 7). There is a wide range of biomass resources potentially available for conversion. This includes biodegradable fraction of products, waste and residues from agriculture (including vegetable and animal substances), forestry and related industries, as well as the biodegradable fraction of industrial and municipal waste. Therefore, we can see that the adoption of biomass energy is picking up speed in terms of the world’s dependence on it for
26
power generation. With adequate investments and the right international and national policy, they would help to catalyze the wave of biomass energy investment.
3.4
Southeast Asia Region (ASEAN)
Biomass is a relatively young industry in Southeast Asia or ASEAN28. New opportunities and
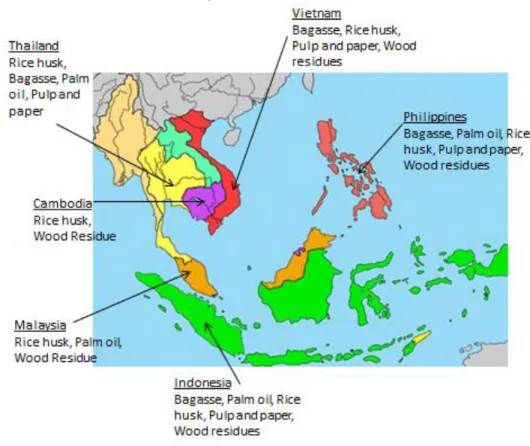
investments in biomass are emerging in Asia and particularly in ASEAN. Klimowicz’s report has revealed that shared that ASEAN produces nearly 230 million tons of feedstock annually (Klimowicz 2013). Considering this potential supply of feedstock for biomass energy shown in Figure 8, ASEAN is quickly developing itself as an attractive market for developing biomass as an energy source.
Figure 8: Biomass Feedstock Availability in ASEAN
(Source: Author29)
Governments in ASEAN have pushed for industry-friendly policies to encourage biomass energy growth, such as the feed-in tariff policy, which serves to simulate investment in renewable energy technologies. The feed-in tariff policy offers long-term contracts to renewable energy
28 Association of Southeast Asian Nations
27
producers based on the cost of generation of each technology. In addition, governments have also provided project developers with investment incentives, guaranteed minimum prices, power purchase agreements with the utility grid, exemptions pertaining to the import of equipment and certain tax credits (Ölz & Beerepoot 2010).
Thailand, for instance, was an early mover in identifying the industry’s underlying opportunities and had formulated policies to encourage biomass projects through the Small Power Producers (SPP) and Very Small Power Producers (VSPP)30 scheme introduced in the early 2000s
(Juntarawijit & Juntarawijit 2012). Plenty of the biomass power producers in Thailand are mostly in the VSPP scheme, given the small to medium scale of biomass investments. The country has set an ambitious target to achieve 3.7 gigawatts (GW) of biomass capacity by 2022. Meanwhile in Indonesia and Malaysia, power companies from other countries have been entering the local biomass power market31.
3.5
Biomass Investment Market: Thailand
Analyses by both public and private organizations, for example, International Energy Agency (Ölz & Beerepoot 2010) and clean energy professional service providers32 have shown that
Thailand is the most favorable country for biomass investment (see Figure 9) with the highest level of government support, financial support and local know-how support in ASEAN.
Figure 9: Level of Support for Biomass Investment in ASEAN
Level of Support Thailand Indonesia Malaysia Philippines Vietnam Government
Renewable Energy Targets
High Medium Medium Medium Medium
Financial Incentives High Medium Low Medium Medium
Local Know-How High Low Medium Medium Low
(Source: Author & International Energy Agency)
Therefore, the thesis would focus on Thailand as the geographical focus and residual products of rice (rice husk and rice straw) as the feedstock. Rice husk (Ngaemngam & Tezuka 2006) is
30 Refer to section 3.5 for more details.
31 AsianPower, What you need to know about the biomass energy market in South East Asia, 2011 (http://asian-power.com/environment/news/what-you-need-know-about-biomass-energy-market-in-south-east-asia) 32 A. T. Tri Co, Ltd, Presentation in Renewable Energy Asia 2014 in Bangkok, June 3, 2014
28
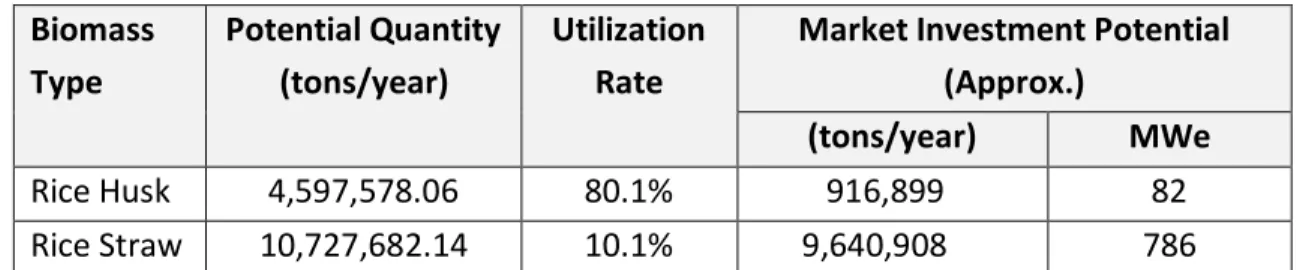
among the first choices due to its cheap, small size, and low moisture, compare with other biomass such as palm oil residue. The rice would provide the fuel to biomass power plants for combustion to generate heat, and/or electricity. The power can then be sold for revenue. Market Potential
A study by Thailand’s Department of Alternative Energy Development and Efficiency has shown that, the biomass from rice remains under-utilized (see Table 5). In Thailand, just the biomass from rice feedstock alone will provide an investment potential of almost 870 megawatts (MWe33) or about 80 to 170 biomass power plant projects, considering the size of biomass
power plants range from smaller than 1 to 20 MWe. As rule of thumb, 1 MWe is enough to power 800 to 1,000 homes34.
Table 5: Potential of Biomass from Rice Biomass Type Potential Quantity (tons/year) Utilization Rate
Market Investment Potential (Approx.)
(tons/year) MWe
Rice Husk 4,597,578.06 80.1% 916,899 82
Rice Straw 10,727,682.14 10.1% 9,640,908 786
(Source: Thailand’s Department of Alternative Energy Development and Efficiency & Author’s analysis)
Renewable Energy Policy
The Thailand government, Ministry of Energy has enforced an energy policy to promote the use of biomass as the fuel for generating electricity through SPP (Small Power Producers) and VSPP (Very Small Power Producers) programs.
In the early 2000s, the Thailand government has approved the SPP and VSPP programs encourages the private sector to an even stronger role in the electricity supply industry of the country by allowing private sectors to generate and sell electricity to the power utilities. In particular to the use of biomass, with the government offers a buyback price of electricity at a premium via the Adder and simplified the procedure for obtaining license permit35. The Adder
incentive scheme is an additional purchase price per kW-hour on top of normal tariffs calculated in accordance with formula under the relevant SPP or VSPP regulation (See Table 6)
33 Megawatts (electricity); the electricity generation capacity
34 Division of Agriculture and Natural Resources, University of California, (http://ucanr.org/WoodyBiomass) 35 Thailand’s Ministry of Energy
29
for the current Adder rate as of 2014). In an attempt to discourage speculators of the PPAs36,
the government has mandated (1) a bid bond 200 Baht/kW for VSPP applicants who would generate power of more than 100 kWe, and (2) no adder will be given if the project cannot start selling power within 1 year after the committed commercial operation date37.
Table 6: Thailand's Adder Scheme for Biomass Energy Biomass Power
Production
Adder (Baht/kWh)
Special Adder (3 Southernmost Provinces38and 4 Districts in
Songkhla) (Baht/kWh) Term from Commercial Operation Date Up to 1 MW 0.50 1.00 7 Years
More than 1 MW* 0.30 1.00 7 Years
(Source: Baker & McKenzie’s presentation in Climate Thailand Conference 2010)
The SPP scheme is for power plants selling power to the Electricity Generating Authority of Thailand39 (EGAT) of more than 10 MWe up to 90 MWe, while the VSPP scheme is for power
plants selling power to the Metropolitan Electricity Authority (MEA) or Provincial Electricity Authority (PEA) 40 of not more than 10 MWe.
Tax Incentives41
In addition, by investing in renewable energy, the biomass power plant project would enjoy exemption on corporate income tax for 8 years (without cap on profit). After that, it is taxed at half the normal rate i.e. 10%42 for 5 year after the exemption period. Investors are also eligible
for double deduction for cost of transportation, electricity and waters for 10 years from the date of first income derived, as well as deduction from net profit of 25% of investment in infrastructure installation and construction costs, in addition to normal capital depreciation. There is also exemption on import duty for equipment for certain years depending on the capacity of the plant. For equipment of power generation capacity less than 10 MWe i.e. VSPPs,
36 PPAs are usually secured prior to project construction, hence there are speculators that who are trying to “flip”
the PPAs by selling to developers to earn a quick profits.
37 Thailand’s Ministry of Energy, Department of Alternative Energy, Development and Efficiency (DEDE) 38 Yala, Pattanee and Narathivas
39 EGAT is a state enterprise that owns and manages the majority of Thailand's electricity generation capacity, as
well as the nation's transmission network.
40 MEA and PEA are the distributor of electricity in Thailand Most of EGAT's electricity is sold to the Metropolitan
Electricity Authority (which supplies the Bangkok region) and the Provincial Electricity Authority (which supplies the rest of Thailand).
41 Thailand’s Board of Investment (http://www.boi.go.th/tir/issue/201311_23_11/42.htm)
42 Thailand 2014 Corporate Income Tax is 20% for private company with net profit over 1 million baht, Thailand
30
imports of equipment are tax free. From the implementation till now, VSPPs serve as the driving force of the adoption of biomass energy.
Political Assessment
It should be noted that, apart from these favorable investment incentives. Investors’ appetite is also influenced by political instability which might change the favorable terms that investors enjoy. Thailand’s more than a decade long political unrest has caused economic damage. The political instability will definitely be a priority and assessed by investors when entering Thailand market.
Market Players
Private investments can be done through renewable energy project developers like Asia Biogas, Clean Technologies Thailand, Ratchaburi Electricity Generating Holding Company Limited, Electricity Generating Public Company Limited and BioMass Power Company Limited, and rice mill owners, for instance, Mungcharoenporn Family, are actively initiating new biomass deals and are constantly seeking capital to expand its portfolio. Local and foreigner investors, assuming the “money” partner role, such as Bangchak Petroleum, Federation of Thai Industries, Thai Polycons Public Company Limited and Electric Power Development Company (Japan) partner with the renewable energy developers to develop new biomass power plant projects. In the current biomass investment market, the market players are mostly dominated by investors and firms with specialized technical knowledge about renewable energy and/or traditional power production. It is because the biomass investment market is young and still developing, private equity and venture capital firms are not very active in the market. This could be due to the “lack of technical insight” and “lack of information i.e. transparency” barriers that are stopping financial institutions from entering the market.
The next chapter would discuss the biomass energy asset class and its investment process in greater details.
31
Chapter 4 Biomass Energy Investments
4.1
Introduction
A biomass power plant can add value to existing plots of land by converting a traditional cost (waste) into a revenue stream. The term “biomass” in this thesis refers to the by-product, residue or waste-product of other processes, such as farming, animal husbandry and forestry. The waste i.e. the agricultural residues would provide feedstock to the biomass power plants for combustion to generate heat, and/or electricity. The power can then be sold for revenue. This chapter would review the various components of biomass investment process and provide an overview to guide investors the process of investing in biomass power plant project i.e. the Biomass Investment Decision Process. In this chapter and for the development of the Biomass Valuation Model (BVM) in chapter 5, this thesis would use Thailand as the geographical focus and rice husk as the feedstock.
There are also agricultural products specifically being grown for biofuel production i.e. energy crops (A brief introduction is provided in Appendix 2). These include, for example, corn (U.S.), sugarcane (Brazil) and palm oil (ASEAN).
4.2
Biomass: Characteristics
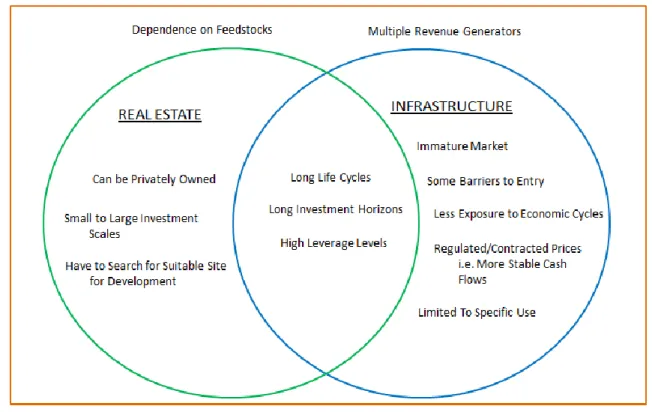
The Biomass industry, although is grouped under infrastructure, it has its own set of unique characteristics that constitute a combination of infrastructure and real estate asset. Biomass energy assets, for instance, (1) can range in a variety of scale understand general infrastructure, although mostly small-medium scale production (0–20 MWe), (2) location is very important like real estate when developing a biomass power plant considering the demand for power and supply of biomass feedstock, (3) biomass pricing is not subject to monopolistic control because it is provided by several small-medium local suppliers, and (4) biomass power plants can be privately owned in comparison to having a long term contract lease with the government. In a lot of ways, biomass energy assets are similar to traditional real estate and infrastructure. Its stable cash flows, long term investment horizons and attractive returns are some similarities. On the other hand, biomass energy assets are characterized by the production inputs and revenue generators. The supply of feedstock is crucial, and biomass energy assets have multiple revenue generators i.e. sale of power (electricity and heat), carbon credits and sale of fertilizer. Furthermore, favorable regulatory policies make biomass energy assets more distinct. The key characteristics of biomass energy assets are shown in Figure 10.
32 Figure 10: Characteristics of Biomass Energy Asset
(Source: Author)
Risk-Return Consideration
Investors (institutional and private)43 have numerous possibilities to allocate their money and
these are based on risk-return requirements of the specific investor. Institutional investors are typically banks, pension funds, insurance companies, and hedge and mutual funds. Pension funds and insurance companies, for instance are focused on asset liability management. In making their investment decisions they will consider if their portfolio is able to produce a return which will match their future liabilities, such as pension payments. The risk involved is naturally an important factor in assessing attractiveness of a specific biomass investment.
Private investors include individuals, private equity and venture capital companies. For them, liabilities are generally not the driving aspect of investment decisions. They are specialized investors with specific industry knowledge who are interested in investment with high risks and high rewards44. Considering the characteristics45, scale46, and relative immaturity47 of biomass
43 Zacks Research, Private vs. Institutional Investors, (http://finance.zacks.com/private-vs-institutional-investors-6252.html) 44 Refer to Figure 3 in Section 2.5
45 Refer to Figure 8 in Section 4.2 46 Refer to Section 3.4
33
investments in the ASEAN region, this thesis will mainly focus on direct investment and private investors i.e. private equity and venture capital investors.
4.3
Biomass Power Generation Using Combustion Technology
There is a diverse array of technologies to convert biomass resources into higher value products such as liquid and gaseous fuels or chemical products via thermochemical, biochemical or chemical means. However, most of these technologies are still not cost competitive. Currently, biomass resources are mainly used in the production of heat and electricity, and direct combustion is one of the most common methods. Direct combustion also showed the greatest potential for large scale utilization of biomass energy.
Other thermochemical conversion technologies like pyrolysis and gasification lack maturity and reliability and are not economically viable for large scale utilization. As such, they are certainly not the most feasible options for investment at present48. Therefore, investment in biomass
power plants that use direct combustion technology would be the most viable options.
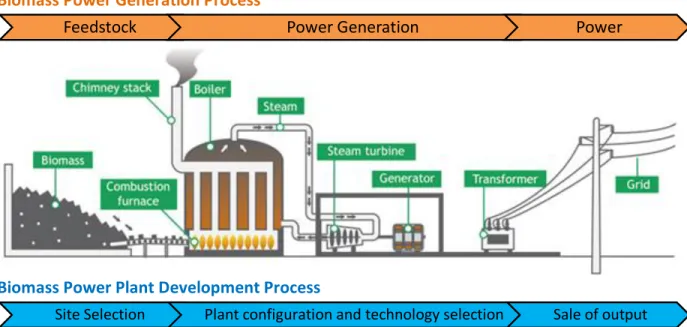
Figure 11 is a graphical representation of the biomass power generation process. Biomass is combusted in the power plant, which generated power i.e. electricity and/or heat (see orange arrows in Figure 11). Using a combined heat and power systems or known as cogeneration system i.e. generate both electricity and heat as output greatly increases overall energy efficiency of the biomass power plant.
47 Refer to Section 2.6
48 IRENA, RE Technologies Cost Analysis, Biomass (http://www.irena.org/DocumentDownloads/Publications/RE_Technologies _Cost_Analysis-BIOMASS.pdf)
34 Figure 11: Biomass Power Generation Process
Biomass Power Generation Process
Biomass Power Plant Development Process
(Source: Gestore dei Servizi Energetici GSE S.p.A, GSE49)
4.4
Biomass Power Plant Development Considerations
On a real estate perspective, the development of a biomass power plant operates on a 3 step process that entails, first, selecting the site i.e. availability of the feedstock, water supply and grid network, second, selecting the optimal plant configuration and technologies, and third, securing buyers of electricity and heat power, carbon credit and rice husk ash (see blue arrows in Figure 11 above). These items are discussed in detail below.
Site Selection
Biomass power plants are usually developed near agricultural production areas or farmlands, which are away from the city. In general, the site should be in proximity of biomass sources and the Electricity Generating Authority of Thailand50 (EGAT) transmission system or substation but
should be distant from the community to avoid adverse environment and health impacts during construction and operations.
49 GSE (http://www.gse.it/en/easyenergy/Guide/Bioenergy/Pages/default.aspx)
50 EGAT is a state enterprise that owns and manages the majority of Thailand's electricity generation capacity, as
well as the nation's transmission network.
Feedstock Power Generation Power