Publisher’s version / Version de l'éditeur: Fire and Materials, 2016-10-10
READ THESE TERMS AND CONDITIONS CAREFULLY BEFORE USING THIS WEBSITE.
https://nrc-publications.canada.ca/eng/copyright
Vous avez des questions? Nous pouvons vous aider. Pour communiquer directement avec un auteur, consultez la
première page de la revue dans laquelle son article a été publié afin de trouver ses coordonnées. Si vous n’arrivez pas à les repérer, communiquez avec nous à [email protected].
Questions? Contact the NRC Publications Archive team at
[email protected]. If you wish to email the authors directly, please see the first page of the publication for their contact information.
NRC Publications Archive
Archives des publications du CNRC
This publication could be one of several versions: author’s original, accepted manuscript or the publisher’s version. / La version de cette publication peut être l’une des suivantes : la version prépublication de l’auteur, la version acceptée du manuscrit ou la version de l’éditeur.
For the publisher’s version, please access the DOI link below./ Pour consulter la version de l’éditeur, utilisez le lien DOI ci-dessous.
https://doi.org/10.1002/fam.2405
Access and use of this website and the material on it are subject to the Terms and Conditions set forth at
School egress data: comparing the configuration and validation of five egress modelling tools
Cuesta, Arturo; Ronchi, Enrico; Gwynne, Steven M. V.; Kinsey, Michael J.; Hunt, Aoife L. E.; Alvear, Daniel
https://publications-cnrc.canada.ca/fra/droits
L’accès à ce site Web et l’utilisation de son contenu sont assujettis aux conditions présentées dans le site LISEZ CES CONDITIONS ATTENTIVEMENT AVANT D’UTILISER CE SITE WEB.
NRC Publications Record / Notice d'Archives des publications de CNRC:
https://nrc-publications.canada.ca/eng/view/object/?id=3b09eddd-ff9f-4226-95c7-250893a5d93c https://publications-cnrc.canada.ca/fra/voir/objet/?id=3b09eddd-ff9f-4226-95c7-250893a5d93c
School egress data: Comparing the configuration and validation of five
egress modelling tools
Arturo Cuesta1*, Enrico Ronchi2, Steven M.V. Gwynne3, Michael J. Kinsey4, Aoife L.Hunt5and
Daniel Alvear1
1University of Cantabria, Los Castros s/n, 39005, Cantabria, Spain; [email protected], +34 942
201826
2Department of Fire Safety Engineering, Lund University, Sweden; 3Construction – Fire Safety, National Research Council, Canada;
4Arup, China 5AECOM, UK
*corresponding author
ABSTRACT
Data were collected between 2011 and 2014 from five evacuations involving the same school buildings located in Spain. Children from six to 16 years of age were observed during the evacuation exercises. Background information was collected on key factors deemed to influence evacuation performance: a description of the geometry, the population involved, the procedures employed and the organisation of the drills conducted. Using live observations and video footage of these drills, evacuation data were collected, focusing on the pre-evacuation times, the routes employed, the travel speeds adopted and the arrival times. These data informed a range of a posteriori simulations, conducted using four computer models (buildingEXODUS, MassMotion, Pathfinder, and STEPS), as well as the SFPE hydraulic model (i.e. SFPE hand calculations). Comparisons were drawn between the models’ output and against the observed outcome for one of the trials to determine the accuracy of the model predictions given that they were configured using the initial conditions for a specific evacuation. The purpose of this work is to (1) provide insight into the configuration of these models for equivalent scenarios; (2) examine any variation in the simulated conditions given equivalent initial conditions; and (3) provide suggestions on how to perform validation studies for multiple evacuation models.
KEYWORDS: Data collection; evacuation modelling validation; school evacuation; egress
1. INTRODUCTION
Evacuation models are frequently employed to quantify evacuee performance. In order to credibly do so they require testing. Real-world observations are required, in as complete and refined a manner as possible, to enable validation of model performance. In this way, detailed comparisons can be made to compare the simulation of specific evacuation scenarios against representative data. The work presented here outlines a series of real-world observations and the application of these data in five evacuation models.
The evacuation process in schools is particularly challenging as children are not typically expected to self-evacuate, but will instead be reliant upon direction from staff (Kholshchevnikov, Samoshin, Parfyonenko, & Belosokhov, 2012), (Larusdottir & Dederichs, 2011). The behaviour of school children, and the degree of their reliance, is influenced by their age. This further complicates the evacuation process (Singer & Revenson, 1997) and poses challenges for its representation within evacuation models. Given the significant differences between evacuation in schools, and in buildings with adult populations, it is important that we understand the dynamics specific to school evacuations and collect appropriate data, in order to better quantify evacuation performance. This is important both to enhance our theoretical understanding of these events and to provide evidence to inform forecasting of evacuation performance from schools; i.e. using evacuation models. A lack of understanding might lead evacuation models to unduly simplify school evacuation and possibly underestimate evacuation times. Examples of possible differences include children walking speeds on stairs and horizontal surfaces, body dimensions and their impact on achievable densities/flows (Huo et al., 2015; Larusdottir & Dederichs, 2011; Ono, Valentin, & Vittorino, 2012) and assumptions regarding phased evacuation procedures and/or safety strategies.
A survey on evacuation model users (Ronchi & Kinsey, 2011) found that the extent of model validation is considered as the most important feature when selecting a model. However, where validation examines models for their broad application (e.g. only homogenous populations), it is unrealistic. This may also not account for the influence that the user and the data employed have on the modelling process in addition to the examination of models for validation purposes. This work presents data that describes specific school evacuations. One of these data-sets is employed to examine the representation of a specific evacuation trial in five evacuation models. Each model is utilised by different users who were given instructions to reflect the original trial as accurately as possible assuming an engineering timeline. Given the novelty of the data-set and the range of models examined, it is felt that the analysis will be of interest to the modelling community.
The models included in this validation test case have been chosen from among the most known/used, namely buildingEXODUS (Galea, 2014), MassMotion (Oasys, 2015), Pathfinder (Thunderhead Engineering, 2015), STEPS (Mott MacDonald Simulation Group, 2014) and the SFPE hydraulic model (employing hand calculations) (Gwynne & Rosenbaum, 2008).
The authors employ a convergence method to ensure that the results produced by the four computer models are representative; i.e. that the simulation samples employed would not change significantly if more simulations were conducted. This increases our confidence that the simulated outcomes from each model are a reasonable representation of expected performance, assuming that the model has been configured in an expert manner. In addition to the typical summary comparisons made between the models (e.g. overall clearance times, etc.), metrics from this convergence analysis are also employed to compare the simulated evacuation dynamics for each model with each other and with the trial data. The convergence analysis might therefore be of use in several ways: ensuring a stable
set of simulations, preventing the performance of redundant simulations, and providing additional insight into model performance.
The data used for model configurations were collected between 2011 and 2014 from five evacuation trials involving pre-school, primary and secondary school children from Altamira School, in Camargo, Spain, (Cuesta & Gwynne, 2016). These trials were observed in order to compile data-sets that allow us to (a) increase our understanding of the vulnerable populations in question, (b) quantify the nature of this vulnerability, and (c) provide a means by which the scenarios examined could aid model development, validation, and/or application (e.g. as part of an engineering project). The data collected includes the initial population distribution, the routes used, pre-evacuation times (and its constituent parts), walking speeds and overall evacuation times. As part of this work, the authors’ material have made available sufficient information for third parties to configure and apply to evacuation tools; e.g. architectural diagrams, population distributions, pre-evacuation times, route use, travel speeds, exit use, evacuation arrival times and model configuration files. Interested parties can request this material via email ([email protected]) and use it for modelling applications. Furthermore, CAD drawings of the structures involved are available at: http://www.gidai.unican.es/. To date, this paper includes comparison of the largest number of evacuation models with observations from school evacuations. The paper presents several valuable contributions:
- Data from five school evacuations enhancing theoretical understanding.
- Configuration and application of five evacuation models to simulate a school evacuation. - Use of convergence analysis to determine that the number of simulations performed is an
adequate representation of model performance.
- Comparison between the simulated and observed outcomes using summary and underlying conditions.
2. SCHOOL EVACUATION DATA 2.1. Trial Observations
Five drills were observed, all of which occurred in the Altamira School, Spain. The school consists of two separate buildings referred to as the Small Building and the Main Building. The layouts of these two buildings are presented in Figure 1.
We focus here on the evacuation of the Main Building, as the process was sufficiently complex to be of interest, was distinct from the Small Building evacuation, and the data-set reasonably complete. The Main Building is a four-storey structure (see Figure 1) with each floor 3.3 m in height and three exit points (Exits D, F and G). Exit D is 1.14 m wide with a double-leaf door and is the main entrance to the structure. Exit F is a 0.8 m wide emergency exit and is located on the basement level. Exit G was not observed during the trials and was used by a class that did not interact with the rest of the evacuees (Class 1) and it is deemed to be of less interest. Two stairs service the Main Building: Stair 1 (a dogleg stair, 1.23 m wide) and Stair 2 (a straight stair, 1.20 m wide).
The trials were part of the routine evacuation drills conducted each year at the school (see Table 1). Students had no prior warning during any of the trials. The teaching staff had some prior warning in Exercise E1; i.e. staff knew the date of the evacuation exercise in advance, but not the time. In Exercises E2-5 staff had no warning of the evacuation with the exception of the teacher in charge of safety and the secretariat of the school.
Figure 1: Layout of the school building and video-cameras location. Table 1: Basic information of the evacuation exercises (excluding class C1).
Evacuation
Exercise Date Nature of exercise N occupants
E1 12/14/2011 Semi-announced 310
E2 05/04/2012 Unannounced 271
E3 12/22/2012 Unannounced 293
E4 06/04/2013 Unannounced 288
The conditions on each of the trial days were different from each other. For instance, children were absent, different staff were allocated, etc. More significantly, Exercise E3 was conducted on the eve of the Christmas holidays and although teachers/students were still located in their respective classrooms, they were involved in Christmas activities, as opposed to routine lessons. The school had no automatic fire detection. During each of the egress trials, an alarm bell was manually activated by a secretary on the ground floor of the Main Building. This sounded throughout all occupied areas. This alarm was activated at 10:00 AM in all five of the evacuation exercises.
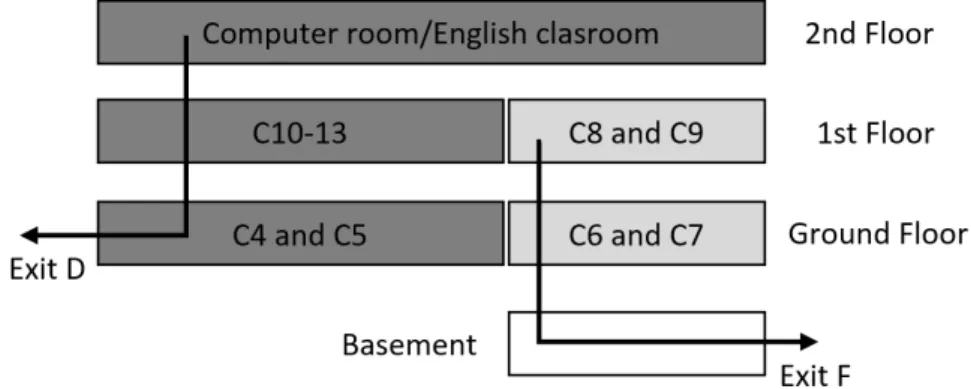
In each trial, once the alarm went off, the classes evacuated separately in a phased approach to reduce congestion. The evacuation strategy consisted of two separate evacuation routes using Exit D and Exit F. These routes are shown in Figure 2: classrooms in dark grey used Exit D and classrooms in light grey used Exit F. The lower floors were evacuated first, with no pre-determined prioritisation for classes on the same floor or for the two routes adopted. Therefore, classes from the same floor may have started at the same time and then moved along the two evacuation routes as planned. However, in reality teachers independently phased the movement of classes on the same floor to reduce the congestion produced; they examined the conditions that developed and the adapted the procedure accordingly.
Figure 2: Exit use of the Main Building.
2.2. Data Collection Process
Eight video cameras were used to capture the students’ use of the stairs (Stair 1 and 2) and the exits available (Exit D and F). These were positioned at ceiling height to improve the vantage point and reduce the impact of the cameras on the evacuation process. In addition, three video-cameras were placed to record movement and behaviour in the Main Building common areas (see Figure 1). All of the available egress routes were therefore observed during the evacuation. Measurements were made as consistently as possible using a behavioural dictionary that was established prior to the analysis being conducted. This described key evacuee behaviours used to quantify different aspects of their performance. The data collected consisted of: 1) the starting locations of pupils and teachers and routes used, 2) pre-evacuation times of the majority of the class groups involved, 3) the walking speeds, and 4) the evacuation curves generated by the evacuee arrival times at each exit. Given that the responsibilities and size of the teaching staff were known in advance, this process was relatively straightforward.
The starting locations of pupils and teachers were established by observing the video recordings in different areas and noting the number/type of occupants recorded. Their initial movement towards a stair was recorded, as was the arrival of staff and students at each exit. Therefore, it is possible to
determine, for each class, the route adopted during each evacuation trial. This information is particularly useful information for validation. These routes used are described in Table 2.
Pre-evacuation times were collected for each classroom observed in the Main Building (see camera positions in Figure 1). Given the location of the cameras, it was only possible to capture the times at which each of the classrooms were prepared to evacuate (i.e. when they were queued at the door and the teacher was checking the corridor) and then the time at which the class eventually moved off. The observed pre-evacuation time is deemed to comprise of the sum of the preparation and holding times, defined as:
• Preparation time (tpre) – the time from the sounding of the alarm to the teacher appearing at
the door with the students queued up behind him / her.
• Holding time (thold) - the duration of time that the class is held queuing at the door while the
corridor ahead of them is cleared by other classes.
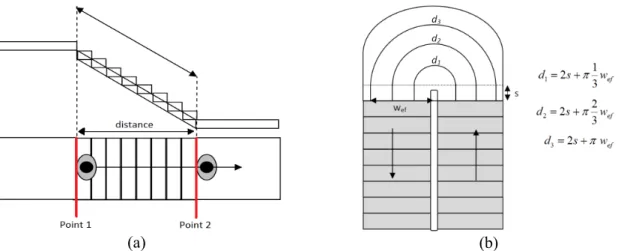
The evacuee walking speed was established by measuring the time taken by each evacuee to cover a pre-determined distance between two fixed reference points. The walking speed of each evacuee (vi)
was calculated according to:
r Ai Bi i F F F d v / 1 ) ( [1] where:
d - the pre-determined distance between the reference Point 1 and the reference Point 2 (in metres, measured directly in the scenario of experiments);
FAi- the frame when the individual’s body crosses the reference Point 1;
FBi- the frame when the individual’s body crosses the reference Point 2;
Fr- the frame rate (frames/sec).
The walking speeds on the landings were also measured. For Stair 1 this was achieved by considering three hypothetical elliptical trajectories (landing distances), extracted from the observed path of each individual instead of using an average path for all occupants. The three elliptical trajectories used are derived from the formulae in Figure 3 (b). For each observed evacuee, their path was fitted against the hypothetical trajectories. The closest match was then used to approximate the covered distance and to determine their travel speed, given that the landing clearance time was recorded for each (see Figure 3(a)).
(a) (b)
Figure 3: (a) Example of walking speed measurements. (b) Landing speed measurements. The exit arrival time of each evacuee was also measured at the specific frame when the body of the occupant crossed a reference point at the final point of exit (Exits D and F). All arrivals were individually observed, along with their corresponding classroom of origin. This allowed the impact of each class on overall performance to be established.
2.3. Observed Results
Table 2 presents the distribution of pupils and teachers, when the alarm sounded and the exit that they used, during each trial. Classes C1-C3 are not included in this analysis (C2-C3 were in the Small Building or class C1 used Exit G, which was not observed). Typically, the school population did not include children with physical impairments. However, during Trial E5 two children had temporary movement impairments requiring them to use crutches. Both of these children were originally located in C7, used Exit D, and evacuated along with student who had a cognitive impairment in C7 and a teacher.
Table 2: Population distribution and Exit Use.
Class (age) Trials E1 E2 E3 E4 E5 P* T EU P T EU P T EU P T EU P T EU C4(6-7) 21 1 D 22 2 D 22 2 D 11 2 D C5(7-8) 24 2 D 26 3 D 18 1 D 19 2 D 22 1 D C6(8-9) 26 1 F 26 1 F 25 2 F 25 1 F 21 F C7(9-10) 29 1 F 29 1 F 22 1 F 24 4 F 23 1 F 3 1 D C8(10-11) 25 1 F 25 2 F 26 1 D 29 1 F 21 1 F C9(11-12) 26 1 F 25 1 F 8 D 24 2 F 29 1 F 20 F C10(12-13) 33 2 D 29 1 D 18 1 D 18 1 D C11(13-14) 68 2 D 24 1 D 25 1 D 26 D C12(14-15) 19 1 D 21 1 D 20 1 D 30 1 D C13(15-16) 20 1 D 16 1 D 9 1 D Office 1 D 1 D 1 D 2 D 4 1 F Lobby 11 2 D 1 D 1 locker room basement 5 F
2ndfloor 31 3 D 10p
5s^ 2 D
11p
21s 2 D
Total 250 13 209 16 235 12 227 17 249 15
* P = Pupil; T = Teachers/personnel; EU = Exit Used
^ p = number of primary schoolers; s = number of secondary schoolers
Table 2 indicates that, in most instances, exit use followed the procedural plan. However, classes swapped routes (i.e. deviated from the procedure) on two occasions. During Trial 3, a total of 34 children from classrooms C8 and C9 along with a teacher evacuated through Exit D instead of using Exit F as intended.
Table 3 presents the pre-evacuation times observed during the trials in the Main Building by classroom and trial number. The preparation and holding times are presented independently, alongside the total pre-evacuation times. These data are collated across all trials in Table 4, indicating that both preparation and hold times produced approximately lognormal distributions. This is in line with expectation, given previous pre-evacuation distributions collected (Purser, 2001). However, caution should be shown in extrapolating a full distribution here, especially if generalising this data to other situations, given the relatively small sample size for the hold times (with 22 data points).
Table 3: Student pre-evacuation data collected from the five evacuation exercises.
Class Component Trial
E1 E2 E3 E4 E5
C4 (Pr) Hold Time (s)Prep Time (s) 110 4314 2011 100 Total (s)/# data-points 11 57 (22) 31 (19) 10 (11) C5 (Pr) Hold Time (s)Prep Time (s) 1312 184 400 170 146
Total (s)/# data-points 25 22 (26) 40 (18) 17 (22) 20 (22) C6 (Pr) Hold Time (s)Prep Time (s) N/A35 N/A38 1027 140 N/A39
Total (s)/# data-points 35 38 (26) 37 (25) 14 (25) 39 (21) C7 (Pr) Hold Time (s)Prep Time (s) 70 150 1939 1831 120
Total (s)/# data-points 7 (29) 15 (29) 58 (22) 49 (24) 12 (26) C8 (Pr) Hold Time (s)Prep Time (s) 40 80 3142 2011 250
Total (s)/# data-points 4 (24) 8 (25) 73 (26) 31 (29) 25 (23) C9 (Pr) Hold Time (s)Prep Time (s) 460 220 680 490 1735
Total (s)/# data-points 46 22 (25) 68 (27) 49 (24) 52 (29)
C10-11 (S)
Prep Time (s) N/A 24 59 24 34
Hold Time (s) N/A 23 55 31 0
Total (s)/# data-points N/A 47 (33) 114 (53) 55 (43) 34 (44) C12
(S)
Prep Time (s) N/A 24 57 22 17
Hold Time (s) N/A 0 96 14 66
Total (s)/# data-points N/A 24 (19) 153 (21) 36 (20) 83 (30) C13
(S)
Prep Time (s) N/A N/A 30 22 26
Hold Time (s) N/A N/A 136 3 0
Total (s)/# data-points N/A N/A 166 (20) 25 (16) 26 (9) Lobby Hold Time (s)Prep Time (s) 170
Table 4: Pre-evacuation times from trials E1-5.
Prep time (s) Hold time (s) Total (s)
DIST+ Lognormal Lognormal
-Mean 24.39 34.91 41.34
SD 15.20 31.62 35.26
Min 4.00 3.00 4.00
Max 68.00 136.00 166.00
N 38 22 41
+Distribution Law: fitted against Normal, Lognormal and Uniform distributions.
Table 5 presents the horizontal and staircase speeds observed during the trials. As expected, the stair walking speeds from pre-schoolers (averaging 0.57 m/s) are slower than primary and secondary children, which appeared to attain similar speeds (averaging 0.94 m/s and 0.92 m/s respectively). The average movement time for teachers/staff was 0.82 m/s; however, these were highly dependent on the student population for which they were responsible, as they typically modified their speed to move with the evacuating children. The wider range of horizontal movement speeds for primary students is due to large variations observed, i.e. many primary students ran during the evacuations. When running is excluded (i.e. taking students walking freely, walking inline and moving as a group), then average horizontal speeds were 1.3, 1. 5 or 1.2m/s respectively (Cuesta & Gwynne, 2016). Despite the relatively small sample sizes, the average speeds were broadly normally distributed.
Table 5: Average walking speed derived from trials E1-5.
Vertical (m/s) Horizontal (m/s)
Primary* Secondary^ Adult Primary Secondary Adult
DIST+ Normal - Normal - Normal Normal
Mean 0.94 0.92 0.82 1.58 1.21 1.47
SD 0.23 0.18 0.17 0.44 0.28 0.40
Min 0.34 0.24 0.37 0.98 0.70 0.88
Max 1.53 1.79 1.17 3.13 2.15 2.32
N 359 430 52 159 214 20
+Distribution Law: fitted against Normal, Lognormal and Uniform distributions.
*Primary (C4-9) ^Secondary (C10-13)
Evacuation times are presented in Table 6. As expected, the arrival time curve for Trial E3 is different from the other curves (see Figure 4) given the slightly different scenario examined. The first person out during Trial E3 arrives up to 25s after the first person in the other trials; and the arrival curve is stepped, diverging from the other curves after 100s (see Figure 4). The curves produced during the other trials are broadly similar. This is likely influenced by the increased pre-evacuation times produced during the Trial E3 evacuation.
Table 6: Evacuation times (s).
Result Trial Avg
E1 E2 E3 E4 E5 Main Building Exit D Avg. Arrival Time(s) 72.7 60.3 124.6 62.3 78.3 82.6
Time Exit in Use 18-129 19-123 44-199 23-107 16-142 18-142
Exit F
Avg. Arrival
Time(s) 67.7 71.0 86.9 86.4 75.8 76.9
Time Exit in Use 20-116 23-113 49-145 33-160 23-127 20-160
Number 110 110 70 115 102 101 Performance for Main Building 70.8 [18-129] 65.5 [19-123] 113.9 [44-199] 73.6 [23-160] 77.3 [16-142]
Figure 4: Main Building arrival time curves.
The data collected is only briefly described here. For a more detailed description, the user is referred to an earlier article (Cuesta & Gwynne, 2016). In the next sections, a sub-set of this data forms the basis for examination of the performance of four evacuation models and the SFPE engineering calculations.
3. MODEL COMPARISON
The first five authors were tasked with simulating one the observed trials using a model of their choice and with which they had sufficient expertise. The authors were provided with the data-set associated with the trial and then told to best represent this data-set in their model and the associated initial conditions. The goal here was to ensure that the configured model simulated the initial/evolving conditions as reasonably as possible, rather than constrain how the model users employed the data. This would have been another approach and provided different insights, albeit still interesting.
The observations represent five repeated trials of the same building. These five trials enable two different types of comparison to be made (or some combination of them):
[Approach A] Trial-Specific, where the conditions of a single trial is used as a basis for comparison. The underlying conditions (population distribution, pre-evacuation profiles and route use) for the trial are employed to configure the model and the model then executed. This then allows the model output to be compared directly against the specific outcome of the trial in question to determine how accurate the model predictions are given a precise definition of the initial conditions. Five different trial specific test cases are available if this approach is adopted.
[Approach B] Building-Specific, where the conditions across the trials are combined to form a representative set of initial conditions. An instance of the initial conditions (population distribution, pre-evacuation times and route use) is derived from the combined set and the simulated output is compared against the envelope of results produced from the same set of trials. A single building specific test case is available.
In this analysis, the former approach is employed. Trial 3 was selected as it had the most complete set of background data and output available for comparison. In addition, the conditions produced in Trial 3 were somewhat different from the over four scenarios making its use within the Trial Specific approach possible, while allowing the other four scenarios to be employed using the Building
Specific approach (left for future work).
Five evacuation modelling tools have been employed allowing comparison to be made with the Trial 3 result: buildingEXODUS (Galea, 2011), MassMotion (Oasys, 2015), Pathfinder (Thunderhead Engineering, 2015), and STEPS (Mott MacDonald Simulation Group, 2014) and the SFPE engineering calculations (Gwynne & Rosenbaum, 2008). The objectives are to (1) demonstrate the potential for using the data collected as part of a validation exercise and (2) present the assumptions required to configure the models using the same data, and then (3) provide some insight into model performance. The models were chosen to ensure that either a fine network modelling approach (STEPS and EXODUS), a continuous modelling approach (MassMotion and Pathfinder) or macroscopic approach (SFPE engineering calculations) were employed. The models were configured to represent the data collected and then a cross comparison between model results against each other and the observations have been performed. It should be noted that the primary reason for applying the SFPE hand calculations was to demonstrate the ability to configure such calculations (given the data available) and also to provide an additional benchmark against which to make comparisons. The simulated results produced by the four computer models (STEPS, buildingEXODUS, MassMotion and Pathfinder) were examined to ensure that they were representative of the expected model output; i.e. that sufficient runs were conducted to produce a sub-set of possible simulations that form a representative and robust sample of the simulation space. The convergence method proposed by Ronchi et al (2014) has been adopted to examine the impact of behavioural uncertainty1
on the variability of the results produced and therefore its representativeness. Multiple runs were conducted and the results compared (for each of the models separately) to ensure that a sufficient number of simulations had been executed to produce a stable measure of the scenario examined, in accordance with pre-defined acceptance criteria. Once stability was determined, no more runs were deemed necessary as the results were then assumed representative. This approach then ensures that a stable, representative set of simulations is examined and reduces the likelihood of performing redundant simulations that do not make the set of simulations more representative.
The method employs error estimations and functional analysis to evaluate the convergence of the occupant-evacuation time curves produced by the egress models employed. Five variables are considered in order to evaluate the convergence of the simulations: (1) Total Evacuation Time, TET: the time for the last arrival from the building; (2) Standard deviation of total evacuation times, SD: measure of the spread of last arrival times; (3) Euclidean Relative Distance, ERD: the average difference between arrival curves; (4) Euclidean Projection Coefficient, EPC: the best possible agreement between arrival curves; and (5) Secant Cosine, SC: similarity between the curve shape by assessing the gradients produced along arrival curves. SC provides an understanding into the
1Relating to both our understanding of the conditions faced at the time and the sensitivity of the individual decision-making process to these conditions and the outcomes produced.
differences in shape of the curves. EPC is used to represent the projection of a vector onto another. A more detailed discussion of these measures can be found here Ronchi et al (2014).
In the present case study, the following acceptance criteria (thresholds) have been assumed:
<0.01 for 10 consecutive number of runs [2] <0.05 for 10 consecutive number of runs [3] <0.01 for 10 consecutive number of runs [4] <0.01 for 10 consecutive number of runs [5] <0.01 for 10 consecutive number of runs [6] Where convj represents the average value of a specific variable obtained after the ithrepeated run.
The SFPE hand calculation was not subjected to this convergence test given the reliance of the analysis on simple functions as opposed to stochastic processes or complex interacting parts that produce variability.
3.1 Modelling assumptions
The evacuation models were configured according to the initial Trial 3 conditions. The model configuration was performed independently by the authors in accordance with expected practice; i.e. the available data was prescribed and then the authors attempted to represent it as best they could within the assigned model. This approach was adopted to explore the different ways in which the same data-set might be represented by different modellers using different models in order to represent the same scenario. As in all situations, the model output is a combination of the user and the model employed. In each case, the authors are expert users of the models in question and applied the data to represent the scenario in accordance with the model guidance and their experience with the model.
The methods adopted were compared (to confirm that comparison was reasonable) to ensure that the assumptions made were consistent, albeit requiring different user actions to represent them within each of the models. Of course, other methods could have been employed in the models used here. The methods are then examples adopted to demonstrate the variety of possible approaches. However, they are representative of the types of user actions required to configure and employ the models described. Given the fact that models make use of distributions, stochastic variables and pseudo-random sampling techniques, multiple runs of the same scenarios were simulated. The convergence of the repeated simulations was evaluated using the convergence method previously described (Ronchi et al., 2014).
The model configuration related to the description of the structure, the initial population distribution and the performance of the evacuating population. In four of the five approaches (all except the hand calculations), the structure was represented using a CAD file of the structure: MassMotion, Pathfinder and buildingEXODUS used the default representation of space; STEPS employed a grid size of 0.4mx0.4m. The SFPE engineering calculations assume a coarse node representation that does not make direct use of a CAD file. Instead, the user represented the connectivity, distances and capacity of the space within the calculations performed. These were extracted manually from the CAD diagrams.
A population of 247 evacuees was simulated in the evacuation scenario, with the teacher/student numbers and distribution reflecting those observed for Trial 3. The manner in which the population is represented within each of the models is described in the following sections.
3.1.1. Starting Location
The population was generated and positioned according to the observations made in Trial E3:
buildingEXODUS ensured consistent starting locations and regenerated the population every five simulations to produce new agent attribute values. The order of the set of simulations was then randomized to prevent overly optimistic convergence in the results
STEPS ensured consistent starting locations and regenerated the population every simulation. Pathfinder ensured consistent starting locations and the population characteristics were
randomized every simulation.
MassMotion represented the agent origin based on Trial E3 adopting random sampling within each pre-assigned classroom.
The SFPE engineering calculation reflected the number of people initially located in each room / building space.
In all instances, the population was assumed to start in their assigned classrooms. Where initial locations were randomized / modified, the population size of each room was maintained to ensure consistency with the observed levels. Where evacuee movement required the use of internal exits, the default model assumptions regarding exit performance were assumed.
3.1.2. Pre-Evacuation Times
In all five models, the total pre-evacuation time (preparation + hold time) was applied to the members of each Trial E3 class; i.e. the population was given the same representative overall pre-evacuation time derived from Table 3 for the Trial E3 pre-evacuation. In the Pathfinder, STEPS and MassMotion models, occupants were initially grouped in each classroom, next to the doors. Each group then began exiting through their classroom door after the predefined pre-movement time had elapsed. This delay was deterministic, and consisted of the observed times during the trial in question (i.e. the preparation time plus the holding time). Similarly, in the SFPE calculations, a single deterministic delay value was used. In buildingEXODUS, occupants were randomly located in each classroom, ensuring that the number of occupants within each class was set according to observed levels. A pre-evacuation time (incorporating both the preparation and holding time) was determined for each occupant according to a uniform distribution between the minimum and maximum values derived from the data associated with each room.
3.1.3. Agent body dimensions
The explicit representation of the range of body dimensions event in Trial 3 is not possible in buildingEXODUS and STEPS since the dimensions of the agents is driven by the nodal network assumed (i.e. the cell size in fine network models). In buildingEXODUS, the default nodal size is assumed (0.5m x 0.5m), while in STEPS grid cells of 0.4x0.4 m are used. Similarly, no specific measures are taken to represent the different body sizes evident in Trial 3 (e.g. students and teachers) in the SFPE hand calculations.
The continuous models (Pathfinder and MassMotion) explicitly represented the different body sizes, albeit in a simplified manner:
Pathfinder adopted the default shoulder width for teachers (45.6 cm), and shoulder widths of 0.3 m for secondary school children and 0.21 m for primary school children.
MassMotion adopted a body radius of 0.25m for teachers, 0.22m for secondary school students and 0.18m for primary school students.
3.1.4. Route Use
In all four computational models, the evacuees were assigned exits in accordance with the routes used by evacuees in Trial E3, and then used the routes that reached these exits. These routes were examined to determine their credibility. In the SFPE calculation, the exit use observed in Trial 3 was assumed and reflected in the analysis; i.e. that the numbers of evacuees along a particular route reflected the assumed route use.
3.1.5. Horizontal Travel Speeds
In all models, the evacuating population was assigned horizontal travel speeds derived from all five trials (Trials E1-5 in Table 5This approach was adopted given the similarity between speeds attained during the trials and to increase the number of data points available.
buildingEXODUS employed a uniform distribution between the minimum and maximum horizontal speed values observed.
Pathfinder employed a truncated normal distribution between the minimum and maximum horizontal speed values observed.
STEPS employed a truncated normal distribution between the minimum and maximum horizontal speed values observed.
MassMotion employed a triangular distribution using the minimum and maximum horizontal speed values observed and the average as the mode. Agents in the simulation will attempt to walk at the desired walking speed but will adjust this speed considering acceleration/decelerations (at a rate of 3m/s2) towards/from other agents and objects. The
default Fruin (Fruin, 1987) crowd density speed reduction factors were deactivated in model as the speeds assigned to agents were those based on movement within a crowd already. This means agents will not further reduce their speed according to the density of the crowd around then in line with Fruin Level of Service observations.
The SFPE calculations employed the mean horizontal travel speeds derived from the observations. The value reflected whether the population was primary or secondary students, but applied to all evacuees in each class (students and adults), based on the assumption that adults accompanied the student evacuees.
3.1.6. Vertical Travel Speeds
The models employed different approaches to represent the stair speeds:
buildingEXODUS directly employed the vertical travel speed data derived from all five trials, based on the type of evacuee (student / adult) and the terrain (Trials E1-5 in Table 4). This data was approximated using a uniform distribution.
Both Pathfinder and STEPS applied a reduction factor to the Horizontal Travel Speeds typically employed. Pathfinder makes use of the “ramp function” to simulate the reduction factors. This factor was derived from the relationship between the horizontal / vertical data collected in Trial 3. A reduction factor 0.58 was applied to Stair 1 and 0.9 applied to Stair 2 in both models.
In MassMotion, the default stair speed reduction factors were employed. Agents’ assigned desired horizontal walking speed is reduced by a given proportion for each stair based on the incline of each stair. A reduction of factor of 49.8% was applied to Stair 1 and 55.9% applied to Stair 2.
The SFPE calculations employed the mean vertical travel speeds derived from the observations. The value reflected whether the population was primary or secondary students, but applied to all evacuees in each class (students and adults), based on the assumption that adults accompanied the student evacuees.
The horizontal and vertical speed distributions were applied within each model according to the distributions specified in Table 5. The speeds were assigned to each agent according to the selected distribution, producing representative travel speeds; i.e. each agent had a speed produced that fell somewhere on this distribution. For each agent modelled, this represents the maximum speed attainable. In reality, the maximum speed (i.e. free-moving speed) is likely to be slightly greater than those recorded during the simulation because of the the impact of agent interaction on attained movement. However, (a) the building was not heavily populated; (b) the children typically moved in orderly queues; (c) low densities were observed throughout; and (d) the phased evacuation further reduced congestion. Furthermore, many of the students observed would have physical dimensions smaller than the typical demographic represented in the models and this difference in dimensions might also have influenced the speed/density relationship.
Given the low densities recorded during the trials (see Table 7, where the overall stair densities for E3 were on average 1.05±0.58 p/m2), the experimental speed is used as a maximum prescribed
speed, representing a conservative/simplified estimate of the achieved rate. In each model, the initial assigned speeds are then applied regardless of the initial densities and the mechanisms by which the computational models resolved agent interactions (and hence forecast flow conditions) were left as default.
Table 7: Stair density in trial E3.
Density (p/m2)
Stair 1: 1stflight 1.32 ± 0.42
Stair 1: 2ndflight 1.12 ± 0.39
Stair 2: 1stflight 1.10 ± 0.58
Stair 2: 2ndflight 0.77 ± 0.67
The achieved flows through key pinch points in the evacuation (i.e. doors and stairs) emerged from the population densities, the direction of population movement and the extent of the constraint. The models, by default, adopt different methods of relating the achievable flow -rates to the population density or equivalent measure (e,g, interpersonal distance). These mechanisms were employed to ensure that the analysis was consistent and credible. Given the nature of the SFPE calculations, a decision was taken regarding the flow constraints applied, as these specified the maximum achievable flow rate, as opposed to contributing to them. The maximum specific flows presented in the SFPE handbook were used, as indicated in the first order approach (Gwynne & Rosenbaum, 2008). Therefore, in the same way as in the simulation models, the speeds imposed for the SFPE calculations were used to determine the travel time between pinch points, observed pre-evacuation times and travel speeds were employed and the maximum specific flow rates were then used for stairs and exits.
Unless specified in the previous discussion, the model default options were employed. For instance, matters of overtaking, spacing, collision avoidance, merging, etc., were left given the lack of consistent data supporting modification.
3.2. Results
The qualitative and quantitative analyses of model results are presented in this section. These comprise the assessment of the convergence of model results as well as the comparison of model results against each other and against experimental data.
3.2.1. Convergence of Model results
Each of the four computer models were executed independently. Individual simulations were conducted and then the convergence produced examined to establish whether sufficient number of runs had been completed. Five simulations were initially completed for each model and then sets of five simulations were conducted until the criteria were met The convergence of results for the four computer models (MassMotion, Pathfinder, STEPS and buildingEXODUS) is illustrated in Figure 5.
STEPS Pathfinder
buildingEXODUS MassMotion
In Figure 5, the line TRtet=erd=epc=sc represents the thresholds of the acceptance criteria (1%) for TET, ERD, EPC and SC; TRsdrepresents the threshold (5%) for the standard deviation criteria, SD. The models converge at different rates for the different variables examined (e.g. TET, ERD, EPC and SC). In each case, the sequence of simulations was stopped once all of the criteria were met. These criteria result in a total number of repetitions lower than 35 runs for all models. The standard deviation of total evacuation time is the slowest variable to converge in all models, while the other variables converge relatively quickly; for instance, 15 runs are approximately sufficient for all models considering these variables. We conclude that the variability of the simulated results (representing scenario unknowns and behavioural uncertainty) is compliant with the chosen acceptance criteria.
In addition to determining the convergence of simulated results, three of the variables identified above (EPC, ERD and SC) can also be used to examine the similarity between the high-level observations and simulated results. Along with more routine numerical comparisons of the simulated results produced, these variables are employed to quantify the differences between the simulated and observed evacuation arrival curves where normally only more qualitative analyses would be possible.
3.2.2. Analysis of results
Two types of results for the four computer models are presented in this section: - the summary results across the multiple simulations performed by each model,
- and a detailed analysis of a single representative simulation: the simulation with the overall evacuation time closest to the mean of the repeated simulations was chosen for each model for more detailed analysis. This is highlighted below.
These results are examined to determine the similarity between the overall outcomes produced and between the evolving conditions that led to them in the simulated and observed data-sets. The mean, minimum and maximum of the first arrival, the average arrival and last arrival times produced by the models are presented in Table 8, along with the simplified SFPE calculations are also presented in summary form in Table 8.
The results indicate only small differences between the simulated results produced by the four computer models and the trial data: differences for last out (≈5% for Pathfinder, ≈6% for STEPS, ≈7% for buildingEXODUS and ≈5% for MassMotion), first out (≈6% for Pathfinder, ≈1% for STEPS, and ≈1% for buildingEXODUS and ≈3% for MassMotion) and average time to get out (≈3% for Pathfinder, ≈3% for STEPS, ≈3% for buildingEXODUS and ≈2% for MassMotion). The computer models were reasonably consistent in their performance in all three measures.
The use of the first and last evacuee out increases the variation in the results measured, given the nature of these indicators. These indicators then amplify differences measured. This approach was adopted so as to scrutinize model performance as closely as possible, risking exaggerated model variability rather than being insensitive to model variability.
Table 8: Arrival times comparison from repeated simulations with each model (mean [min-max]).
Indicator Experiment Model results
Trial 3 Pathfinder STEPS buildingEXODUS MassMotion SFPE
1stout 44 47 [44-45] 44 [43-46] 44 [44-45] 45 [44-48] 44
Last out 199 209 [204-223] 211 [205-222] 215 [210-218] 210 [202-215] 200 Average Evacuee Arrival Time 114 118 [117-119] 117 [116-118] 118 [117-119] 117 [116-118]
-Table 9 shows the class exit times of the single representative simulation for each of the models. Again, the similarity between the modelled and observed class arrival and exit clearance is apparent. Pathfinder class exit times (considering the absolute values of differences and the destination exits together) differed on average by ≈8% (up to a maximum of 42%), STEPS differed on average by ≈10% (up to a maximum of 35%), buildingEXODUS differed on average by ≈9% (up to a maximum of 27%) and MassMotion differed on average by ≈9% (up to a maximum of 27%). The relative errors produced by each of the models are shown in Error! Reference source not found..
Figure 6: Relative error of model predictions for class arrival times.
As expected, the SFPE calculations are marginally quicker than the computer models representing a 1% difference from the trial results (completing in 200s, see Table 8). However, this reduction is smaller than would typically be the case where the standard SFPE travel speeds would have been employed. The use of the travel speeds also explains the similarity between the SFPE prediction and the trial observation. The SFPE calculations also produced a reasonable estimate for the last evacuees out of each exit, with the differences of 1% (Exit D) and 12% (Exit F).
Table 9: Exit times for a representative simulation for each model and the observed results from Trial 3.
Exit D
Class Trial 3 Pathfinder STEPS buildingEXODUS MassMotion SFPE
1st Last 1st Last 1st Last 1st Last 1st Last 1st Last
C4 60 72 60 74 62 75 61 74 62 72 44 200 C5 44 68 44 55 44 55 45 57 45 53 C8+C9 96 114 95 121 83 130 84 132 96 145 C10 124 144 131 205 128 195 124 168 134 174 C11 145 165 131 172 136 167 128 170 132 183 C12 166 180 169 199 170 194 164 201 134 184
C13 182 199 190 210 188 205 182 216 185 209
Exit F
Class Trial 3 Pathfinder STEPS buildingEXODUS MassMotion SFPE
1st Last 1st Last 1st Last 1st Last 1st Last 1st Last
C6 49 68 54 71 52 79 50 84 55 78
57 128
C7 69 87 70 86 73 95 72 93 74 87
C9 128 145 99 128 95 130 94 138 125 144
Figure 7 illustrates the average exit time curves across the full set of simulations generated by each of the four computer models. A visual comparison between the different curves indicates that there is a reasonable agreement between the results produced by the models and the experimental curve. It is also apparent that the simplified results produced by the SFPE calculations bounds these results.
Figure 7: Visual comparison of arrival time curves.
After plotting the differences between the arrival curves and experimental data it is possible to further interrogate the results produced by the computer models. Figure 8 shows the relative difference between the average arrival time curve for each computer model and the experimental arrival curves. This provides insight into the size and pattern of differences produced during the simulation process. For instance, the buildingEXODUS curves seem to more closely approximate evacuee arrivals in the second half of the evacuation, after initially producing discrepancies. The peaks produced may represent discrepancies deriving from the simulated evacuation in specific classrooms. For example, in MassMotion, during the simulation of classrooms 8 and 6, the last agent to enter the adjacent stairs gets caught in the cross-flow of agents evacuating other classrooms, increasing their evacuation time. Therefore, for those classrooms, the time between first and last evacuee is increased in comparison to the observed results, which is reflected in the relative error. Similar issues can be observed in the peak differences in the buidingEXODUS, STEPS and Pathfinder simulation results.
Figure 8: Relative differences between a representative set of simulated results and observed results Relative difference plots can provide insights into the underlying dynamics of the simulated evacuation process. The improvement in accuracy may be due both to the techniques used within the model and also the manner in which the vertical movement rates were directly employed during these simulations.
The functional analysis operators ERD, EPC and SC can also be employed to further compare the computer simulation results and trial observations. Here, comparison is made between the trial data and average arrival curves produced by each model. This allows the quantitative comparison between the arrivals during the evacuation as opposed to comparing summary results. The use, limitations and assumptions of these operators have been previously discussed by Peacock et al for the context of fire model validation (Peacock, Reneke, D. Davis, & Jones, 1999) and Ronchi et al (Ronchi, Kuligowski, Reneke, Peacock, & Nilsson, 2013), Galea et al (Edwin R. Galea, Deere, Brown, & Filippidis, 2012), and Lovreglio et al (Lovreglio, Ronchi, & Borri, 2014) for evacuation model validation.
The values for ERD, EPC and SC measures for the four evacuation models are presented in Table 10 (see brief description of these terms in Section 3). An ERD close to zero and EPC close to one indicate good agreement between the observed and simulated curves. An SC close to one indicates similarities in the shape of the observed and simulated curves. The values produced indicate a reasonable agreement for all of the computer models with the trial observations. This type of analysis is particularly useful during model validation studies where it would be possible to set acceptable tolerance thresholds for these measures (as suggested by Galea et al (2012) and Lovreglio et al (Lovreglio et al., 2014)).
buildingEXODUS generates an ERD of 0.01, which corresponds to a very small average difference between the simulated and observed curves; similarly small differences are found for the other three models with ERD = 0.06 for Pathfinder, ERD = 0.05 for STEPS and ERD=0.03 for MassMotion. The EPC measure is very close to 1 in all models (EPC=1 in buildingEXODUS, 0.98 in STEPS and Pathfinder and 0.99 in MassMotion) again indicating a good agreement between the simulated and observed curves. More variability is evident in the reproduction of the overall shape of the experimental curve, with values ranging from approximately 0.8 (namely 0.77 for STEPS, 0.78 for Pathfinder and 0.84 for MassMotion) up to 0.94 for buildingEXODUS. The better agreement of buildingEXODUS with the experimental curve may be influenced with the method employed by the user to represent the vertical walking speeds (i.e. directly taken from data).
Table 10: Values for ERD, EPC and SC produced comparing the experimental trial 3 and the evacuation simulation results.
Model ERD EPC SC
Pathfinder 0.06 0.98 0.78 STEPS 0.05 0.98 0.77 buildingEXODUS 0.01 1.00 0.94 MassMotion 0.03 0.99 0.84 4. DISCUSSION To reiterate:
- Five school evacuation data-sets were collected. One of these was selected to be used as part of a set of evacuation model tests. The trial in question was selected as it was significantly different from the other four trials observed. In addition, the selected case could be used to examine the model representation of this particular evacuation, while the set of four remaining trials might be employed to represent an evacuation from this particular building in a more typical engineering application. This latter approach is left for future work.
- Five evacuation models were configured by five different expert users. The guidance provided to the users was to represent the original evacuation as authentically as possible, using the data available, their expertise with the model and given a typical engineering application timeline.
- The models were applied. The results produced by the four computer models were examined to determine whether the number of simulations were sufficiently representative. This helped ensure a stable representation and reduced redundancy.
- The model results produced were compared with each other and with the original observations.
All of the model users had sufficient information to configure their model. They were able to represent the spatial, procedural and behavioural factors upon the outcome. Indeed, the data available was likely more detailed than would typically be the case in a typical engineering application. The models were configured independently. The manner in which the users configured the model was not constrained other than that it should represent an authentic attempt to represent the original conditions.
It was found that a number of factors, including the computer power available, influences the number of hours required to model an evacuation scenario such as this. The time taken to design and configure the evacuation scenario was dependent upon the model used: this took less than an hour for the SFPE calculations, but typically depends on the speed of hand calculations (i.e. the experience of the modeller); and for the simulation tools it ranged between 2-3 hours. The time taken to run simulations, calculate convergence criteria and process the output took between 1.5-3 hours for the expert users engaged.
The models were executed and the simulated results examined to establish the stability of the output produced, where necessary. None of the models required more than 35 simulations to produce a stable set of results. The computer models predicted building clearance times within 5-7% of the observations, while the SFPE engineering calculations predicted building clearance times within 1%. This indicates that, in replicating the flows during this kind of highly controlled scenario, the total
evacuation time can be well described with hand calculations; i.e. using standard flow rates, typically based on adult data, yields comparable outcomes for children in this particular case. The convergence analysis showed that models produce results that converge at different rates, depending on the model assumptions and calibration method adopted. In addition, the analysis of the convergence results showed that model performance can be differentiated across criteria, highlighting the importance of adopting a convergence analysis based on multiple criteria.
The models were configured to represent the data-sets provided. The scenarios examined were therefore bound by the context and results of the original experiment. This exercise provides some insight into the similarity between the observed conditions and the simulated results produced and therefore validation for the models examined. Typically, this granularity of data will not be available to inform and constrain the model performance. In such circumstances, the model users would have had to have made more assumptions. Here, the direct application of results focused the testing. The consideration of scenarios comparing a user-configured model against default model performance is certainly of interest, but is left for future work.
5. CONCLUSION
Understanding of evacuation performance is still at a reasonably immature stage. We still need to strengthen our theoretical and empirical knowledge. There is enormous variety in the conditions produced during an evacuation based on the scenario, especially the behavioural and procedural response of the population. It is not then safe to assume that the understanding of performance in one environment can be directly applied to another. School evacuations represent a good example where such an approach is not appropriate. For our understanding to influence design and life safety, it is important for us to be able to quantify evacuation performance with confidence in the applicability of our methods. For this to be the case we need evacuation models that can be suitably configured and that have been tested against performance standards, to enhance our confidence in the results produced.
This article has explored all of these issues: outlining data to enhance our understanding of school evacuations, the configuration and execution of five evacuation models, and then the analysis of the results produced. The results produced were encouraging, both in terms of the ability of independent users to configure the models and the accuracy of the models examined.
Of course, the process presented here and the data available are not typical of normal engineering practice. The accuracy of the results produced cannot then be assumed for all applications. However, it is encouraging that suitably configured models can predict results that are reasonable, in terms of the summary output as well as the underlying dynamics, and that they were able to do so without performing redundant and superfluous simulations.
ACKNOWLEDGEMENTS
Steve Gwynne would like to acknowledge Lisette Séguin, Cameron McCartney and Ahmed Kashef (all NRC) for their comments during the review of this article. Michael Kinsey would like to acknowledge Alexandru Dragan and Codrin Florescu (from the University of Edinburgh) for their work with the MassMotion evacuation simulation software.
REFERENCES
Cuesta, A., & Gwynne, S. M. V. (2016). The collection and compilation of school evacuation data for model use. Safety Science, 84, 24–36. http://doi.org/10.1016/j.ssci.2015.11.003
Fruin, J. J. (1987). Pedestrian Planning and Design ((Revised Edition)). Elevator World, Inc, Mobile, AL.
Galea, E.R., Lawrence, P.J., Gwynne, S., Filippidis, L., Blackshields, D., Cooney, D.:
BuildingEXODUS V5.0 User Guide and Technical Manual, Fire Safety Engineering Group, University of Greenwich (2011)
Galea, E. R., Deere, S., Brown, R., & Filippidis, L. (2012). An Evacuation Validation Data Set for Large Passenger Ships. Presented at the Pedestrian and Evacuation Dynamics 2012
Conference, ETH, Zurich (Switzerland).
Gwynne, S. M. V., & Rosenbaum, E. (2008). Employing the Hydraulic Model in Assessing Emergency Movement. In SFPE Hanbook of Fire Protection Engineering (4th Edition). National Fire Protection Association, Quincy (MA): Di Nenno P. J.
Helbing, D., & Molnár, P. (1995). Social force model for pedestrian dynamics. Physical Review E, 51(5), 4282–4286. http://doi.org/10.1103/PhysRevE.51.4282
Huo, F. Z., Song, W. G., Liu, X. D., Cao, S. C., Zeng, Y. P., & Liew, K. M. (2015). Experimental Study on Children Movement in a Stairwell of a Teaching Building. Civil Engineering and Architecture, 3(2), 31–37. http://doi.org/10.13189/cea.2015.030201
Kholshchevnikov, V. V., Samoshin, D. A., Parfyonenko, A. P., & Belosokhov, I. P. (2012). Study of children evacuation from pre-school education institutions. Fire and Materials, 36(5-6), 349– 366. http://doi.org/10.1002/fam.2152
Larusdottir, A. R., & Dederichs, A. S. (2011). Evacuation Dynamics of Children – Walking Speeds, Flows Through Doors in Daycare Centers. In R. D. Peacock, E. D. Kuligowski, & J. D. Averill (Eds.), Pedestrian and Evacuation Dynamics (pp. 139–147). Boston, MA: Springer US. Retrieved from http://link.springer.com/10.1007/978-1-4419-9725-8_13
Lovreglio, R., Ronchi, E., & Borri, D. (2014). The validation of evacuation simulation models through the analysis of behavioural uncertainty. Reliability Engineering & System Safety, 131, 166–174. http://doi.org/10.1016/j.ress.2014.07.007
Mott MacDonald Simulation Group. (2014). Simulation of Transient Evacuation and Pedestrian MovementS. STEPS User Manual v5.3.
Oasys. (2015). Oasys Software Limited. (2015). MassMotion Manual v7.0.4
Ono, R., Valentin, M., & Vittorino, F. (2012). Walking speed data of fire drills at an elementary school (pp. 98–108). Presented at the 5th International Symposium on Human Behaviour in Fire, Cambridge, UK: Interscience Communications.
Peacock, R. D., Reneke, P. A., D. Davis, W., & Jones, W. W. (1999). Quantifying fire model evaluation using functional analysis. Fire Safety Journal, 33(3), 167–184.
http://doi.org/10.1016/S0379-7112(99)00029-6
Purser, D. A., & Bensilum, M. (2001). Quantification of behaviour for engineering design standards and escape time calculations. Safety Science, 38, 157–182.
http://dx.doi.org/10.1016/s0925-7535(00)00066-7Ronchi, E., & Kinsey, M. (2011). Evacuation models of the future: Insights from an online survey on user’s experiences and needs (pp. 145–155). Presented at the Advanced Research Workshop Evacuation and Human Behaviour in Emergency Situations EVAC11, Santander, Spain: Capote, J. et al.
Ronchi, E., Kuligowski, E. D., Reneke, P. A., Peacock, R. D., & Nilsson, D. (2013). The process of Verification and Validation of Building Fire Evacuation models. Technical Note 1822. National Institute of Standards and Technology.
Ronchi, E., Reneke, P. A., & Peacock, R. D. (2014). A Method for the Analysis of Behavioural Uncertainty in Evacuation Modelling. Fire Technology, 50(6), 1545–1571.
http://doi.org/10.1007/s10694-013-0352-7
Singer, D. G., & Revenson, T. A. (1997). A Piaget primer: how a child thinks. Madison, Conn.: International Universities Press.


![Table 8: Arrival times comparison from repeated simulations with each model (mean [min-max]).](https://thumb-eu.123doks.com/thumbv2/123doknet/14076541.463083/18.892.81.838.1058.1139/table-arrival-times-comparison-repeated-simulations-model-mean.webp)

