Key Comparison CCEM-K7:
AC Voltage Ratio
Draft B Report Version I
Part 2: Results
May 20, 2011
Ian Robinson1 , Janet Belliss1 , Stephen Bryant1 , Antonio S´anchez2 , Yolanda ´Alvarez2 , Kurt Schweiger2 , Carlos D´ıaz2 , Miguel Neira2 , Luca Callegaro3 , Rae Duk Lee4, Isabelle Blanc5 , Frederic Overney6 , XiaoBing He7 , Cheng Ding7 , ZhongTai Qian7 , Bryan Waltrip8 , Greig Small9 , John Fiander9 , Peter Coogan9 , Heather Leigh Johnson9
, Yasuhiro Nakamura10
, Erik Dierikx11 , Anil Kishore Saxena12
, Mohd Saleem12 , Barry Wood13 , Guenther Ramm14 , Gunnar Eklund15 , Enis Turhan16 , Yuri Semenov17
Contents
1 Analysis 9
1.1 Measurements . . . 9
1.2 Transport Uncertainty . . . 9
1.3 Measurement Processing . . . 10
1.4 Largest Consistent Subset . . . 11
1.5 Measurements . . . 11
2 Acknowledgements 11 3 Results 27 4 Raw Data Tables 188
List of Figures
1 Decimal ratios - in-phase measurements at 1 kHz . . . 122 Decimal ratios - Quadrature measurements at 1 kHz . . . 13
3 Elevenths - in-phase measurements at 1 kHz . . . 14
4 Elevenths - Quadrature measurements at 1 kHz . . . 15
5 Decimal ratios - in-phase measurements at 1 kHz . . . 18
6 Decimal ratios - quadrature measurements at 1 kHz . . . 19
7 Elevenths - in-phase measurements at 1 kHz . . . 20
8 Elevenths - quadrature measurements at 1 kHz . . . 21
9 Decimal ratios - in-phase measurements at 55 Hz . . . 22
10 Decimal ratios - quadrature measurements at 55 Hz . . . 23
11 Elevenths - in-phase measurements at 55 Hz . . . 24
12 Elevenths - quadrature measurements at 55 Hz . . . 25
List of Tables
1 Pilot Laboratory measurements In-Phase at 1 kHz . . . 12
2 Pilot Laboratory measurements Quadrature at 1 kHz . . . 13
3 Pilot Laboratory measurements In-Phase at 1 kHz . . . 14
4 Pilot Laboratory measurements Quadrature at 1 kHz . . . 15
5 Evaluation of consistent subsets for measurements at 1 kHz . . . 16
6 Evaluation of consistent subsets for measurements at 55 Hz . . . 17
7 In-Phase measurements at 1 kHz (Decimal) . . . 18
8 Quadrature measurements at 1 kHz (Decimal) . . . 19
9 In-Phase measurements at 1 kHz (Elevenths) . . . 20
10 Quadrature measurements at 1 kHz (Elevenths) . . . 21
11 In-Phase measurements at 55 Hz (Decimal) . . . 22
12 Quadrature measurements at 55 Hz (Decimal) . . . 23
13 In-Phase measurements at 55 Hz (Elevenths) . . . 24
14 Quadrature measurements at 55 Hz (Elevenths) . . . 25
15 Key Comparison Reference Values . . . 27
16 DOE to the KCRV at 1 kHz, Voltage Ratio of 0.9, In-Phase . . . 28
17 Lab-Lab DOE at 1 kHz, Voltage Ratio of 0.9, In-Phase . . . 28
18 DOE to the KCRV at 1 kHz, Voltage Ratio of 0.9, Quadrature . . . . 30
19 Lab-Lab DOE at 1 kHz, Voltage Ratio of 0.9, Quadrature . . . 30
20 DOE to the KCRV at 1 kHz, Voltage Ratio of 0.8, In-Phase . . . 32
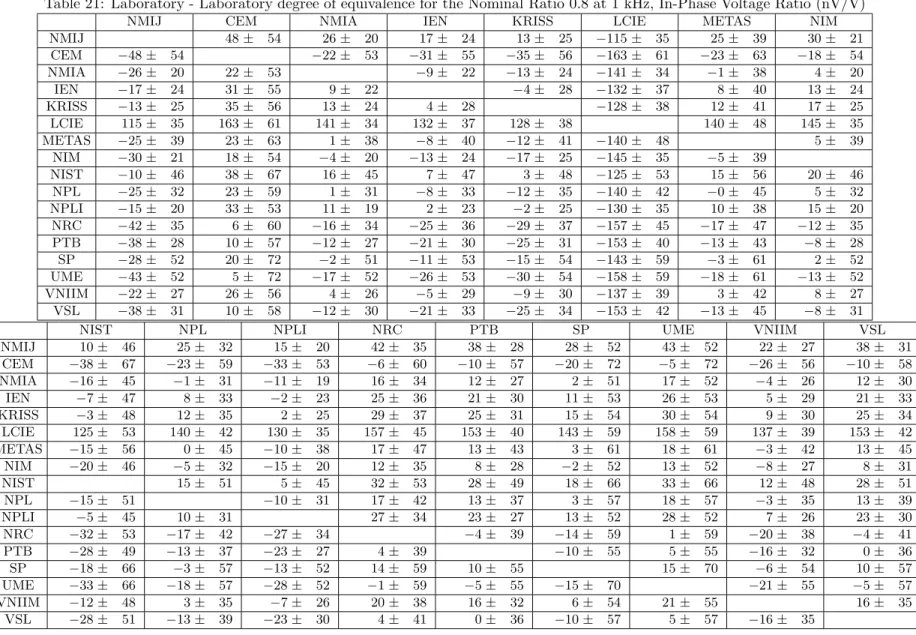
21 Lab-Lab DOE at 1 kHz, Voltage Ratio of 0.8, In-Phase . . . 32
22 DOE to the KCRV at 1 kHz, Voltage Ratio of 0.8, Quadrature . . . . 34
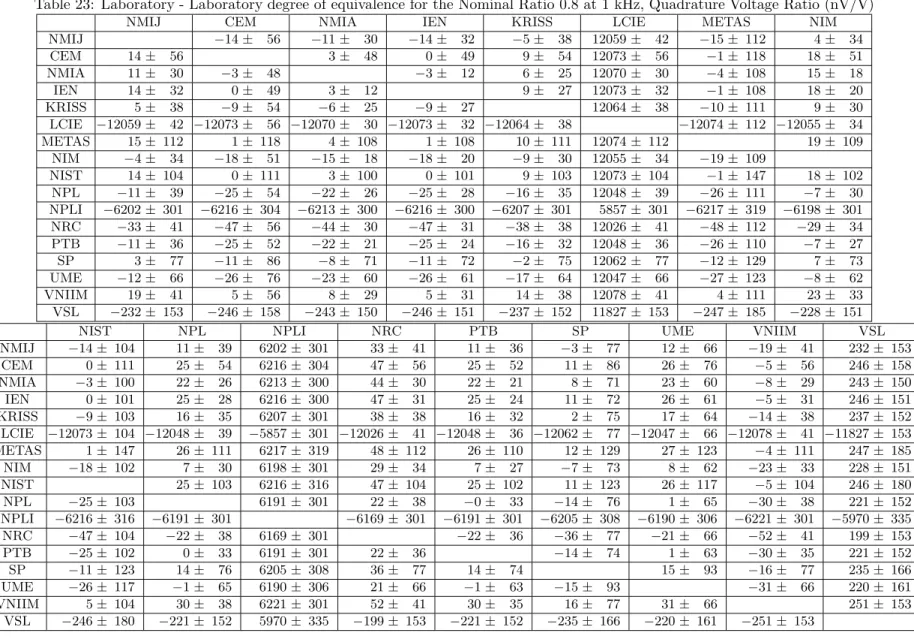
23 Lab-Lab DOE at 1 kHz, Voltage Ratio of 0.8, Quadrature . . . 34
24 DOE to the KCRV at 1 kHz, Voltage Ratio of 0.7, In-Phase . . . 36
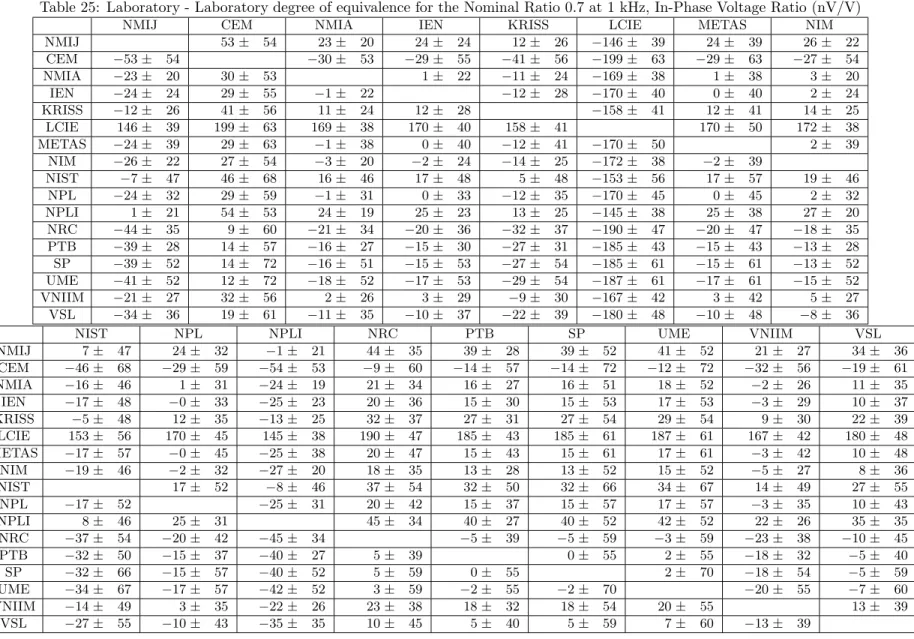
25 Lab-Lab DOE at 1 kHz, Voltage Ratio of 0.7, In-Phase . . . 36
26 DOE to the KCRV at 1 kHz, Voltage Ratio of 0.7, Quadrature . . . . 38
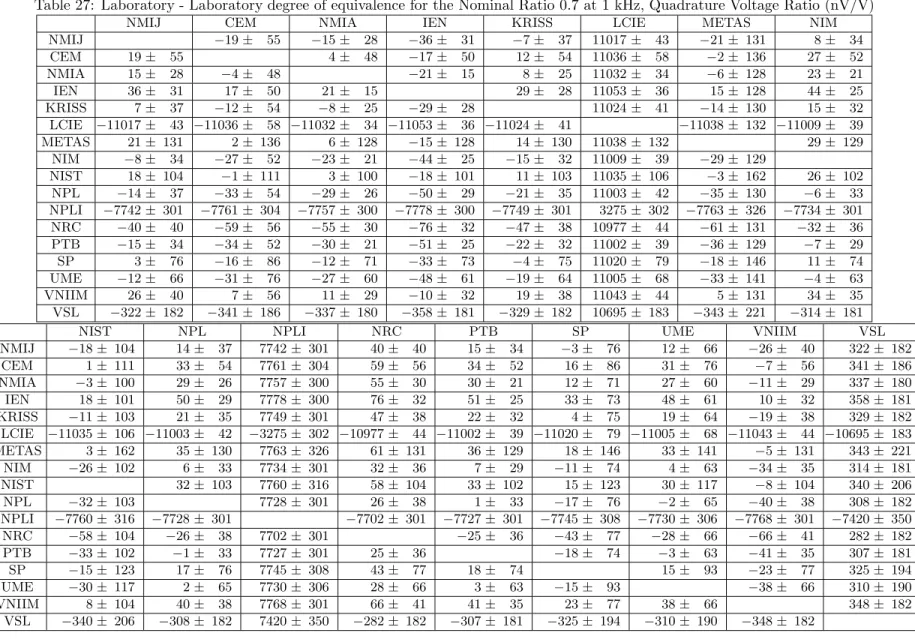
27 Lab-Lab DOE at 1 kHz, Voltage Ratio of 0.7, Quadrature . . . 38
28 DOE to the KCRV at 1 kHz, Voltage Ratio of 0.6, In-Phase . . . 40
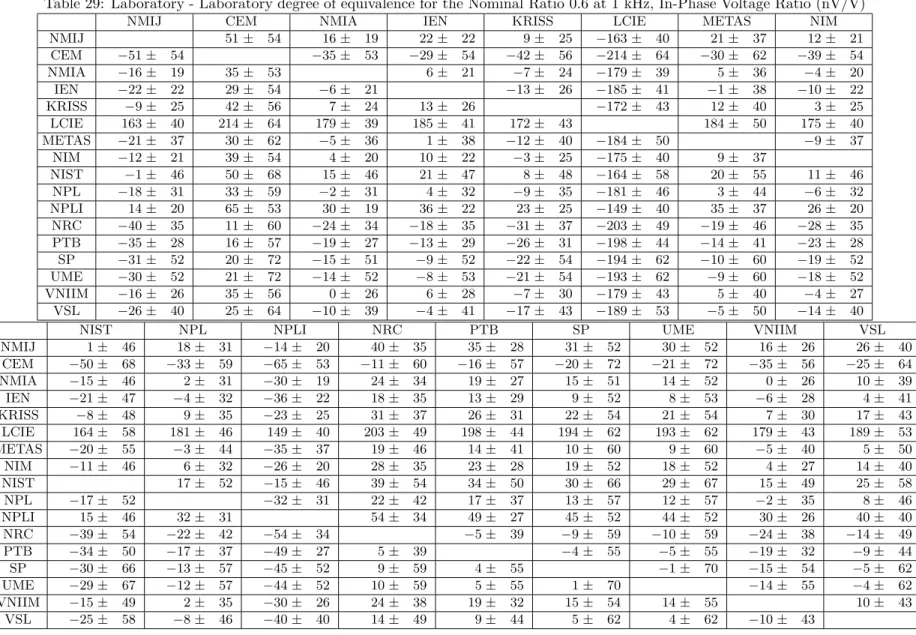
29 Lab-Lab DOE at 1 kHz, Voltage Ratio of 0.6, In-Phase . . . 40
30 DOE to the KCRV at 1 kHz, Voltage Ratio of 0.6, Quadrature . . . . 42
31 Lab-Lab DOE at 1 kHz, Voltage Ratio of 0.6, Quadrature . . . 42
32 DOE to the KCRV at 1 kHz, Voltage Ratio of 0.5, In-Phase . . . 44
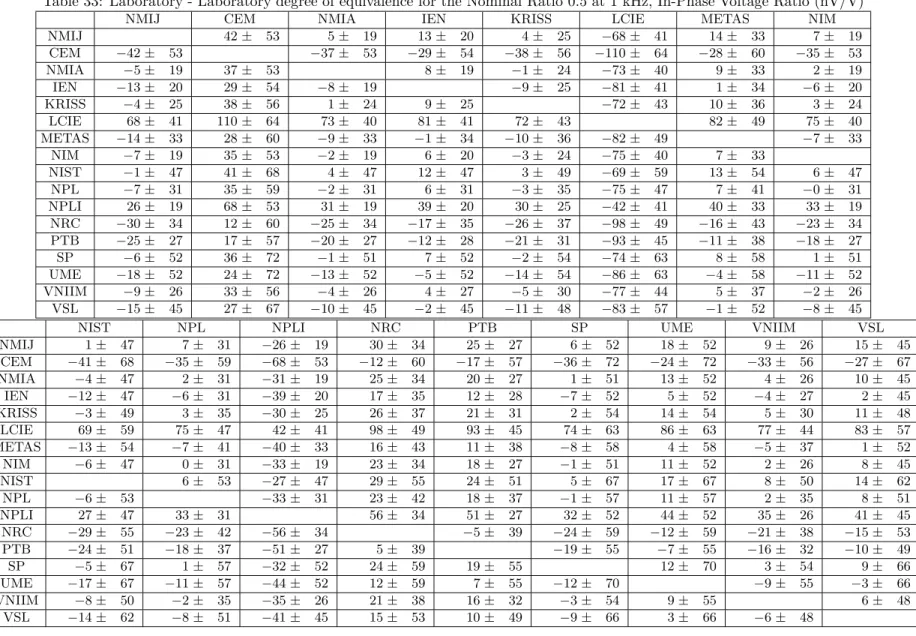
33 Lab-Lab DOE at 1 kHz, Voltage Ratio of 0.5, In-Phase . . . 44
34 DOE to the KCRV at 1 kHz, Voltage Ratio of 0.5, Quadrature . . . . 46
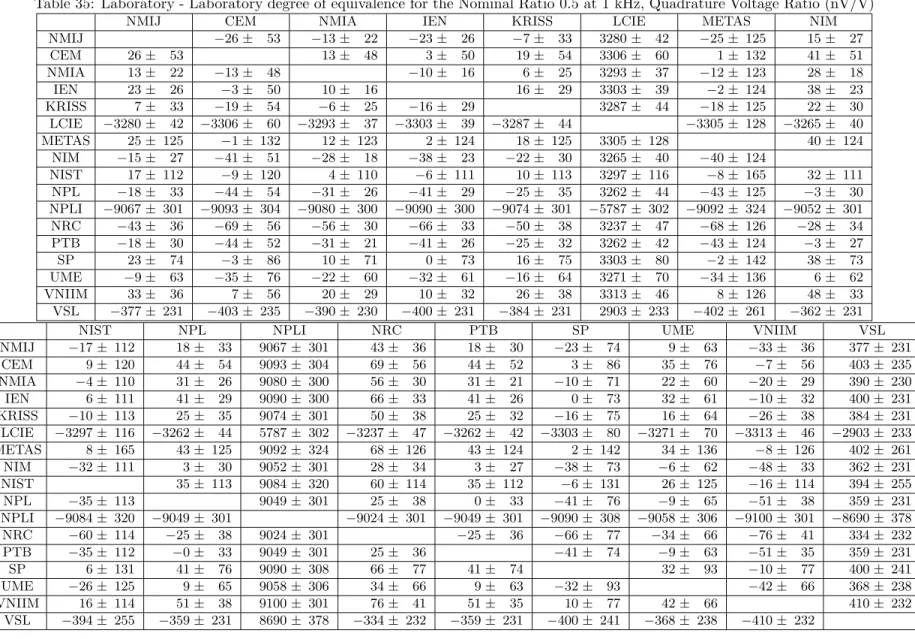
35 Lab-Lab DOE at 1 kHz, Voltage Ratio of 0.5, Quadrature . . . 46
36 DOE to the KCRV at 1 kHz, Voltage Ratio of 0.4, In-Phase . . . 48
37 Lab-Lab DOE at 1 kHz, Voltage Ratio of 0.4, In-Phase . . . 48
38 DOE to the KCRV at 1 kHz, Voltage Ratio of 0.4, Quadrature . . . . 50
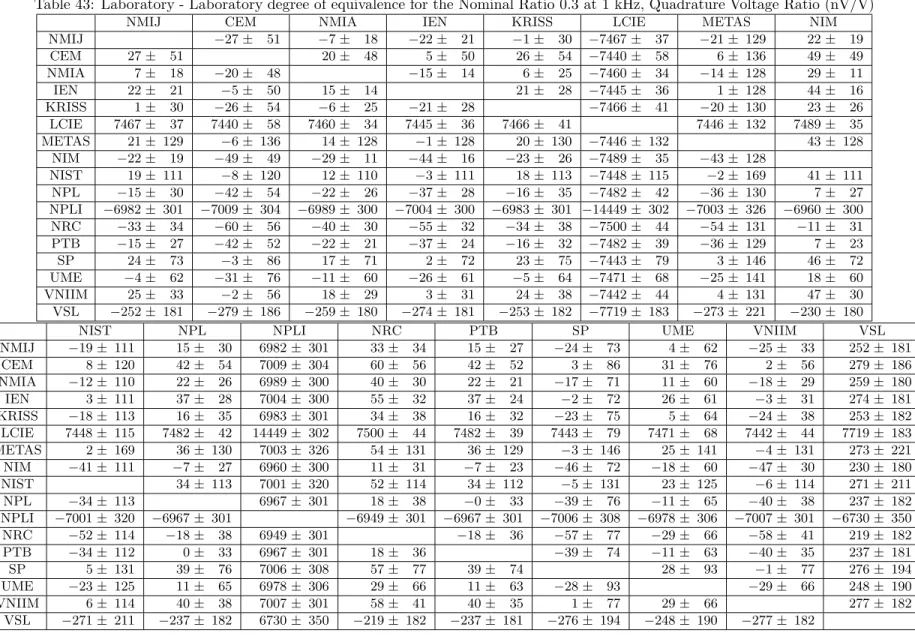
41 Lab-Lab DOE at 1 kHz, Voltage Ratio of 0.3, In-Phase . . . 52 42 DOE to the KCRV at 1 kHz, Voltage Ratio of 0.3, Quadrature . . . . 54 43 Lab-Lab DOE at 1 kHz, Voltage Ratio of 0.3, Quadrature . . . 54 44 DOE to the KCRV at 1 kHz, Voltage Ratio of 0.2, In-Phase . . . 56 45 Lab-Lab DOE at 1 kHz, Voltage Ratio of 0.2, In-Phase . . . 56 46 DOE to the KCRV at 1 kHz, Voltage Ratio of 0.2, Quadrature . . . . 58 47 Lab-Lab DOE at 1 kHz, Voltage Ratio of 0.2, Quadrature . . . 58 48 DOE to the KCRV at 1 kHz, Voltage Ratio of 0.1, In-Phase . . . 60 49 Lab-Lab DOE at 1 kHz, Voltage Ratio of 0.1, In-Phase . . . 60 50 DOE to the KCRV at 1 kHz, Voltage Ratio of 0.1, Quadrature . . . . 62 51 Lab-Lab DOE at 1 kHz, Voltage Ratio of 0.1, Quadrature . . . 62 52 DOE to the KCRV at 1 kHz, Voltage Ratio of 0.01, In-Phase . . . 64 53 Lab-Lab DOE at 1 kHz, Voltage Ratio of 0.01, In-Phase . . . 64 54 DOE to the KCRV at 1 kHz, Voltage Ratio of 0.01, Quadrature . . . . 66 55 Lab-Lab DOE at 1 kHz, Voltage Ratio of 0.01, Quadrature . . . 66 56 DOE to the KCRV at 1 kHz, Voltage Ratio of 10/11, In-Phase . . . . 68 57 Lab-Lab DOE at 1 kHz, Voltage Ratio of 10/11, In-Phase . . . 68 58 DOE to the KCRV at 1 kHz, Voltage Ratio of 10/11, Quadrature . . . 70 59 Lab-Lab DOE at 1 kHz, Voltage Ratio of 10/11, Quadrature . . . 70 60 DOE to the KCRV at 1 kHz, Voltage Ratio of 9/11, In-Phase . . . 72 61 Lab-Lab DOE at 1 kHz, Voltage Ratio of 9/11, In-Phase . . . 72 62 DOE to the KCRV at 1 kHz, Voltage Ratio of 9/11, Quadrature . . . 74 63 Lab-Lab DOE at 1 kHz, Voltage Ratio of 9/11, Quadrature . . . 74 64 DOE to the KCRV at 1 kHz, Voltage Ratio of 8/11, In-Phase . . . 76 65 Lab-Lab DOE at 1 kHz, Voltage Ratio of 8/11, In-Phase . . . 76 66 DOE to the KCRV at 1 kHz, Voltage Ratio of 8/11, Quadrature . . . 78 67 Lab-Lab DOE at 1 kHz, Voltage Ratio of 8/11, Quadrature . . . 78 68 DOE to the KCRV at 1 kHz, Voltage Ratio of 7/11, In-Phase . . . 80 69 Lab-Lab DOE at 1 kHz, Voltage Ratio of 7/11, In-Phase . . . 80 70 DOE to the KCRV at 1 kHz, Voltage Ratio of 7/11, Quadrature . . . 82 71 Lab-Lab DOE at 1 kHz, Voltage Ratio of 7/11, Quadrature . . . 82 72 DOE to the KCRV at 1 kHz, Voltage Ratio of 6/11, In-Phase . . . 84 73 Lab-Lab DOE at 1 kHz, Voltage Ratio of 6/11, In-Phase . . . 84 74 DOE to the KCRV at 1 kHz, Voltage Ratio of 6/11, Quadrature . . . 86 75 Lab-Lab DOE at 1 kHz, Voltage Ratio of 6/11, Quadrature . . . 86 76 DOE to the KCRV at 1 kHz, Voltage Ratio of 5/11, In-Phase . . . 88 77 Lab-Lab DOE at 1 kHz, Voltage Ratio of 5/11, In-Phase . . . 88 78 DOE to the KCRV at 1 kHz, Voltage Ratio of 5/11, Quadrature . . . 90 79 Lab-Lab DOE at 1 kHz, Voltage Ratio of 5/11, Quadrature . . . 90 80 DOE to the KCRV at 1 kHz, Voltage Ratio of 4/11, In-Phase . . . 92 81 Lab-Lab DOE at 1 kHz, Voltage Ratio of 4/11, In-Phase . . . 92
82 DOE to the KCRV at 1 kHz, Voltage Ratio of 4/11, Quadrature . . . 94 83 Lab-Lab DOE at 1 kHz, Voltage Ratio of 4/11, Quadrature . . . 94 84 DOE to the KCRV at 1 kHz, Voltage Ratio of 3/11, In-Phase . . . 96 85 Lab-Lab DOE at 1 kHz, Voltage Ratio of 3/11, In-Phase . . . 96 86 DOE to the KCRV at 1 kHz, Voltage Ratio of 3/11, Quadrature . . . 98 87 Lab-Lab DOE at 1 kHz, Voltage Ratio of 3/11, Quadrature . . . 98 88 DOE to the KCRV at 1 kHz, Voltage Ratio of 2/11, In-Phase . . . 100 89 Lab-Lab DOE at 1 kHz, Voltage Ratio of 2/11, In-Phase . . . 100 90 DOE to the KCRV at 1 kHz, Voltage Ratio of 2/11, Quadrature . . . 102 91 Lab-Lab DOE at 1 kHz, Voltage Ratio of 2/11, Quadrature . . . 102 92 DOE to the KCRV at 1 kHz, Voltage Ratio of 1/11, In-Phase . . . 104 93 Lab-Lab DOE at 1 kHz, Voltage Ratio of 1/11, In-Phase . . . 104 94 DOE to the KCRV at 1 kHz, Voltage Ratio of 1/11, Quadrature . . . 106 95 Lab-Lab DOE at 1 kHz, Voltage Ratio of 1/11, Quadrature . . . 106 96 DOE to the KCRV at 55 Hz, Voltage Ratio of 0.9, In-Phase . . . 108 97 Lab-Lab DOE at 55 Hz, Voltage Ratio of 0.9, In-Phase . . . 108 98 DOE to the KCRV at 55 Hz, Voltage Ratio of 0.9, Quadrature . . . . 110 99 Lab-Lab DOE at 55 Hz, Voltage Ratio of 0.9, Quadrature . . . 110 100 DOE to the KCRV at 55 Hz, Voltage Ratio of 0.8, In-Phase . . . 112 101 Lab-Lab DOE at 55 Hz, Voltage Ratio of 0.8, In-Phase . . . 112 102 DOE to the KCRV at 55 Hz, Voltage Ratio of 0.8, Quadrature . . . . 114 103 Lab-Lab DOE at 55 Hz, Voltage Ratio of 0.8, Quadrature . . . 114 104 DOE to the KCRV at 55 Hz, Voltage Ratio of 0.7, In-Phase . . . 116 105 Lab-Lab DOE at 55 Hz, Voltage Ratio of 0.7, In-Phase . . . 116 106 DOE to the KCRV at 55 Hz, Voltage Ratio of 0.7, Quadrature . . . . 118 107 Lab-Lab DOE at 55 Hz, Voltage Ratio of 0.7, Quadrature . . . 118 108 DOE to the KCRV at 55 Hz, Voltage Ratio of 0.6, In-Phase . . . 120 109 Lab-Lab DOE at 55 Hz, Voltage Ratio of 0.6, In-Phase . . . 120 110 DOE to the KCRV at 55 Hz, Voltage Ratio of 0.6, Quadrature . . . . 122 111 Lab-Lab DOE at 55 Hz, Voltage Ratio of 0.6, Quadrature . . . 122 112 DOE to the KCRV at 55 Hz, Voltage Ratio of 0.5, In-Phase . . . 124 113 Lab-Lab DOE at 55 Hz, Voltage Ratio of 0.5, In-Phase . . . 124 114 DOE to the KCRV at 55 Hz, Voltage Ratio of 0.5, Quadrature . . . . 126 115 Lab-Lab DOE at 55 Hz, Voltage Ratio of 0.5, Quadrature . . . 126 116 DOE to the KCRV at 55 Hz, Voltage Ratio of 0.4, In-Phase . . . 128 117 Lab-Lab DOE at 55 Hz, Voltage Ratio of 0.4, In-Phase . . . 128 118 DOE to the KCRV at 55 Hz, Voltage Ratio of 0.4, Quadrature . . . . 130 119 Lab-Lab DOE at 55 Hz, Voltage Ratio of 0.4, Quadrature . . . 130 120 DOE to the KCRV at 55 Hz, Voltage Ratio of 0.3, In-Phase . . . 132 121 Lab-Lab DOE at 55 Hz, Voltage Ratio of 0.3, In-Phase . . . 132 122 DOE to the KCRV at 55 Hz, Voltage Ratio of 0.3, Quadrature . . . . 134
123 Lab-Lab DOE at 55 Hz, Voltage Ratio of 0.3, Quadrature . . . 134 124 DOE to the KCRV at 55 Hz, Voltage Ratio of 0.2, In-Phase . . . 136 125 Lab-Lab DOE at 55 Hz, Voltage Ratio of 0.2, In-Phase . . . 136 126 DOE to the KCRV at 55 Hz, Voltage Ratio of 0.2, Quadrature . . . . 138 127 Lab-Lab DOE at 55 Hz, Voltage Ratio of 0.2, Quadrature . . . 138 128 DOE to the KCRV at 55 Hz, Voltage Ratio of 0.1, In-Phase . . . 140 129 Lab-Lab DOE at 55 Hz, Voltage Ratio of 0.1, In-Phase . . . 140 130 DOE to the KCRV at 55 Hz, Voltage Ratio of 0.1, Quadrature . . . . 142 131 Lab-Lab DOE at 55 Hz, Voltage Ratio of 0.1, Quadrature . . . 142 132 DOE to the KCRV at 55 Hz, Voltage Ratio of 0.01, In-Phase . . . 144 133 Lab-Lab DOE at 55 Hz, Voltage Ratio of 0.01, In-Phase . . . 144 134 DOE to the KCRV at 55 Hz, Voltage Ratio of 0.01, Quadrature . . . . 146 135 Lab-Lab DOE at 55 Hz, Voltage Ratio of 0.01, Quadrature . . . 146 136 DOE to the KCRV at 55 Hz, Voltage Ratio of 10/11, In-Phase . . . . 148 137 Lab-Lab DOE at 55 Hz, Voltage Ratio of 10/11, In-Phase . . . 148 138 DOE to the KCRV at 55 Hz, Voltage Ratio of 10/11, Quadrature . . . 150 139 Lab-Lab DOE at 55 Hz, Voltage Ratio of 10/11, Quadrature . . . 150 140 DOE to the KCRV at 55 Hz, Voltage Ratio of 9/11, In-Phase . . . 152 141 Lab-Lab DOE at 55 Hz, Voltage Ratio of 9/11, In-Phase . . . 152 142 DOE to the KCRV at 55 Hz, Voltage Ratio of 9/11, Quadrature . . . 154 143 Lab-Lab DOE at 55 Hz, Voltage Ratio of 9/11, Quadrature . . . 154 144 DOE to the KCRV at 55 Hz, Voltage Ratio of 8/11, In-Phase . . . 156 145 Lab-Lab DOE at 55 Hz, Voltage Ratio of 8/11, In-Phase . . . 156 146 DOE to the KCRV at 55 Hz, Voltage Ratio of 8/11, Quadrature . . . 158 147 Lab-Lab DOE at 55 Hz, Voltage Ratio of 8/11, Quadrature . . . 158 148 DOE to the KCRV at 55 Hz, Voltage Ratio of 7/11, In-Phase . . . 160 149 Lab-Lab DOE at 55 Hz, Voltage Ratio of 7/11, In-Phase . . . 160 150 DOE to the KCRV at 55 Hz, Voltage Ratio of 7/11, Quadrature . . . 162 151 Lab-Lab DOE at 55 Hz, Voltage Ratio of 7/11, Quadrature . . . 162 152 DOE to the KCRV at 55 Hz, Voltage Ratio of 6/11, In-Phase . . . 164 153 Lab-Lab DOE at 55 Hz, Voltage Ratio of 6/11, In-Phase . . . 164 154 DOE to the KCRV at 55 Hz, Voltage Ratio of 6/11, Quadrature . . . 166 155 Lab-Lab DOE at 55 Hz, Voltage Ratio of 6/11, Quadrature . . . 166 156 DOE to the KCRV at 55 Hz, Voltage Ratio of 5/11, In-Phase . . . 168 157 Lab-Lab DOE at 55 Hz, Voltage Ratio of 5/11, In-Phase . . . 168 158 DOE to the KCRV at 55 Hz, Voltage Ratio of 5/11, Quadrature . . . 170 159 Lab-Lab DOE at 55 Hz, Voltage Ratio of 5/11, Quadrature . . . 170 160 DOE to the KCRV at 55 Hz, Voltage Ratio of 4/11, In-Phase . . . 172 161 Lab-Lab DOE at 55 Hz, Voltage Ratio of 4/11, In-Phase . . . 172 162 DOE to the KCRV at 55 Hz, Voltage Ratio of 4/11, Quadrature . . . 174 163 Lab-Lab DOE at 55 Hz, Voltage Ratio of 4/11, Quadrature . . . 174
164 DOE to the KCRV at 55 Hz, Voltage Ratio of 3/11, In-Phase . . . 176
165 Lab-Lab DOE at 55 Hz, Voltage Ratio of 3/11, In-Phase . . . 176
166 DOE to the KCRV at 55 Hz, Voltage Ratio of 3/11, Quadrature . . . 178
167 Lab-Lab DOE at 55 Hz, Voltage Ratio of 3/11, Quadrature . . . 178
168 DOE to the KCRV at 55 Hz, Voltage Ratio of 2/11, In-Phase . . . 180
169 Lab-Lab DOE at 55 Hz, Voltage Ratio of 2/11, In-Phase . . . 180
170 DOE to the KCRV at 55 Hz, Voltage Ratio of 2/11, Quadrature . . . 182
171 Lab-Lab DOE at 55 Hz, Voltage Ratio of 2/11, Quadrature . . . 182
172 DOE to the KCRV at 55 Hz, Voltage Ratio of 1/11, In-Phase . . . 184
173 Lab-Lab DOE at 55 Hz, Voltage Ratio of 1/11, In-Phase . . . 184
174 DOE to the KCRV at 55 Hz, Voltage Ratio of 1/11, Quadrature . . . 186
175 Lab-Lab DOE at 55 Hz, Voltage Ratio of 1/11, Quadrature . . . 186
176 Contents of the raw data file from NMIJ . . . 189
177 Contents of the raw data file from CEM . . . 190
178 Contents of the raw data file from NMIA - Part 1 . . . 191
179 Contents of the raw data file from NMIA - Part 2 . . . 192
180 Contents of the raw data file from IEN . . . 193
181 Contents of the raw data file from KRISS . . . 194
182 Contents of the raw data file from LCIE . . . 195
183 Contents of the raw data file from METAS - Part 1 . . . 196
184 Contents of the raw data file from METAS - Part 2 . . . 197
185 Contents of the raw data file from NIM - Part 1 . . . 198
186 Contents of the raw data file from NIM - Part 2 . . . 199
187 Contents of the raw data file from NIST . . . 200
188 Contents of the raw data file from NPL - Part 1 . . . 201
189 Contents of the raw data file from NPL - Part 2 . . . 202
190 Contents of the raw data file from NPLI - Part 1 . . . 203
191 Contents of the raw data file from NPLI - Part 2 . . . 204
192 Contents of the raw data file from NRC . . . 205
193 Contents of the raw data file from PTB - Part 1 . . . 206
194 Contents of the raw data file from PTB - Part 2 . . . 207
195 Contents of the raw data file from SP . . . 208
196 Contents of the raw data file from UME . . . 209
197 Contents of the raw data file from VNIIM . . . 210
198 Contents of the raw data file from VSL - Part 1 . . . 211
1
Analysis
1.1
Measurements
Measurements were made of 20 ac voltage ratios at two possible frequencies: 1 kHz and 55 Hz. The In-Phase and Quadrature components of each voltage ratio were reported separately giving a total of 80 possible measurement results for each par-ticipant. The 1 kHz measurements were compulsory and all the 17 participating laboratories made these measurements. The 55 Hz measurements were optional, with 7 Laboratories contributing. Each participant submitted a text file containing the results of the measurements in an agreed format. The data from these files is shown in the tables in section 4. The text files were processed by a series of programs re-sulting in the production of Part 2 of the comparison report. The programs extracted the appropriate measurement data from the files provided by each laboratory and produced 80 measurement files, each corresponding to a particular frequency, ratio and phase; these were then analysed separately using the method recommended in [1]. Expanded uncertainties (k = 2) are used throughout the document unless stated in the text.
1.2
Transport Uncertainty
The comparison was organised in form known as a “star-shape” where the travelling standard returned to the pilot laboratory (NPL) between the measurements made by the participants. Measurements of the travelling standard at 1 kHz were made at each time that it was returned to NPL and these measurements were used to make an estimate of the uncertainty associated with its transport between laboratories. The travelling standard was constructed to remain stable with time [3] and tests, made before the start of the comparison, confirmed that, whilst in its packing container, it was immune to moderate mishandling.
The combined standard uncertainty of the NPL measurements is much higher than the expected transport uncertainty of the standard but, as the NPL reference dividers were not disturbed during the comparison, the type B uncertainties associated with the system can be assumed to be constant and the type A uncertainties can be reduced by combining the measurements of a number of ratios of the standard. Under these circumstances no attempt has been made to assess the drift of the travelling standard.
The uncertainties were derived by first calculating the mean value of the time series for each component of each ratio and subtracting the calculated means from the values in the appropriate time series. This eliminates the individual values of the ratios allowing them to be combined to reduce the uncertainty component due to the measurement of an individual ratio. The resulting values are given in Tables 1 to 4 and plotted in Figures 1 to 4. The mean of each set of ratios, measured at a specific time, was taken and the standard deviation of these mean values was taken as the transport uncertainty. The standard uncertainties due to transport are given in the table below. The in-phase and quadrature values shown for the decimal and elevenths rations are consistent and so, were further combined, to give the two transport standard uncertainties, shown in the row labelled “Combined”, which are used in the calculation of the KCRV for both the 1 kHz and 55 Hz results.
InPhase Quadrature Degrees of Freedom Decimal 5.8 × 10⁻⁹ 2.3 × 10⁻⁹ 15
Elevenths 7.5 × 10⁻⁹ 3.1 × 10⁻⁹ 12 Combined (ut) 6.4 ×10⁻⁹ 2.6 ×10⁻⁹ 28
The uncertainties used to calculate the KCRV and u(KCRV) are calculated by combining the expanded uncertainty Ui and k-value ki, provided by each laboratory, with the appropriate standard uncertainty due to transport u using a quadrature
1.3
Measurement Processing
A weighted mean of the results in each set of measurements was calculated using 1/u2 i as the weight, where ui is the augmented standard uncertainty of the measurement from laboratory i.
A χ2
test against the 95% quantile of the appropriate χ2
distribution revealed that the majority of the measurement sets contained data which was not consistent with the calculated mean. This situation was rectified by eliminating the result with the greatest contribution to the observed χ2
value from the subset of measurements used to determine the mean, this procedure was repeated until the χ2
test was sat-isfied and the corresponding mean was used as the Key Comparison Reference Value (KCRV). In general a consistent set could be generated with a modest reduction, on average 20%, in the degrees of freedom ν but, at the extremes, the smallest number of degrees of freedom remaining in the 1 kHz measurements was 9 out of a maximum of 16 and for the 55 Hz measurements this was 3 out of a maximum of 6. The results of this process are shown in Table 5 for 1 kHz and Table 6 for 55 Hz.
The column νishows the degrees of freedom associated with the weighted mean of all the participants.
The column χ2
i shows the initial value of χ 2
arising from the weighted mean of all the participants.
The column νr shows the degrees of freedom remaining after the elimination process.
The column χ2
r shows the value of χ 2
after the elimination process. The column χ2
lim shows the value of the 95% quantile of the χ 2
distribution with νr degrees of freedom.
The final column shows the results eliminated from the calculation of the mean, in order of elimination.
The effects of the elimination process on the calculated mean are tabulated and plotted in Tables 7-14 and in Figures 5-12. For clarity in the plots, a small horizontal offset has been applied to the values of the nominal ratio for points other than the reported Key Comparison Reference Values (KCRVs). The vertical span of all eight plots has been set to ±30 × 10−9to aid comparison. This choice of scale forces some points to lie off scale and are therefore not plotted, but appear in the associated tables. In each table:
The second column is numerically equal to the reported KCRV.
The third column represents the weighted mean with no eliminations minus the value in the second column.
The fourth column is the KCRV minus the value in the second column. The fifth column is the weighted mean, calculated by the further elimination of NMIA from the set used to calculate the KCRV, minus the value in the second column. NMIA is the laboratory reporting the smallest uncertainty in all the measurements and therefore has the greatest effect on the KCRV. This column shows the effect of removing it from the calculation of the KCRV.
The values from the last three columns are plotted in the graph above the table.
1.4
Largest Consistent Subset
The successive elimination procedure described above was checked using the tech-nique described in [2], to find the Largest Consistent Subset (LCS). The checks were made prior to the calculation of the transport uncertainties and so both techniques were applied using only the uncertainties supplied by the participants. In 75 of the 80 cases, the LCS technique produced an identical subset to the successive elimination procedure. The remaining 5 cases were due to the low uncertainty quoted by NMIA the elimination of which could give a large change in χ2
. The inclusion of the trans-port uncertainties have significantly decreased this effect and the existing successive elimination algorithm was used to generate the subset used to calculate the KCRV using the augmented uncertainties.
1.5
Measurements
The Degree of Equivalence (DOE) of each laboratory to the KCRV is shown in the graphs and tables following page 25. Solid (green) circles denote results that were included in the calculation of the KCRV while solid (blue) squares denote excluded results. For clarity, some results are shown off scale. It should be noted that these results can contribute to the KCRV (usually when the absolute value of the result and its associated uncertainty are similar). The raw data tables for each laboratory are included in section 4, after the measurement graphs and tables.
2
Acknowledgements
The authors would like to thank Professor Maurice Cox, who provided advice, cal-culated the Largest Consistent Subsets of the measurement data and carried out an ANOVA analysis to aid the calculation of the transport uncertainties.
References
[1] M. G. Cox. The evaluation of key comparison data. Metrologia, 39:589–595, 2002. [2] M. G. Cox. The evaluation of key comparison data: determining the largest
consistent subset. Metrologia, 44:187–200, 2007.
[3] J.R. Fiander and G.W. Small. An inductive voltage divider for international comparisons. In 2000 Conference on Precision Electromagnetic Measurements Digest, pages 224 –225, 2000.
-30 -20 -10 0 10 20 30
01 Jan 2001 01 Jan 2002 01 Jan 2003 01 Jan 2004
(Ratio - Mean) x 10
9
.
In-Phase Voltage Ratio (Decimal)
0.1 0.2 0.3 0.4 0.5 0.6 0.7 0.8 0.9
Figure 1: Decimal ratios - in-phase measurements at 1 kHz
Date 0.1 0.2 0.3 0.4 0.5 0.6 0.7 0.8 0.9 13/12/2000 −6.2 −11.9 −17.2 −20.5 −21.6 −22.4 −20.2 −18.2 −10.2 16/05/2001 3.8 11.1 18.8 19.5 21.4 23.6 21.8 17.8 12.8 16/05/2001 −2.2 −5.9 −7.2 −7.5 −7.6 −4.4 −2.2 1.8 0.8 01/06/2001 −2.2 −2.9 −7.2 −5.5 −4.6 −1.4 −0.2 1.8 1.8 12/07/2001 1.8 −4.9 3.8 0.5 −5.6 −16.4 −19.2 −20.2 −13.2 13/09/2001 0.8 3.1 3.8 5.5 5.4 4.6 3.8 1.8 0.8 16/01/2002 6.8 12.1 16.8 19.5 23.4 23.6 23.8 19.8 12.8 17/01/2002 5.8 12.1 14.8 17.5 20.4 20.6 19.8 15.8 10.8 11/03/2002 −2.2 −3.9 −9.2 −8.5 −10.6 −7.4 −10.2 −6.2 −7.2 14/04/2002 −0.2 1.1 0.8 2.5 4.4 7.6 9.8 10.8 8.8 05/07/2002 −3.2 −3.9 −5.2 −4.5 −1.6 0.6 1.8 1.8 1.8 08/07/2002 −5.2 −7.9 −10.2 −9.5 −8.6 −5.4 −3.2 −1.2 0.8 18/10/2002 −1.2 −2.9 −4.2 −5.5 −6.6 −7.4 −7.2 −7.2 −5.2 09/01/2003 6.8 12.1 14.8 15.5 15.4 11.6 7.8 2.8 −0.2 27/01/2003 −2.2 −4.9 −8.2 −11.5 −13.6 −15.4 −14.2 −12.2 −8.2 28/01/2003 −1.2 −2.9 −5.2 −7.5 −9.6 −11.4 −11.2 −9.2 −6.2
Table 1: Pilot Laboratory measurements In-Phase at 1 kHz
-20 -10 0 10 20
01 Jan 2001 01 Jan 2002 01 Jan 2003 01 Jan 2004
(Ratio - Mean) x 10
9
.
Quadrature Voltage Ratio (Decimal)
0.1 0.2 0.3 0.4 0.5 0.6 0.7 0.8 0.9
Figure 2: Decimal ratios - Quadrature measurements at 1 kHz
Date 0.1 0.2 0.3 0.4 0.5 0.6 0.7 0.8 0.9 13/12/2000 1.3 3.2 4.0 6.6 6.9 7.1 5.5 4.8 2.2 16/05/2001 −2.4 −1.8 −0.3 −0.7 −0.4 −0.6 0.8 −0.5 0.2 16/05/2001 0.7 1.4 2.0 3.7 3.1 4.0 3.5 5.3 2.1 01/06/2001 2.2 2.8 3.6 4.5 4.8 3.9 3.9 3.2 1.6 12/07/2001 −5.9 −7.8 −5.8 −4.7 −1.9 −3.6 −0.7 −1.5 1.7 13/09/2001 −4.3 −8.6 −13.0 −15.3 −16.9 −10.0 −8.5 −8.7 0.1 16/01/2002 0.6 0.2 −0.3 −2.7 −3.4 −5.6 −6.2 −5.5 −3.8 17/01/2002 −0.3 −1.6 −3.0 −5.3 −5.9 −6.0 −5.5 −4.7 −1.9 11/03/2002 0.1 0.2 −0.8 0.3 −0.9 −0.6 −1.7 −0.5 −2.3 14/04/2002 0.4 −0.2 −0.6 −0.8 −0.7 −1.5 −1.6 −0.8 −0.3 05/07/2002 0.3 0.6 −0.2 −0.9 −1.9 −2.4 −2.3 −1.9 −2.5 08/07/2002 0.8 0.2 −0.8 −1.7 −2.6 −3.3 −3.7 −3.5 −3.0 18/10/2002 −0.9 −1.2 −1.6 −1.5 −1.1 −0.8 −0.6 1.9 0.1 09/01/2003 1.6 2.2 2.7 3.3 4.6 4.4 3.8 1.5 1.2 27/01/2003 3.8 6.5 8.8 9.8 10.5 9.6 9.3 7.0 3.6 28/01/2003 2.3 4.1 5.0 5.1 5.3 4.8 4.4 3.3 1.0
-30 -20 -10 0 10 20 30
01 Jan 2001 01 Jan 2002 01 Jan 2003 01 Jan 2004
(Ratio - Mean) x 10
9
.
In-Phase Voltage Ratio (Elevenths)
1/11 2/11 3/11 4/11 5/11 6/11 7/11 8/11 9/11 10/11
Figure 3: Elevenths - in-phase measurements at 1 kHz
Date 1/11 2/11 3/11 4/11 5/11 6/11 7/11 8/11 9/11 10/11 14/12/2000 −8.7 −15.0 −21.5 −25.0 −29.3 −27.2 −27.0 −23.3 −19.0 −9.8 16/05/2001 1.2 0.1 −3.1 −6.0 −8.8 −9.1 −8.7 −6.4 −3.8 −0.4 01/06/2001 1.9 2.5 1.6 2.4 1.4 1.7 0.2 0.2 −1.6 −2.4 12/07/2001 0.9 2.6 3.1 7.9 9.9 11.2 11.4 8.4 5.7 0.9 14/09/2001 4.1 5.9 7.6 8.6 7.8 7.3 5.7 4.9 3.4 2.7 16/01/2002 6.4 13.7 19.7 22.0 24.6 24.5 24.3 22.8 18.6 13.4 11/03/2002 −1.7 −2.7 −0.8 −2.7 −2.3 −4.6 −5.0 −7.7 −6.0 −9.5 14/04/2002 3.2 4.8 6.2 6.3 6.2 5.2 5.3 4.6 5.2 4.6 08/07/2002 −4.1 −6.5 −8.0 −10.3 −10.3 −11.6 −10.4 −7.8 −4.6 −0.1 18/10/2002 −1.4 −3.4 −4.3 −4.1 −4.8 −4.8 −4.6 −4.2 −3.3 −2.1 09/01/2003 3.0 6.8 9.3 12.2 14.3 15.8 16.1 15.2 11.5 6.8 27/01/2003 −3.1 −5.1 −5.7 −6.4 −5.5 −5.1 −4.8 −4.6 −3.9 −2.9 28/01/2003 −2.3 −4.2 −4.4 −4.6 −3.3 −2.9 −2.1 −1.9 −1.6 −1.7
Table 3: Pilot Laboratory measurements In-Phase at 1 kHz
-20 -10 0 10 20
01 Jan 2001 01 Jan 2002 01 Jan 2003 01 Jan 2004
(Ratio - Mean) x 10
9
.
Quadrature Voltage Ratio (Elevenths)
1/11 2/11 3/11 4/11 5/11 6/11 7/11 8/11 9/11 10/11
Figure 4: Elevenths - Quadrature measurements at 1 kHz
Date 1/11 2/11 3/11 4/11 5/11 6/11 7/11 8/11 9/11 10/11 14/12/2000 2.0 6.2 8.2 8.9 9.2 9.1 6.9 5.9 2.9 1.3 16/05/2001 0.7 2.3 2.4 2.1 1.2 1.8 2.4 1.7 2.1 1.6 01/06/2001 0.1 −1.7 −1.5 −1.4 −1.0 −1.7 −1.4 −0.7 0.7 1.9 12/07/2001 −10.0 −10.2 −7.8 −7.8 −2.5 −4.5 −2.7 0.9 2.6 7.3 14/09/2001 −2.8 −5.8 −8.2 −10.0 −10.5 −10.5 −9.5 −6.7 −5.8 2.1 16/01/2002 1.2 0.2 −2.2 −2.0 −3.5 −3.5 −3.5 −4.7 −4.8 −5.9 11/03/2002 0.9 −1.4 −1.0 −1.1 −0.9 −1.1 −2.4 −3.9 −3.2 −5.6 14/04/2002 0.4 −0.3 −1.5 −2.1 −3.3 −3.3 −3.4 −3.4 −2.6 −2.1 08/07/2002 2.6 2.3 0.6 −0.8 −2.6 −2.4 −2.7 −3.2 −2.9 −4.0 18/10/2002 −1.6 −3.0 −3.8 −3.7 −3.0 −2.0 −0.8 0.3 0.4 0.2 09/01/2003 0.3 1.4 2.0 2.3 1.9 1.1 1.2 1.1 1.0 −0.0 27/01/2003 3.1 4.9 6.2 7.4 7.7 8.1 8.1 6.9 5.3 1.8 28/01/2003 3.1 5.5 7.1 8.2 7.9 8.4 8.1 6.3 4.6 1.5
Ratio Phase νi χ 2 i νr χ 2 r χ 2
lim Results excluded
0.9 In-Phase 16 51 15 15 25 LCIE
0.9 Quadrature 16 385683 14 15 24 LCIE, NPLI
0.8 In-Phase 16 91 15 19 25 LCIE
0.8 Quadrature 16 659655 13 20 22 LCIE, NPLI, VSL
0.7 In-Phase 16 111 14 17 24 LCIE, NPLI
0.7 Quadrature 16 431565 11 19 20 LCIE, NPLI, VSL, NRC, IEN
0.6 In-Phase 16 117 14 14 24 LCIE, NPLI
0.6 Quadrature 16 184726 11 16 20 LCIE, NPLI, NRC, VSL, PTB
0.5 In-Phase 16 44 15 24 25 NPLI
0.5 Quadrature 16 35935 10 12 18 LCIE, NPLI, NRC, VSL, NIM, PTB
0.4 In-Phase 16 38 15 20 25 NPLI
0.4 Quadrature 16 18128 11 15 20 LCIE, NPLI, NIM, VSL, NRC
0.3 In-Phase 16 76 15 19 25 LCIE
0.3 Quadrature 16 199390 11 17 20 LCIE, NPLI, NIM, VSL, NRC
0.2 In-Phase 16 43 15 11 25 LCIE
0.2 Quadrature 16 444141 13 18 22 LCIE, NPLI, NIM
0.1 In-Phase 16 6 16 6 26
0.1 Quadrature 16 347518 14 11 24 LCIE, NPLI
0.01 In-Phase 16 76713 11 17 20 LCIE, NRC, NPLI, VSL, KRISS 0.01 Quadrature 16 9213 10 12 18 LCIE, NRC, UME, NPLI, NIM, IEN
10/11 In-Phase 16 57 15 16 25 LCIE
10/11 Quadrature 16 1031 14 12 24 LCIE, NPLI
9/11 In-Phase 16 214 15 10 25 LCIE
9/11 Quadrature 16 2387 13 19 22 LCIE, NPLI, NRC
8/11 In-Phase 16 275 15 7 25 LCIE
8/11 Quadrature 16 2914 11 17 20 LCIE, NPLI, NRC, VSL, PTB
7/11 In-Phase 16 231 15 15 25 LCIE
7/11 Quadrature 16 2781 10 17 18 NPLI, LCIE, VSL, NRC, PTB, IEN
6/11 In-Phase 16 96 15 13 25 LCIE
6/11 Quadrature 16 2350 10 16 18 NPLI, LCIE, VSL, NRC, PTB, KRISS
5/11 In-Phase 16 16 16 16 26
5/11 Quadrature 16 1645 9 12 17 NPLI, LCIE, VSL, NRC, PTB, NIM, KRISS
4/11 In-Phase 16 54 15 14 25 LCIE
4/11 Quadrature 16 1166 12 19 21 NPLI, VSL, NRC, LCIE
3/11 In-Phase 16 159 15 13 25 LCIE
3/11 Quadrature 16 1041 13 21 22 NPLI, LCIE, VSL
2/11 In-Phase 16 98 15 12 25 LCIE
2/11 Quadrature 16 779 13 20 22 LCIE, NPLI, NIM
1/11 In-Phase 16 18 16 18 26
1/11 Quadrature 16 75775 14 12 24 LCIE, NPLI
Table 5: Evaluation of consistent subsets for measurements at 1 kHz
Ratio Phase νi χ 2 i νr χ 2 r χ 2
lim Results excluded
0.9 In-Phase 6 13 5 3 11 NIM 0.9 Quadrature 6 2704 5 1 11 NPLI 0.8 In-Phase 6 21 5 2 11 NIM 0.8 Quadrature 6 8470 5 6 11 NPLI 0.7 In-Phase 6 12 6 12 13 0.7 Quadrature 6 14151 5 9 11 NPLI 0.6 In-Phase 6 17 5 7 11 NIM
0.6 Quadrature 6 17275 4 2 9 NPLI, NIM
0.5 In-Phase 6 19 5 4 11 NIM
0.5 Quadrature 6 17417 5 3 11 NPLI
0.4 In-Phase 6 9 6 9 13
0.4 Quadrature 6 13948 5 8 11 NPLI
0.3 In-Phase 6 25 5 6 11 NIM
0.3 Quadrature 6 9534 4 2 9 NPLI, NIM
0.2 In-Phase 6 19 5 4 11 NIM
0.2 Quadrature 6 5063 4 2 9 NPLI, NIM
0.1 In-Phase 6 12 6 12 13
0.1 Quadrature 6 1388 4 1 9 NPLI, NIM
0.01 In-Phase 6 11111 4 4 9 NPLI, NIM
0.01 Quadrature 6 33215 3 8 8 NIM, PTB, NPLI
10/11 In-Phase 6 127 4 0 9 NIM, NPLI
10/11 Quadrature 6 21 5 2 11 NIM
9/11 In-Phase 6 49 4 0 9 NPLI, NIM
9/11 Quadrature 6 8 6 8 13 8/11 In-Phase 6 40 5 6 11 NPLI 8/11 Quadrature 6 9 6 9 13 7/11 In-Phase 6 20 5 5 11 NPLI 7/11 Quadrature 6 11 6 11 13 6/11 In-Phase 6 6 6 6 13 6/11 Quadrature 6 15 5 4 11 NPLI 5/11 In-Phase 6 8 6 8 13 5/11 Quadrature 6 10 6 10 13 4/11 In-Phase 6 20 5 8 11 NIM
4/11 Quadrature 6 92 4 6 9 NIM, NPLI
3/11 In-Phase 6 16 5 6 11 NPLI
3/11 Quadrature 6 86 4 6 9 NIM, NPLI
2/11 In-Phase 6 77 4 2 9 NIM, NPLI
2/11 Quadrature 6 124 4 8 9 NIM, NPLI
1/11 In-Phase 6 55 4 2 9 NPLI, NIM
1/11 Quadrature 6 157 4 6 9 NIM, NPLI
-30 -20 -10 0 10 20 30 0.01 0.1 0.2 0.3 0.4 0.5 0.6 0.7 0.8 0.9 (Weighted Mean - KCRV) x 10 9 . Nominal Ratio
1 kHz, In-Phase Voltage Ratio (Decimal)
KCRV All Participants KCRV Participants without NMIA
Figure 5: Decimal ratios - in-phase measurements at 1 kHz
Result - KCRV
Ratio KCRV All Participants KCRV KCRV without NMIA
0.9 58.3 2.6 ± 5.0 0.0 ± 5.1 0 ± 6 0.8 71.5 3.7 ± 5.2 0.0 ± 5.3 1 ± 6 0.7 64.0 7.2 ± 5.3 0.0 ± 5.8 0 ± 7 0.6 39.0 7.9 ± 5.2 0.0 ± 5.7 −0 ± 6 0.5 9.8 4.5 ± 5.0 0.0 ± 5.4 −0 ± 6 0.4 −22.9 4.3 ± 5.1 0.0 ± 5.4 −1 ± 6 0.3 −38.6 −2.8 ± 5.1 0.0 ± 5.1 −0 ± 6 0.2 −45.9 −2.3 ± 5.0 0.0 ± 5.1 −0 ± 6 0.1 −43.6 0.0 ± 4.8 0.0 ± 4.8 0 ± 5 0.01 −1160.5 340.6 ± 6.2 0.0 ± 8.4 −2 ± 11
Table 7: In-Phase measurements at 1 kHz (Decimal)
-30 -20 -10 0 10 20 30 0.01 0.1 0.2 0.3 0.4 0.5 0.6 0.7 0.8 0.9 (Weighted Mean - KCRV) x 10 9 . Nominal Ratio
1 kHz, Quadrature Voltage Ratio (Decimal)
KCRV All Participants KCRV Participants without NMIA
Figure 6: Decimal ratios - quadrature measurements at 1 kHz
Result - KCRV
Ratio KCRV All Participants KCRV KCRV without NMIA
0.9 −71.6 −174.1 ± 3.8 0.0 ± 3.9 −3 ± 6 0.8 −110.2 −233.6 ± 4.1 0.0 ± 4.1 −5 ± 7 0.7 −137.0 −177.8 ± 4.2 0.0 ± 4.5 −13 ± 9 0.6 −132.5 −114.1 ± 4.3 0.0 ± 4.4 −4 ± 8 0.5 −130.3 −49.8 ± 4.2 0.0 ± 4.5 −1 ± 9 0.4 −97.0 24.1 ± 4.1 0.0 ± 4.4 −5 ± 8 0.3 −51.0 92.7 ± 3.9 0.0 ± 4.3 −0 ± 8 0.2 −15.4 157.6 ± 3.8 0.0 ± 4.1 −1 ± 7 0.1 8.9 134.3 ± 3.5 0.0 ± 3.5 −3 ± 5 0.01 422.5 44.4 ± 4.1 0.0 ± 5.0 −6 ± 17
-30 -20 -10 0 10 20 30 1/11 2/11 3/11 4/11 5/11 6/11 7/11 8/11 9/11 10/11 (Weighted Mean - KCRV) x 10 9 . Nominal Ratio
1 kHz, In-Phase Voltage Ratio (Elevenths)
KCRV All Participants KCRV Participants without NMIA
Figure 7: Elevenths - in-phase measurements at 1 kHz
Result - KCRV
Ratio KCRV All Participants KCRV KCRV without NMIA
10/11 53.2 2.5 ± 5.1 0.0 ± 5.1 0 ± 6 9/11 21.8 5.3 ± 5.2 0.0 ± 5.2 −0 ± 6 8/11 9.4 5.8 ± 5.3 0.0 ± 5.3 −0 ± 6 7/11 −6.2 5.0 ± 5.3 0.0 ± 5.3 0 ± 6 6/11 −17.1 3.1 ± 5.3 0.0 ± 5.3 0 ± 6 5/11 −2.2 0.0 ± 5.4 0.0 ± 5.4 1 ± 6 4/11 −31.1 −2.2 ± 5.3 0.0 ± 5.4 1 ± 6 3/11 −24.5 −4.2 ± 5.2 0.0 ± 5.3 1 ± 6 2/11 −46.2 −3.3 ± 5.1 0.0 ± 5.1 0 ± 6 1/11 −49.7 0.0 ± 5.0 0.0 ± 5.0 0 ± 5
Table 9: In-Phase measurements at 1 kHz (Elevenths)
-30 -20 -10 0 10 20 30 1/11 2/11 3/11 4/11 5/11 6/11 7/11 8/11 9/11 10/11 (Weighted Mean - KCRV) x 10 9 . Nominal Ratio
1 kHz, Quadrature Voltage Ratio (Elevenths)
KCRV All Participants KCRV Participants without NMIA
Figure 8: Elevenths - quadrature measurements at 1 kHz
Result - KCRV
Ratio KCRV All Participants KCRV KCRV without NMIA
10/11 −123.5 −0.5 ± 3.9 0.0 ± 3.9 −3 ± 6 9/11 −176.9 −1.6 ± 4.1 0.0 ± 4.1 −3 ± 7 8/11 −200.9 −3.0 ± 3.9 0.0 ± 4.0 2 ± 6 7/11 −186.6 −5.4 ± 4.2 0.0 ± 4.5 −4 ± 9 6/11 −156.5 −4.5 ± 4.1 0.0 ± 4.3 −1 ± 8 5/11 −124.9 −5.6 ± 4.3 0.0 ± 4.6 −3 ± 10 4/11 −46.8 −1.5 ± 4.2 0.0 ± 4.3 −6 ± 7 3/11 −1.6 −0.4 ± 4.1 0.0 ± 4.1 −6 ± 7 2/11 48.9 −2.3 ± 3.9 0.0 ± 4.1 −2 ± 7 1/11 59.6 52.5 ± 3.7 0.0 ± 3.7 −2 ± 5
-30 -20 -10 0 10 20 30 0.01 0.1 0.2 0.3 0.4 0.5 0.6 0.7 0.8 0.9 (Weighted Mean - KCRV) x 10 9 . Nominal Ratio
55 Hz, In-Phase Voltage Ratio (Decimal)
KCRV All Participants KCRV Participants without NMIA
Figure 9: Decimal ratios - in-phase measurements at 55 Hz
Result - KCRV
Ratio KCRV All Participants KCRV KCRV without NMIA
0.9 −45.1 −8.2 ± 8.9 0.0 ± 10.3 −8 ± 18 0.8 −96.4 −9.1 ± 9.5 0.0 ± 10.4 −1 ± 18 0.7 −99.0 0.0 ± 9.8 0.0 ± 9.8 −7 ± 15 0.6 −121.3 −4.3 ± 10.0 0.0 ± 10.3 1 ± 17 0.5 −108.5 −6.5 ± 9.8 0.0 ± 10.4 −1 ± 18 0.4 −155.1 0.0 ± 9.7 0.0 ± 9.7 −5 ± 15 0.3 −164.3 −10.1 ± 9.2 0.0 ± 10.3 1 ± 17 0.2 −147.1 −8.9 ± 9.2 0.0 ± 10.3 2 ± 17 0.1 −131.2 0.0 ± 9.2 0.0 ± 9.2 −5 ± 13 0.01 −3814.6 63.1 ± 10.5 0.0 ± 12.6 −12 ± 59
Table 11: In-Phase measurements at 55 Hz (Decimal)
-30 -20 -10 0 10 20 30 0.01 0.1 0.2 0.3 0.4 0.5 0.6 0.7 0.8 0.9 (Weighted Mean - KCRV) x 10 9 . Nominal Ratio
55 Hz, Quadrature Voltage Ratio (Decimal)
KCRV All Participants KCRV Participants without NMIA
Figure 10: Decimal ratios - quadrature measurements at 55 Hz
Result - KCRV
Ratio KCRV All Participants KCRV KCRV without NMIA
0.9 120.9 −2.0 ± 4.8 0.0 ± 4.8 −0 ± 13 0.8 214.3 −3.6 ± 4.8 0.0 ± 4.8 −4 ± 13 0.7 212.8 −4.6 ± 4.8 0.0 ± 4.8 −7 ± 13 0.6 235.9 −10.1 ± 4.7 0.0 ± 5.1 13 ± 19 0.5 200.2 −5.4 ± 4.9 0.0 ± 4.9 2 ± 15 0.4 165.7 −4.8 ± 4.9 0.0 ± 4.9 −2 ± 15 0.3 176.9 −6.5 ± 4.9 0.0 ± 5.0 13 ± 19 0.2 153.8 −7.9 ± 4.7 0.0 ± 5.0 11 ± 19 0.1 128.8 −5.1 ± 4.8 0.0 ± 5.0 11 ± 19 0.01 3848.8 −912.5 ± 12.8 0.0 ± 16.3 −57 ±113
-30 -20 -10 0 10 20 30 1/11 2/11 3/11 4/11 5/11 6/11 7/11 8/11 9/11 10/11 (Weighted Mean - KCRV) x 10 9 . Nominal Ratio
55 Hz, In-Phase Voltage Ratio (Elevenths)
KCRV All Participants KCRV Participants without NMIA
Figure 11: Elevenths - in-phase measurements at 55 Hz
Result - KCRV
Ratio KCRV All Participants KCRV KCRV without NMIA
10/11 129.4 21.5 ± 8.6 0.0 ± 10.8 1 ± 20 9/11 18.4 0.9 ± 10.0 0.0 ± 11.0 −1 ± 20 8/11 −9.2 −5.9 ± 10.1 0.0 ± 10.4 7 ± 17 7/11 −96.1 −4.0 ± 10.1 0.0 ± 10.3 5 ± 17 6/11 −150.5 0.0 ± 10.3 0.0 ± 10.3 −7 ± 17 5/11 −122.8 0.0 ± 10.0 0.0 ± 10.0 1 ± 16 4/11 −258.7 −7.4 ± 9.7 0.0 ± 10.7 −0 ± 19 3/11 −253.7 2.9 ± 9.7 0.0 ± 9.9 −12 ± 15 2/11 −299.0 −11.4 ± 9.4 0.0 ± 10.9 −10 ± 20 1/11 −259.4 −7.2 ± 9.4 0.0 ± 10.8 −8 ± 20
Table 13: In-Phase measurements at 55 Hz (Elevenths)
-30 -20 -10 0 10 20 30 1/11 2/11 3/11 4/11 5/11 6/11 7/11 8/11 9/11 10/11 (Weighted Mean - KCRV) x 10 9 . Nominal Ratio
55 Hz, Quadrature Voltage Ratio (Elevenths)
KCRV All Participants KCRV Participants without NMIA
Figure 12: Elevenths - quadrature measurements at 55 Hz
Result - KCRV
Ratio KCRV All Participants KCRV KCRV without NMIA
10/11 −145.7 1.9 ± 5.0 0.0 ± 5.1 −9 ± 19 9/11 −30.4 0.0 ± 5.2 0.0 ± 5.2 6 ± 17 8/11 −5.1 0.0 ± 5.4 0.0 ± 5.4 9 ± 18 7/11 96.2 0.0 ± 5.6 0.0 ± 5.6 10 ± 17 6/11 158.2 0.1 ± 5.6 0.0 ± 5.6 8 ± 16 5/11 150.8 0.0 ± 5.7 0.0 ± 5.7 12 ± 16 4/11 327.9 −7.0 ± 6.5 0.0 ± 6.7 21 ± 19 3/11 322.3 −5.4 ± 5.8 0.0 ± 6.0 22 ± 19 2/11 380.1 −4.1 ± 5.3 0.0 ± 5.4 24 ± 19 1/11 323.6 −6.0 ± 5.0 0.0 ± 5.1 20 ± 19
Results
3
Results
The Key Comparison Reference Values (KCRVs) for the comparison are tabulated below. The following pages contain tables and graphs for each KCRV. The tables show the degree of equivalence for each laboratory and the degree of equivalence between laboratories. The graphs show the degree of equivalence for each laboratory. All uncertainties are given as expanded uncertainties (k = 2).
Nominal Ratio Frequency In-Phase x 109
Quadrature x 109 0.9 1 kHz 58.3 ± 5.1 −71.6 ± 3.9 0.8 1 kHz 71.5 ± 5.3 −110.2 ± 4.1 0.7 1 kHz 64.0 ± 5.8 −137.0 ± 4.5 0.6 1 kHz 39.0 ± 5.7 −132.5 ± 4.4 0.5 1 kHz 9.8 ± 5.4 −130.3 ± 4.5 0.4 1 kHz −22.9 ± 5.4 −97.0 ± 4.4 0.3 1 kHz −38.6 ± 5.1 −51.0 ± 4.3 0.2 1 kHz −45.9 ± 5.1 −15.4 ± 4.1 0.1 1 kHz −43.6 ± 4.8 8.9 ± 3.5 0.01 1 kHz −1160.5 ± 8.4 422.5 ± 5.0 10/11 1 kHz 53.2 ± 5.1 −123.5 ± 3.9 9/11 1 kHz 21.8 ± 5.2 −176.9 ± 4.1 8/11 1 kHz 9.4 ± 5.3 −200.9 ± 4.0 7/11 1 kHz −6.2 ± 5.3 −186.6 ± 4.5 6/11 1 kHz −17.1 ± 5.3 −156.5 ± 4.3 5/11 1 kHz −2.2 ± 5.4 −124.9 ± 4.6 4/11 1 kHz −31.1 ± 5.4 −46.8 ± 4.3 3/11 1 kHz −24.5 ± 5.3 −1.6 ± 4.1 2/11 1 kHz −46.2 ± 5.1 48.9 ± 4.1 1/11 1 kHz −49.7 ± 5.0 59.6 ± 3.7 0.9 55 Hz −45.1 ±10.3 120.9 ± 4.8 0.8 55 Hz −96.4 ±10.4 214.3 ± 4.8 0.7 55 Hz −99.0 ± 9.8 212.8 ± 4.8 0.6 55 Hz −121.3 ±10.3 235.9 ± 5.1 0.5 55 Hz −108.5 ±10.4 200.2 ± 4.9 0.4 55 Hz −155.1 ± 9.7 165.7 ± 4.9 0.3 55 Hz −164.3 ±10.3 176.9 ± 5.0 0.2 55 Hz −147.1 ±10.3 153.8 ± 5.0 0.1 55 Hz −131.2 ± 9.2 128.8 ± 5.0 0.01 55 Hz −3814.6 ±12.6 3848.8 ± 16.3 10/11 55 Hz 129.4 ±10.8 −145.7 ± 5.1 9/11 55 Hz 18.4 ±11.0 −30.4 ± 5.2 8/11 55 Hz −9.2 ±10.4 −5.1 ± 5.4 7/11 55 Hz −96.1 ±10.3 96.2 ± 5.6 6/11 55 Hz −150.5 ±10.3 158.2 ± 5.6 5/11 55 Hz −122.8 ±10.0 150.8 ± 5.7 4/11 55 Hz −258.7 ±10.7 327.9 ± 6.7 3/11 55 Hz −253.7 ± 9.9 322.3 ± 6.0 2/11 55 Hz −299.0 ±10.9 380.1 ± 5.4 1/11 55 Hz −259.4 ±10.8 323.6 ± 5.1
Table 16: Degree of equivalence to the KCRV for the Nominal Ratio 0.9 at 1 kHz, In-Phase Voltage Ratio (nV/V)
NMIJ CEM NMIA IEN KRISS LCIE METAS NIM
21 ± 14 −13 ± 51 −0
.3 ±11.7 6 ± 16 10 ± 20 88 ± 29 2 ± 28 −3 ± 12
NIST NPL NPLI NRC PTB SP UME VNIIM VSL
10 ± 44 1 ± 27 −12 ± 13 −9 ± 31 −7 ± 23 −4 ± 49 −13 ± 50 3 ± 21 −12 ± 21
Table 17: Laboratory - Laboratory degree of equivalence for the Nominal Ratio 0.9 at 1 kHz, In-Phase Voltage Ratio (nV/V)
NMIJ CEM NMIA IEN KRISS LCIE METAS NIM
NMIJ 34 ± 54 21 ± 20 15 ± 23 11 ± 25 −67 ± 33 19 ± 32 24 ± 20 CEM −34 ± 54 −13 ± 53 −19 ± 54 −23 ± 56 −101 ± 59 −15 ± 59 −10 ± 53 NMIA −21 ± 20 13 ± 53 −6 ± 21 −10 ± 24 −88 ± 32 −2 ± 31 3 ± 19 IEN −15 ± 23 19 ± 54 6 ± 21 −4 ± 27 −82 ± 34 4 ± 33 9 ± 22 KRISS −11 ± 25 23 ± 56 10 ± 24 4 ± 27 −78 ± 35 8 ± 35 13 ± 24 LCIE 67 ± 33 101 ± 59 88 ± 32 82 ± 34 78 ± 35 86 ± 41 91 ± 32 METAS −19 ± 32 15 ± 59 2 ± 31 −4 ± 33 −8 ± 35 −86 ± 41 5 ± 32 NIM −24 ± 20 10 ± 53 −3 ± 19 −9 ± 22 −13 ± 24 −91 ± 32 −5 ± 32 NIST −11 ± 46 23 ± 68 10 ± 46 4 ± 47 0 ± 48 −78 ± 53 8 ± 52 13 ± 46 NPL −20 ± 32 14 ± 59 1 ± 31 −5 ± 33 −9 ± 35 −87 ± 40 −1 ± 40 4 ± 31 NPLI −33 ± 20 1 ± 53 −12 ± 19 −18 ± 22 −22 ± 25 −100 ± 32 −14 ± 32 −9 ± 19 NRC −30 ± 35 4 ± 60 −9 ± 34 −15 ± 36 −19 ± 37 −97 ± 43 −11 ± 42 −6 ± 34 PTB −28 ± 28 6 ± 57 −7 ± 27 −13 ± 29 −17 ± 31 −95 ± 37 −9 ± 37 −4 ± 27 SP −25 ± 52 9 ± 72 −4 ± 51 −10 ± 53 −14 ± 54 −92 ± 58 −6 ± 57 −1 ± 51 UME −34 ± 52 0 ± 72 −13 ± 52 −19 ± 53 −23 ± 54 −101 ± 58 −15 ± 58 −10 ± 52 VNIIM −18 ± 27 16 ± 56 3 ± 26 −3 ± 28 −7 ± 30 −85 ± 36 1 ± 36 6 ± 26 VSL −33 ± 26 1 ± 56 −12 ± 25 −18 ± 27 −22 ± 30 −100 ± 36 −14 ± 36 −9 ± 25
NIST NPL NPLI NRC PTB SP UME VNIIM VSL
NMIJ 11 ± 46 20 ± 32 33 ± 20 30 ± 35 28 ± 28 25 ± 52 34 ± 52 18 ± 27 33 ± 26 CEM −23 ± 68 −14 ± 59 −1 ± 53 −4 ± 60 −6 ± 57 −9 ± 72 0 ± 72 −16 ± 56 −1 ± 56 NMIA −10 ± 46 −1 ± 31 12 ± 19 9 ± 34 7 ± 27 4 ± 51 13 ± 52 −3 ± 26 12 ± 25 IEN −4 ± 47 5 ± 33 18 ± 22 15 ± 36 13 ± 29 10 ± 53 19 ± 53 3 ± 28 18 ± 27 KRISS 0 ± 48 9 ± 35 22 ± 25 19 ± 37 17 ± 31 14 ± 54 23 ± 54 7 ± 30 22 ± 30 LCIE 78 ± 53 87 ± 40 100 ± 32 97 ± 43 95 ± 37 92 ± 58 101 ± 58 85 ± 36 100 ± 36 METAS −8 ± 52 1 ± 40 14 ± 32 11 ± 42 9 ± 37 6 ± 57 15 ± 58 −1 ± 36 14 ± 36 NIM −13 ± 46 −4 ± 31 9 ± 19 6 ± 34 4 ± 27 1 ± 51 10 ± 52 −6 ± 26 9 ± 25 NIST 9 ± 52 22 ± 46 19 ± 54 17 ± 50 14 ± 66 23 ± 67 7 ± 49 22 ± 49 NPL −9 ± 52 13 ± 31 10 ± 42 8 ± 37 5 ± 57 14 ± 57 −2 ± 35 13 ± 35 NPLI −22 ± 46 −13 ± 31 −3 ± 34 −5 ± 27 −8 ± 52 1 ± 52 −15 ± 26 0 ± 25 NRC −19 ± 54 −10 ± 42 3 ± 34 −2 ± 39 −5 ± 59 4 ± 59 −12 ± 38 3 ± 38 PTB −17 ± 50 −8 ± 37 5 ± 27 2 ± 39 −3 ± 55 6 ± 55 −10 ± 32 5 ± 32 SP −14 ± 66 −5 ± 57 8 ± 52 5 ± 59 3 ± 55 9 ± 70 −7 ± 54 8 ± 54 UME −23 ± 67 −14 ± 57 −1 ± 52 −4 ± 59 −6 ± 55 −9 ± 70 −16 ± 55 −1 ± 54 VNIIM −7 ± 49 2 ± 35 15 ± 26 12 ± 38 10 ± 32 7 ± 54 16 ± 55 15 ± 31 VSL −22 ± 49 −13 ± 35 0 ± 25 −3 ± 38 −5 ± 32 −8 ± 54 1 ± 54 −15 ± 31 2 8
-80
-60
-40
-20
0
20
40
60
80
-80
-60
-40
-20
0
20
40
60
80
NMIJ
CEM NMIA
IEN
KRISS LCIE METAS NIM
NIST
NPL
NPLI
NRC
PTB
SP
UME VNIIM VSL
(Measured Ratio - 0.9 - KCRV) x 10
9
.
Nominal Ratio: 0.9 at 1 kHz, In-Phase Voltage Ratio (KCRV
±
2
σ
) is ( 58.3
±
5.1 ) x 10
-9of input
88
±
29
2
Table 18: Degree of equivalence to the KCRV for the Nominal Ratio 0.9 at 1 kHz, Quadrature Voltage Ratio (nV/V)
NMIJ CEM NMIA IEN KRISS LCIE METAS NIM
−3 ± 31 4 ± 48 2
.6 ± 3.5 7 ± 10 −1 ± 24 −8316 ± 26 4 ± 68 −6 ± 9
NIST NPL NPLI NRC PTB SP UME VNIIM VSL
3 ± 100 −12 ± 25 −3098 ± 300 −23 ± 29 −11 ± 20 5 ± 71 −14 ± 59 6 ± 28 −128 ± 110
Table 19: Laboratory - Laboratory degree of equivalence for the Nominal Ratio 0.9 at 1 kHz, Quadrature Voltage Ratio (nV/V)
NMIJ CEM NMIA IEN KRISS LCIE METAS NIM
NMIJ −7 ± 57 −6 ± 32 −10 ± 33 −2 ± 40 8313 ± 41 −7 ± 75 3 ± 33 CEM 7 ± 57 1 ± 48 −3 ± 49 5 ± 54 8320 ± 55 0 ± 83 10 ± 49 NMIA 6 ± 32 −1 ± 48 −4 ± 12 4 ± 25 8319 ± 27 −1 ± 68 9 ± 11 IEN 10 ± 33 3 ± 49 4 ± 12 8 ± 27 8323 ± 29 3 ± 69 13 ± 14 KRISS 2 ± 40 −5 ± 54 −4 ± 25 −8 ± 27 8315 ± 36 −5 ± 72 5 ± 26 LCIE −8313 ± 41 −8320 ± 55 −8319 ± 27 −8323 ± 29 −8315 ± 36 −8320 ± 73 −8310 ± 28 METAS 7 ± 75 0 ± 83 1 ± 68 −3 ± 69 5 ± 72 8320 ± 73 10 ± 68 NIM −3 ± 33 −10 ± 49 −9 ± 11 −13 ± 14 −5 ± 26 8310 ± 28 −10 ± 68 NIST 6 ± 105 −1 ± 111 0 ± 100 −4 ± 101 4 ± 103 8319 ± 104 −1 ± 121 9 ± 101 NPL −8 ± 40 −15 ± 54 −14 ± 26 −18 ± 27 −10 ± 35 8305 ± 37 −15 ± 72 −5 ± 27 NPLI −3095 ± 302 −3102 ± 304 −3101 ± 300 −3105 ± 300 −3097 ± 301 5218 ± 301 −3102 ± 308 −3092 ± 300 NRC −20 ± 43 −27 ± 56 −26 ± 30 −30 ± 31 −22 ± 38 8293 ± 39 −27 ± 74 −17 ± 31 PTB −8 ± 38 −15 ± 52 −14 ± 21 −18 ± 23 −10 ± 32 8305 ± 34 −15 ± 71 −5 ± 23 SP 8 ± 78 1 ± 86 2 ± 71 −2 ± 72 6 ± 75 8321 ± 76 1 ± 98 11 ± 72 UME −11 ± 67 −18 ± 76 −17 ± 60 −21 ± 61 −13 ± 64 8302 ± 65 −18 ± 90 −8 ± 60 VNIIM 9 ± 42 2 ± 56 3 ± 29 −1 ± 30 7 ± 38 8322 ± 39 2 ± 74 12 ± 30 VSL −125 ± 115 −132 ± 120 −131 ± 110 −135 ± 111 −127 ± 113 8188 ± 113 −132 ± 129 −122 ± 111
NIST NPL NPLI NRC PTB SP UME VNIIM VSL
NMIJ −6 ± 105 8 ± 40 3095 ± 302 20 ± 43 8 ± 38 −8 ± 78 11 ± 67 −9 ± 42 125 ± 115 CEM 1 ± 111 15 ± 54 3102 ± 304 27 ± 56 15 ± 52 −1 ± 86 18 ± 76 −2 ± 56 132 ± 120 NMIA 0 ± 100 14 ± 26 3101 ± 300 26 ± 30 14 ± 21 −2 ± 71 17 ± 60 −3 ± 29 131 ± 110 IEN 4 ± 101 18 ± 27 3105 ± 300 30 ± 31 18 ± 23 2 ± 72 21 ± 61 1 ± 30 135 ± 111 KRISS −4 ± 103 10 ± 35 3097 ± 301 22 ± 38 10 ± 32 −6 ± 75 13 ± 64 −7 ± 38 127 ± 113 LCIE −8319 ± 104 −8305 ± 37 −5218 ± 301 −8293 ± 39 −8305 ± 34 −8321 ± 76 −8302 ± 65 −8322 ± 39 −8188 ± 113 METAS 1 ± 121 15 ± 72 3102 ± 308 27 ± 74 15 ± 71 −1 ± 98 18 ± 90 −2 ± 74 132 ± 129 NIM −9 ± 101 5 ± 27 3092 ± 300 17 ± 31 5 ± 23 −11 ± 72 8 ± 60 −12 ± 30 122 ± 111 NIST 14 ± 103 3101 ± 316 26 ± 104 14 ± 102 −2 ± 123 17 ± 117 −3 ± 104 131 ± 149 NPL −14 ± 103 3087 ± 301 12 ± 38 −0 ± 33 −16 ± 76 3 ± 65 −17 ± 38 117 ± 113 NPLI −3101 ± 316 −3087 ± 301 −3075 ± 301 −3087 ± 301 −3103 ± 308 −3084 ± 306 −3104 ± 301 −2970 ± 320 NRC −26 ± 104 −12 ± 38 3075 ± 301 −12 ± 36 −28 ± 77 −9 ± 66 −29 ± 41 105 ± 114 PTB −14 ± 102 0 ± 33 3087 ± 301 12 ± 36 −16 ± 74 3 ± 63 −17 ± 35 117 ± 112 SP 2 ± 123 16 ± 76 3103 ± 308 28 ± 77 16 ± 74 19 ± 93 −1 ± 77 133 ± 131 UME −17 ± 117 −3 ± 65 3084 ± 306 9 ± 66 −3 ± 63 −19 ± 93 −20 ± 66 114 ± 125 VNIIM 3 ± 104 17 ± 38 3104 ± 301 29 ± 41 17 ± 35 1 ± 77 20 ± 66 134 ± 114 VSL −131 ± 149 −117 ± 113 2970 ± 320 −105 ± 114 −117 ± 112 −133 ± 131 −114 ± 125 −134 ± 114 3 0
-200
-100
0
100
200
-200
-100
0
100
200
NMIJ
CEM NMIA
IEN
KRISS LCIE METAS NIM
NIST
NPL
NPLI
NRC
PTB
SP
UME VNIIM VSL
(Measured Ratio - KCRV) x 10
9
.
Nominal Ratio: 0.9 at 1 kHz, Quadrature Voltage Ratio (KCRV
±
2
σ
) is ( -71.6
±
3.9 ) x 10
-9of input
-8316
±
26
-3098
±
300
3
Table 20: Degree of equivalence to the KCRV for the Nominal Ratio 0.8 at 1 kHz, In-Phase Voltage Ratio (nV/V)
NMIJ CEM NMIA IEN KRISS LCIE METAS NIM
21 ± 14 −27 ± 51 −4
.5 ±11.7 4 ± 18 8 ± 20 136 ± 31 −4 ± 35 −9 ± 14
NIST NPL NPLI NRC PTB SP UME VNIIM VSL
11 ± 43 −4 ± 27 6 ± 13 −21 ± 31 −17 ± 23 −7 ± 49 −22 ± 50 −1 ± 21 −17 ± 27
Table 21: Laboratory - Laboratory degree of equivalence for the Nominal Ratio 0.8 at 1 kHz, In-Phase Voltage Ratio (nV/V)
NMIJ CEM NMIA IEN KRISS LCIE METAS NIM
NMIJ 48 ± 54 26 ± 20 17 ± 24 13 ± 25 −115 ± 35 25 ± 39 30 ± 21 CEM −48 ± 54 −22 ± 53 −31 ± 55 −35 ± 56 −163 ± 61 −23 ± 63 −18 ± 54 NMIA −26 ± 20 22 ± 53 −9 ± 22 −13 ± 24 −141 ± 34 −1 ± 38 4 ± 20 IEN −17 ± 24 31 ± 55 9 ± 22 −4 ± 28 −132 ± 37 8 ± 40 13 ± 24 KRISS −13 ± 25 35 ± 56 13 ± 24 4 ± 28 −128 ± 38 12 ± 41 17 ± 25 LCIE 115 ± 35 163 ± 61 141 ± 34 132 ± 37 128 ± 38 140 ± 48 145 ± 35 METAS −25 ± 39 23 ± 63 1 ± 38 −8 ± 40 −12 ± 41 −140 ± 48 5 ± 39 NIM −30 ± 21 18 ± 54 −4 ± 20 −13 ± 24 −17 ± 25 −145 ± 35 −5 ± 39 NIST −10 ± 46 38 ± 67 16 ± 45 7 ± 47 3 ± 48 −125 ± 53 15 ± 56 20 ± 46 NPL −25 ± 32 23 ± 59 1 ± 31 −8 ± 33 −12 ± 35 −140 ± 42 −0 ± 45 5 ± 32 NPLI −15 ± 20 33 ± 53 11 ± 19 2 ± 23 −2 ± 25 −130 ± 35 10 ± 38 15 ± 20 NRC −42 ± 35 6 ± 60 −16 ± 34 −25 ± 36 −29 ± 37 −157 ± 45 −17 ± 47 −12 ± 35 PTB −38 ± 28 10 ± 57 −12 ± 27 −21 ± 30 −25 ± 31 −153 ± 40 −13 ± 43 −8 ± 28 SP −28 ± 52 20 ± 72 −2 ± 51 −11 ± 53 −15 ± 54 −143 ± 59 −3 ± 61 2 ± 52 UME −43 ± 52 5 ± 72 −17 ± 52 −26 ± 53 −30 ± 54 −158 ± 59 −18 ± 61 −13 ± 52 VNIIM −22 ± 27 26 ± 56 4 ± 26 −5 ± 29 −9 ± 30 −137 ± 39 3 ± 42 8 ± 27 VSL −38 ± 31 10 ± 58 −12 ± 30 −21 ± 33 −25 ± 34 −153 ± 42 −13 ± 45 −8 ± 31
NIST NPL NPLI NRC PTB SP UME VNIIM VSL
NMIJ 10 ± 46 25 ± 32 15 ± 20 42 ± 35 38 ± 28 28 ± 52 43 ± 52 22 ± 27 38 ± 31 CEM −38 ± 67 −23 ± 59 −33 ± 53 −6 ± 60 −10 ± 57 −20 ± 72 −5 ± 72 −26 ± 56 −10 ± 58 NMIA −16 ± 45 −1 ± 31 −11 ± 19 16 ± 34 12 ± 27 2 ± 51 17 ± 52 −4 ± 26 12 ± 30 IEN −7 ± 47 8 ± 33 −2 ± 23 25 ± 36 21 ± 30 11 ± 53 26 ± 53 5 ± 29 21 ± 33 KRISS −3 ± 48 12 ± 35 2 ± 25 29 ± 37 25 ± 31 15 ± 54 30 ± 54 9 ± 30 25 ± 34 LCIE 125 ± 53 140 ± 42 130 ± 35 157 ± 45 153 ± 40 143 ± 59 158 ± 59 137 ± 39 153 ± 42 METAS −15 ± 56 0 ± 45 −10 ± 38 17 ± 47 13 ± 43 3 ± 61 18 ± 61 −3 ± 42 13 ± 45 NIM −20 ± 46 −5 ± 32 −15 ± 20 12 ± 35 8 ± 28 −2 ± 52 13 ± 52 −8 ± 27 8 ± 31 NIST 15 ± 51 5 ± 45 32 ± 53 28 ± 49 18 ± 66 33 ± 66 12 ± 48 28 ± 51 NPL −15 ± 51 −10 ± 31 17 ± 42 13 ± 37 3 ± 57 18 ± 57 −3 ± 35 13 ± 39 NPLI −5 ± 45 10 ± 31 27 ± 34 23 ± 27 13 ± 52 28 ± 52 7 ± 26 23 ± 30 NRC −32 ± 53 −17 ± 42 −27 ± 34 −4 ± 39 −14 ± 59 1 ± 59 −20 ± 38 −4 ± 41 PTB −28 ± 49 −13 ± 37 −23 ± 27 4 ± 39 −10 ± 55 5 ± 55 −16 ± 32 0 ± 36 SP −18 ± 66 −3 ± 57 −13 ± 52 14 ± 59 10 ± 55 15 ± 70 −6 ± 54 10 ± 57 UME −33 ± 66 −18 ± 57 −28 ± 52 −1 ± 59 −5 ± 55 −15 ± 70 −21 ± 55 −5 ± 57 VNIIM −12 ± 48 3 ± 35 −7 ± 26 20 ± 38 16 ± 32 6 ± 54 21 ± 55 16 ± 35 VSL −28 ± 51 −13 ± 39 −23 ± 30 4 ± 41 0 ± 36 −10 ± 57 5 ± 57 −16 ± 35 3 2
-80
-60
-40
-20
0
20
40
60
80
-80
-60
-40
-20
0
20
40
60
80
NMIJ
CEM NMIA
IEN
KRISS LCIE METAS NIM
NIST
NPL
NPLI
NRC
PTB
SP
UME VNIIM VSL
(Measured Ratio - 0.8 - KCRV) x 10
9
.
Nominal Ratio: 0.8 at 1 kHz, In-Phase Voltage Ratio (KCRV
±
2
σ
) is ( 71.5
±
5.3 ) x 10
-9of input
136
±
31
3
Table 22: Degree of equivalence to the KCRV for the Nominal Ratio 0.8 at 1 kHz, Quadrature Voltage Ratio (nV/V)
NMIJ CEM NMIA IEN KRISS LCIE METAS NIM
−8 ± 29 6 ± 48 3
.2 ± 3.2 6 ± 10 −3 ± 24 −12067 ± 29 7 ± 108 −12 ± 16
NIST NPL NPLI NRC PTB SP UME VNIIM VSL
6 ± 100 −19 ± 25 −6210 ± 300 −41 ± 29 −19 ± 20 −5 ± 71 −20 ± 59 11 ± 28 −240 ± 150
Table 23: Laboratory - Laboratory degree of equivalence for the Nominal Ratio 0.8 at 1 kHz, Quadrature Voltage Ratio (nV/V)
NMIJ CEM NMIA IEN KRISS LCIE METAS NIM
NMIJ −14 ± 56 −11 ± 30 −14 ± 32 −5 ± 38 12059 ± 42 −15 ± 112 4 ± 34 CEM 14 ± 56 3 ± 48 0 ± 49 9 ± 54 12073 ± 56 −1 ± 118 18 ± 51 NMIA 11 ± 30 −3 ± 48 −3 ± 12 6 ± 25 12070 ± 30 −4 ± 108 15 ± 18 IEN 14 ± 32 0 ± 49 3 ± 12 9 ± 27 12073 ± 32 −1 ± 108 18 ± 20 KRISS 5 ± 38 −9 ± 54 −6 ± 25 −9 ± 27 12064 ± 38 −10 ± 111 9 ± 30 LCIE −12059 ± 42 −12073 ± 56 −12070 ± 30 −12073 ± 32 −12064 ± 38 −12074 ± 112 −12055 ± 34 METAS 15 ± 112 1 ± 118 4 ± 108 1 ± 108 10 ± 111 12074 ± 112 19 ± 109 NIM −4 ± 34 −18 ± 51 −15 ± 18 −18 ± 20 −9 ± 30 12055 ± 34 −19 ± 109 NIST 14 ± 104 0 ± 111 3 ± 100 0 ± 101 9 ± 103 12073 ± 104 −1 ± 147 18 ± 102 NPL −11 ± 39 −25 ± 54 −22 ± 26 −25 ± 28 −16 ± 35 12048 ± 39 −26 ± 111 −7 ± 30 NPLI −6202 ± 301 −6216 ± 304 −6213 ± 300 −6216 ± 300 −6207 ± 301 5857 ± 301 −6217 ± 319 −6198 ± 301 NRC −33 ± 41 −47 ± 56 −44 ± 30 −47 ± 31 −38 ± 38 12026 ± 41 −48 ± 112 −29 ± 34 PTB −11 ± 36 −25 ± 52 −22 ± 21 −25 ± 24 −16 ± 32 12048 ± 36 −26 ± 110 −7 ± 27 SP 3 ± 77 −11 ± 86 −8 ± 71 −11 ± 72 −2 ± 75 12062 ± 77 −12 ± 129 7 ± 73 UME −12 ± 66 −26 ± 76 −23 ± 60 −26 ± 61 −17 ± 64 12047 ± 66 −27 ± 123 −8 ± 62 VNIIM 19 ± 41 5 ± 56 8 ± 29 5 ± 31 14 ± 38 12078 ± 41 4 ± 111 23 ± 33 VSL −232 ± 153 −246 ± 158 −243 ± 150 −246 ± 151 −237 ± 152 11827 ± 153 −247 ± 185 −228 ± 151
NIST NPL NPLI NRC PTB SP UME VNIIM VSL
NMIJ −14 ± 104 11 ± 39 6202 ± 301 33 ± 41 11 ± 36 −3 ± 77 12 ± 66 −19 ± 41 232 ± 153 CEM 0 ± 111 25 ± 54 6216 ± 304 47 ± 56 25 ± 52 11 ± 86 26 ± 76 −5 ± 56 246 ± 158 NMIA −3 ± 100 22 ± 26 6213 ± 300 44 ± 30 22 ± 21 8 ± 71 23 ± 60 −8 ± 29 243 ± 150 IEN 0 ± 101 25 ± 28 6216 ± 300 47 ± 31 25 ± 24 11 ± 72 26 ± 61 −5 ± 31 246 ± 151 KRISS −9 ± 103 16 ± 35 6207 ± 301 38 ± 38 16 ± 32 2 ± 75 17 ± 64 −14 ± 38 237 ± 152 LCIE −12073 ± 104 −12048 ± 39 −5857 ± 301 −12026 ± 41 −12048 ± 36 −12062 ± 77 −12047 ± 66 −12078 ± 41 −11827 ± 153 METAS 1 ± 147 26 ± 111 6217 ± 319 48 ± 112 26 ± 110 12 ± 129 27 ± 123 −4 ± 111 247 ± 185 NIM −18 ± 102 7 ± 30 6198 ± 301 29 ± 34 7 ± 27 −7 ± 73 8 ± 62 −23 ± 33 228 ± 151 NIST 25 ± 103 6216 ± 316 47 ± 104 25 ± 102 11 ± 123 26 ± 117 −5 ± 104 246 ± 180 NPL −25 ± 103 6191 ± 301 22 ± 38 −0 ± 33 −14 ± 76 1 ± 65 −30 ± 38 221 ± 152 NPLI −6216 ± 316 −6191 ± 301 −6169 ± 301 −6191 ± 301 −6205 ± 308 −6190 ± 306 −6221 ± 301 −5970 ± 335 NRC −47 ± 104 −22 ± 38 6169 ± 301 −22 ± 36 −36 ± 77 −21 ± 66 −52 ± 41 199 ± 153 PTB −25 ± 102 0 ± 33 6191 ± 301 22 ± 36 −14 ± 74 1 ± 63 −30 ± 35 221 ± 152 SP −11 ± 123 14 ± 76 6205 ± 308 36 ± 77 14 ± 74 15 ± 93 −16 ± 77 235 ± 166 UME −26 ± 117 −1 ± 65 6190 ± 306 21 ± 66 −1 ± 63 −15 ± 93 −31 ± 66 220 ± 161 VNIIM 5 ± 104 30 ± 38 6221 ± 301 52 ± 41 30 ± 35 16 ± 77 31 ± 66 251 ± 153 VSL −246 ± 180 −221 ± 152 5970 ± 335 −199 ± 153 −221 ± 152 −235 ± 166 −220 ± 161 −251 ± 153 3 4
-120
-100
-80
-60
-40
-20
0
20
40
60
80
100
120
140
160
-120
-100
-80
-60
-40
-20
0
20
40
60
80
100
120
140
160
NMIJ
CEM NMIA
IEN
KRISS LCIE METAS NIM
NIST
NPL
NPLI
NRC
PTB
SP
UME VNIIM VSL
(Measured Ratio - KCRV) x 10
9
.
Nominal Ratio: 0.8 at 1 kHz, Quadrature Voltage Ratio (KCRV
±
2
σ
) is ( -110.2
±
4.1 ) x 10
-9of input
-12067
±
29
-6210
±
300
-240
±
150
3
Table 24: Degree of equivalence to the KCRV for the Nominal Ratio 0.7 at 1 kHz, In-Phase Voltage Ratio (nV/V)
NMIJ CEM NMIA IEN KRISS LCIE METAS NIM
22 ± 15 −31 ± 51 −1
.0 ±11.4 −2 ± 17 10 ± 20 168 ± 35 −2 ± 35 −4 ± 14
NIST NPL NPLI NRC PTB SP UME VNIIM VSL
15 ± 44 −2 ± 27 23 ± 12 −22 ± 31 −17 ± 23 −17 ± 49 −19 ± 50 1 ± 21 −12 ± 32
Table 25: Laboratory - Laboratory degree of equivalence for the Nominal Ratio 0.7 at 1 kHz, In-Phase Voltage Ratio (nV/V)
NMIJ CEM NMIA IEN KRISS LCIE METAS NIM
NMIJ 53 ± 54 23 ± 20 24 ± 24 12 ± 26 −146 ± 39 24 ± 39 26 ± 22 CEM −53 ± 54 −30 ± 53 −29 ± 55 −41 ± 56 −199 ± 63 −29 ± 63 −27 ± 54 NMIA −23 ± 20 30 ± 53 1 ± 22 −11 ± 24 −169 ± 38 1 ± 38 3 ± 20 IEN −24 ± 24 29 ± 55 −1 ± 22 −12 ± 28 −170 ± 40 0 ± 40 2 ± 24 KRISS −12 ± 26 41 ± 56 11 ± 24 12 ± 28 −158 ± 41 12 ± 41 14 ± 25 LCIE 146 ± 39 199 ± 63 169 ± 38 170 ± 40 158 ± 41 170 ± 50 172 ± 38 METAS −24 ± 39 29 ± 63 −1 ± 38 0 ± 40 −12 ± 41 −170 ± 50 2 ± 39 NIM −26 ± 22 27 ± 54 −3 ± 20 −2 ± 24 −14 ± 25 −172 ± 38 −2 ± 39 NIST −7 ± 47 46 ± 68 16 ± 46 17 ± 48 5 ± 48 −153 ± 56 17 ± 57 19 ± 46 NPL −24 ± 32 29 ± 59 −1 ± 31 0 ± 33 −12 ± 35 −170 ± 45 0 ± 45 2 ± 32 NPLI 1 ± 21 54 ± 53 24 ± 19 25 ± 23 13 ± 25 −145 ± 38 25 ± 38 27 ± 20 NRC −44 ± 35 9 ± 60 −21 ± 34 −20 ± 36 −32 ± 37 −190 ± 47 −20 ± 47 −18 ± 35 PTB −39 ± 28 14 ± 57 −16 ± 27 −15 ± 30 −27 ± 31 −185 ± 43 −15 ± 43 −13 ± 28 SP −39 ± 52 14 ± 72 −16 ± 51 −15 ± 53 −27 ± 54 −185 ± 61 −15 ± 61 −13 ± 52 UME −41 ± 52 12 ± 72 −18 ± 52 −17 ± 53 −29 ± 54 −187 ± 61 −17 ± 61 −15 ± 52 VNIIM −21 ± 27 32 ± 56 2 ± 26 3 ± 29 −9 ± 30 −167 ± 42 3 ± 42 5 ± 27 VSL −34 ± 36 19 ± 61 −11 ± 35 −10 ± 37 −22 ± 39 −180 ± 48 −10 ± 48 −8 ± 36
NIST NPL NPLI NRC PTB SP UME VNIIM VSL
NMIJ 7 ± 47 24 ± 32 −1 ± 21 44 ± 35 39 ± 28 39 ± 52 41 ± 52 21 ± 27 34 ± 36 CEM −46 ± 68 −29 ± 59 −54 ± 53 −9 ± 60 −14 ± 57 −14 ± 72 −12 ± 72 −32 ± 56 −19 ± 61 NMIA −16 ± 46 1 ± 31 −24 ± 19 21 ± 34 16 ± 27 16 ± 51 18 ± 52 −2 ± 26 11 ± 35 IEN −17 ± 48 −0 ± 33 −25 ± 23 20 ± 36 15 ± 30 15 ± 53 17 ± 53 −3 ± 29 10 ± 37 KRISS −5 ± 48 12 ± 35 −13 ± 25 32 ± 37 27 ± 31 27 ± 54 29 ± 54 9 ± 30 22 ± 39 LCIE 153 ± 56 170 ± 45 145 ± 38 190 ± 47 185 ± 43 185 ± 61 187 ± 61 167 ± 42 180 ± 48 METAS −17 ± 57 −0 ± 45 −25 ± 38 20 ± 47 15 ± 43 15 ± 61 17 ± 61 −3 ± 42 10 ± 48 NIM −19 ± 46 −2 ± 32 −27 ± 20 18 ± 35 13 ± 28 13 ± 52 15 ± 52 −5 ± 27 8 ± 36 NIST 17 ± 52 −8 ± 46 37 ± 54 32 ± 50 32 ± 66 34 ± 67 14 ± 49 27 ± 55 NPL −17 ± 52 −25 ± 31 20 ± 42 15 ± 37 15 ± 57 17 ± 57 −3 ± 35 10 ± 43 NPLI 8 ± 46 25 ± 31 45 ± 34 40 ± 27 40 ± 52 42 ± 52 22 ± 26 35 ± 35 NRC −37 ± 54 −20 ± 42 −45 ± 34 −5 ± 39 −5 ± 59 −3 ± 59 −23 ± 38 −10 ± 45 PTB −32 ± 50 −15 ± 37 −40 ± 27 5 ± 39 0 ± 55 2 ± 55 −18 ± 32 −5 ± 40 SP −32 ± 66 −15 ± 57 −40 ± 52 5 ± 59 0 ± 55 2 ± 70 −18 ± 54 −5 ± 59 UME −34 ± 67 −17 ± 57 −42 ± 52 3 ± 59 −2 ± 55 −2 ± 70 −20 ± 55 −7 ± 60 VNIIM −14 ± 49 3 ± 35 −22 ± 26 23 ± 38 18 ± 32 18 ± 54 20 ± 55 13 ± 39 VSL −27 ± 55 −10 ± 43 −35 ± 35 10 ± 45 5 ± 40 5 ± 59 7 ± 60 −13 ± 39 3 6
-100
-80
-60
-40
-20
0
20
40
60
80
-100
-80
-60
-40
-20
0
20
40
60
80
NMIJ
CEM NMIA
IEN
KRISS LCIE METAS NIM
NIST
NPL
NPLI
NRC
PTB
SP
UME VNIIM VSL
(Measured Ratio - 0.7 - KCRV) x 10
9
.
Nominal Ratio: 0.7 at 1 kHz, In-Phase Voltage Ratio (KCRV
±
2
σ
) is ( 64.0
±
5.8 ) x 10
-9of input
168
±
35
3
Table 26: Degree of equivalence to the KCRV for the Nominal Ratio 0.7 at 1 kHz, Quadrature Voltage Ratio (nV/V)
NMIJ CEM NMIA IEN KRISS LCIE METAS NIM
−11 ± 27 8 ± 48 4
.0 ± 2.5 25 ± 13 −4 ± 24 −11028 ± 33 10 ± 128 −19 ± 20
NIST NPL NPLI NRC PTB SP UME VNIIM VSL
7 ± 100 −25 ± 25 −7753 ± 300 −51 ± 29 −26 ± 20 −8 ± 71 −23 ± 59 15 ± 28 −333 ± 180
Table 27: Laboratory - Laboratory degree of equivalence for the Nominal Ratio 0.7 at 1 kHz, Quadrature Voltage Ratio (nV/V)
NMIJ CEM NMIA IEN KRISS LCIE METAS NIM
NMIJ −19 ± 55 −15 ± 28 −36 ± 31 −7 ± 37 11017 ± 43 −21 ± 131 8 ± 34 CEM 19 ± 55 4 ± 48 −17 ± 50 12 ± 54 11036 ± 58 −2 ± 136 27 ± 52 NMIA 15 ± 28 −4 ± 48 −21 ± 15 8 ± 25 11032 ± 34 −6 ± 128 23 ± 21 IEN 36 ± 31 17 ± 50 21 ± 15 29 ± 28 11053 ± 36 15 ± 128 44 ± 25 KRISS 7 ± 37 −12 ± 54 −8 ± 25 −29 ± 28 11024 ± 41 −14 ± 130 15 ± 32 LCIE −11017 ± 43 −11036 ± 58 −11032 ± 34 −11053 ± 36 −11024 ± 41 −11038 ± 132 −11009 ± 39 METAS 21 ± 131 2 ± 136 6 ± 128 −15 ± 128 14 ± 130 11038 ± 132 29 ± 129 NIM −8 ± 34 −27 ± 52 −23 ± 21 −44 ± 25 −15 ± 32 11009 ± 39 −29 ± 129 NIST 18 ± 104 −1 ± 111 3 ± 100 −18 ± 101 11 ± 103 11035 ± 106 −3 ± 162 26 ± 102 NPL −14 ± 37 −33 ± 54 −29 ± 26 −50 ± 29 −21 ± 35 11003 ± 42 −35 ± 130 −6 ± 33 NPLI −7742 ± 301 −7761 ± 304 −7757 ± 300 −7778 ± 300 −7749 ± 301 3275 ± 302 −7763 ± 326 −7734 ± 301 NRC −40 ± 40 −59 ± 56 −55 ± 30 −76 ± 32 −47 ± 38 10977 ± 44 −61 ± 131 −32 ± 36 PTB −15 ± 34 −34 ± 52 −30 ± 21 −51 ± 25 −22 ± 32 11002 ± 39 −36 ± 129 −7 ± 29 SP 3 ± 76 −16 ± 86 −12 ± 71 −33 ± 73 −4 ± 75 11020 ± 79 −18 ± 146 11 ± 74 UME −12 ± 66 −31 ± 76 −27 ± 60 −48 ± 61 −19 ± 64 11005 ± 68 −33 ± 141 −4 ± 63 VNIIM 26 ± 40 7 ± 56 11 ± 29 −10 ± 32 19 ± 38 11043 ± 44 5 ± 131 34 ± 35 VSL −322 ± 182 −341 ± 186 −337 ± 180 −358 ± 181 −329 ± 182 10695 ± 183 −343 ± 221 −314 ± 181
NIST NPL NPLI NRC PTB SP UME VNIIM VSL
NMIJ −18 ± 104 14 ± 37 7742 ± 301 40 ± 40 15 ± 34 −3 ± 76 12 ± 66 −26 ± 40 322 ± 182 CEM 1 ± 111 33 ± 54 7761 ± 304 59 ± 56 34 ± 52 16 ± 86 31 ± 76 −7 ± 56 341 ± 186 NMIA −3 ± 100 29 ± 26 7757 ± 300 55 ± 30 30 ± 21 12 ± 71 27 ± 60 −11 ± 29 337 ± 180 IEN 18 ± 101 50 ± 29 7778 ± 300 76 ± 32 51 ± 25 33 ± 73 48 ± 61 10 ± 32 358 ± 181 KRISS −11 ± 103 21 ± 35 7749 ± 301 47 ± 38 22 ± 32 4 ± 75 19 ± 64 −19 ± 38 329 ± 182 LCIE −11035 ± 106 −11003 ± 42 −3275 ± 302 −10977 ± 44 −11002 ± 39 −11020 ± 79 −11005 ± 68 −11043 ± 44 −10695 ± 183 METAS 3 ± 162 35 ± 130 7763 ± 326 61 ± 131 36 ± 129 18 ± 146 33 ± 141 −5 ± 131 343 ± 221 NIM −26 ± 102 6 ± 33 7734 ± 301 32 ± 36 7 ± 29 −11 ± 74 4 ± 63 −34 ± 35 314 ± 181 NIST 32 ± 103 7760 ± 316 58 ± 104 33 ± 102 15 ± 123 30 ± 117 −8 ± 104 340 ± 206 NPL −32 ± 103 7728 ± 301 26 ± 38 1 ± 33 −17 ± 76 −2 ± 65 −40 ± 38 308 ± 182 NPLI −7760 ± 316 −7728 ± 301 −7702 ± 301 −7727 ± 301 −7745 ± 308 −7730 ± 306 −7768 ± 301 −7420 ± 350 NRC −58 ± 104 −26 ± 38 7702 ± 301 −25 ± 36 −43 ± 77 −28 ± 66 −66 ± 41 282 ± 182 PTB −33 ± 102 −1 ± 33 7727 ± 301 25 ± 36 −18 ± 74 −3 ± 63 −41 ± 35 307 ± 181 SP −15 ± 123 17 ± 76 7745 ± 308 43 ± 77 18 ± 74 15 ± 93 −23 ± 77 325 ± 194 UME −30 ± 117 2 ± 65 7730 ± 306 28 ± 66 3 ± 63 −15 ± 93 −38 ± 66 310 ± 190 VNIIM 8 ± 104 40 ± 38 7768 ± 301 66 ± 41 41 ± 35 23 ± 77 38 ± 66 348 ± 182 VSL −340 ± 206 −308 ± 182 7420 ± 350 −282 ± 182 −307 ± 181 −325 ± 194 −310 ± 190 −348 ± 182 3 8
-100
0
100
200
-100
0
100
200
NMIJ
CEM NMIA
IEN
KRISS LCIE METAS NIM
NIST
NPL
NPLI
NRC
PTB
SP
UME VNIIM VSL
(Measured Ratio - KCRV) x 10
9
.
Nominal Ratio: 0.7 at 1 kHz, Quadrature Voltage Ratio (KCRV
±
2
σ
) is ( -137.0
±
4.5 ) x 10
-9of input
-11028
±
33
-7753
±
300
-333
±
180
3
Table 28: Degree of equivalence to the KCRV for the Nominal Ratio 0.6 at 1 kHz, In-Phase Voltage Ratio (nV/V)
NMIJ CEM NMIA IEN KRISS LCIE METAS NIM
16 ± 13 −35 ± 51 0
.0 ±11.5 −6 ± 16 7 ± 20 179 ± 37 −5 ± 33 4 ± 14
NIST NPL NPLI NRC PTB SP UME VNIIM VSL
15 ± 44 −2 ± 27 30 ± 12 −24 ± 31 −19 ± 23 −15 ± 49 −14 ± 50 0 ± 21 −10 ± 37
Table 29: Laboratory - Laboratory degree of equivalence for the Nominal Ratio 0.6 at 1 kHz, In-Phase Voltage Ratio (nV/V)
NMIJ CEM NMIA IEN KRISS LCIE METAS NIM
NMIJ 51 ± 54 16 ± 19 22 ± 22 9 ± 25 −163 ± 40 21 ± 37 12 ± 21 CEM −51 ± 54 −35 ± 53 −29 ± 54 −42 ± 56 −214 ± 64 −30 ± 62 −39 ± 54 NMIA −16 ± 19 35 ± 53 6 ± 21 −7 ± 24 −179 ± 39 5 ± 36 −4 ± 20 IEN −22 ± 22 29 ± 54 −6 ± 21 −13 ± 26 −185 ± 41 −1 ± 38 −10 ± 22 KRISS −9 ± 25 42 ± 56 7 ± 24 13 ± 26 −172 ± 43 12 ± 40 3 ± 25 LCIE 163 ± 40 214 ± 64 179 ± 39 185 ± 41 172 ± 43 184 ± 50 175 ± 40 METAS −21 ± 37 30 ± 62 −5 ± 36 1 ± 38 −12 ± 40 −184 ± 50 −9 ± 37 NIM −12 ± 21 39 ± 54 4 ± 20 10 ± 22 −3 ± 25 −175 ± 40 9 ± 37 NIST −1 ± 46 50 ± 68 15 ± 46 21 ± 47 8 ± 48 −164 ± 58 20 ± 55 11 ± 46 NPL −18 ± 31 33 ± 59 −2 ± 31 4 ± 32 −9 ± 35 −181 ± 46 3 ± 44 −6 ± 32 NPLI 14 ± 20 65 ± 53 30 ± 19 36 ± 22 23 ± 25 −149 ± 40 35 ± 37 26 ± 20 NRC −40 ± 35 11 ± 60 −24 ± 34 −18 ± 35 −31 ± 37 −203 ± 49 −19 ± 46 −28 ± 35 PTB −35 ± 28 16 ± 57 −19 ± 27 −13 ± 29 −26 ± 31 −198 ± 44 −14 ± 41 −23 ± 28 SP −31 ± 52 20 ± 72 −15 ± 51 −9 ± 52 −22 ± 54 −194 ± 62 −10 ± 60 −19 ± 52 UME −30 ± 52 21 ± 72 −14 ± 52 −8 ± 53 −21 ± 54 −193 ± 62 −9 ± 60 −18 ± 52 VNIIM −16 ± 26 35 ± 56 0 ± 26 6 ± 28 −7 ± 30 −179 ± 43 5 ± 40 −4 ± 27 VSL −26 ± 40 25 ± 64 −10 ± 39 −4 ± 41 −17 ± 43 −189 ± 53 −5 ± 50 −14 ± 40
NIST NPL NPLI NRC PTB SP UME VNIIM VSL
NMIJ 1 ± 46 18 ± 31 −14 ± 20 40 ± 35 35 ± 28 31 ± 52 30 ± 52 16 ± 26 26 ± 40 CEM −50 ± 68 −33 ± 59 −65 ± 53 −11 ± 60 −16 ± 57 −20 ± 72 −21 ± 72 −35 ± 56 −25 ± 64 NMIA −15 ± 46 2 ± 31 −30 ± 19 24 ± 34 19 ± 27 15 ± 51 14 ± 52 0 ± 26 10 ± 39 IEN −21 ± 47 −4 ± 32 −36 ± 22 18 ± 35 13 ± 29 9 ± 52 8 ± 53 −6 ± 28 4 ± 41 KRISS −8 ± 48 9 ± 35 −23 ± 25 31 ± 37 26 ± 31 22 ± 54 21 ± 54 7 ± 30 17 ± 43 LCIE 164 ± 58 181 ± 46 149 ± 40 203 ± 49 198 ± 44 194 ± 62 193 ± 62 179 ± 43 189 ± 53 METAS −20 ± 55 −3 ± 44 −35 ± 37 19 ± 46 14 ± 41 10 ± 60 9 ± 60 −5 ± 40 5 ± 50 NIM −11 ± 46 6 ± 32 −26 ± 20 28 ± 35 23 ± 28 19 ± 52 18 ± 52 4 ± 27 14 ± 40 NIST 17 ± 52 −15 ± 46 39 ± 54 34 ± 50 30 ± 66 29 ± 67 15 ± 49 25 ± 58 NPL −17 ± 52 −32 ± 31 22 ± 42 17 ± 37 13 ± 57 12 ± 57 −2 ± 35 8 ± 46 NPLI 15 ± 46 32 ± 31 54 ± 34 49 ± 27 45 ± 52 44 ± 52 30 ± 26 40 ± 40 NRC −39 ± 54 −22 ± 42 −54 ± 34 −5 ± 39 −9 ± 59 −10 ± 59 −24 ± 38 −14 ± 49 PTB −34 ± 50 −17 ± 37 −49 ± 27 5 ± 39 −4 ± 55 −5 ± 55 −19 ± 32 −9 ± 44 SP −30 ± 66 −13 ± 57 −45 ± 52 9 ± 59 4 ± 55 −1 ± 70 −15 ± 54 −5 ± 62 UME −29 ± 67 −12 ± 57 −44 ± 52 10 ± 59 5 ± 55 1 ± 70 −14 ± 55 −4 ± 62 VNIIM −15 ± 49 2 ± 35 −30 ± 26 24 ± 38 19 ± 32 15 ± 54 14 ± 55 10 ± 43 VSL −25 ± 58 −8 ± 46 −40 ± 40 14 ± 49 9 ± 44 5 ± 62 4 ± 62 −10 ± 43 4 0
-100
-80
-60
-40
-20
0
20
40
60
80
100
-100
-80
-60
-40
-20
0
20
40
60
80
100
NMIJ
CEM NMIA
IEN
KRISS LCIE METAS NIM
NIST
NPL
NPLI
NRC
PTB
SP
UME VNIIM VSL
(Measured Ratio - 0.6 - KCRV) x 10
9
.
Nominal Ratio: 0.6 at 1 kHz, In-Phase Voltage Ratio (KCRV
±
2
σ
) is ( 39.0
±
5.7 ) x 10
-9of input
179
±
37
4