Artificial Muscle Technology Applied Towards Treating
Ischemic
Mitral Regurgitation Caused by Left Ventricular Remodeling
By
Nicaulas A. Sabourin
Bachelor's of Science, Biomedical Physics, Laurentian University, 1999 Bachelor's of Applied Science, Electrical Engineering, University of Ottawa, 2002
Submitted to the Department of Mechanical Engineering in Partial Fulfillment of the Requirements for the Degree of
Master of Science
at the
MASSACHUSETTS INSTITUTE OF TECHNOLOGY
June 2004
D 2004 Massachusetts Institute of Technology. All rights reserved.
MASSACHUSETTS INS-- E
OF TECHNOLOGY
JUL 2
0
2004
LIBRARIES
Signature of A uthor: ...
Department of Mechanical Engineering May 7 th2004
Certified by: ... ... ... Ian W. Hunter Hatsopoulos Professor of Mechanical Engineering and Professor of Biological Engineering Thesis Supervisor
A ccepted b y: ... ... Ain A. Sonin Professor of Mechanical Engineering Chairman, Department Committee on Graduate Students
Artificial Muscle Technology Applied Towards Treating
Ischemic
Mitral Regurgitation Caused by Left Ventricular Remodeling
By
NICAULAS A. SABOURIN
Submitted to the Department of Mechanical Engineering on May7th , 2004 in Partial Fulfillment of the Requirements
for the Degree of Master of Science
Abstract
Ischemic Mitral Regurgitation (MR) affects a large portion of patients suffering from ischemic heart disease. Significant MR develops in one quarter to one third of patients who suffer from ischemic heart disease and doubles their late mortality rate after a myocardial infarction or revascularization. MR is most often caused by the bulging, or remodeling, of the heart's left ventricle. This remodeling displaces the papillary muscles inside of the ventricle and tethers the mitral valve, preventing it from closing properly. Current treatments attempt to either repair or replace the valve. These treatments require the heart be stopped and the patient be placed on a cardiopulmonary bypass pump for many hours. Both treatment approaches have serious side-effects, including relapse of the MR as quickly as six months post-operatively.
This thesis concerns the development of an active artificial muscle patch (AMP) for application to the exterior of the heart. The AMP constructively remodels the heart in order to alleviate MR. Two in-vivo experiments were conducted with a heart-gated fluid pumping apparatus connected to a balloon patch that successfully proofed the concept that an active patch can relieve MR. These experiments also established data on the mechanical requirements of such a patch. An in-vitro heart model was created to test iterations of AMP devices before undergoing further in-vivo studies. Development of an AMP using Nickel-Titanium shape memory alloy was begun and iterations of this device have had early success in in-vitro tests.
Thesis Supervisor: Ian W. Hunter
Acknowledgements
I would first like to thank Professor Ian Hunter for giving me the opportunity to work in the Bioinstrumentation Laboratory and for creating a research atmosphere that encourages the mind to overcome its limits.
I would like to thank all of my colleagues in the Bioinstrumentation Laboratory for their help, guidance and input. Special thanks go to Patrick Anquetil and Peter Madden for sharing their experience with me, to Bryan Crane for helping me learn how to machine and to Michael Garcia-Webb for his help with programming.
I would like to thank our collaborators from the Cardiac Ultrasound Laboratory at Massachusetts General Hospital, especially Dr. Robert Levine, Dr. Judy Hung and Dr. Mordehay Vatury. Their input over the course of my research and the opportunity that I had to participate in the in-vivo procedures was invaluable. I also extend thanks to the NIH and CIMIT for their generous support of this research.
Many thanks go to the Fondation Baxter & Alma Ricard, most especially to the late Madame Alma Ricard. Her generosity is without measure and her contributions to the academic achievements of students such as myself is an incredible legacy.
I would like to thank Dr. Anny Usheva of Harvard Medical School who helped shape my approach to research and pushed me to both sharpen and broaden my skills as a researcher.
Many thanks go to Jennifer Johnson whose company made the many long hours and late nights spent on this document more enjoyable and whose assistance, both technical and otherwise, was invaluable.
I would also like to thank Tintin for always being there to help me unwind and enjoy the simple pleasures in life.
Above all, I'd like to thank my parents. Merci beaucoup pour votre support et patience. Je ne serais pas ici sans vous.
Table of Contents
AB STRA CT ... 3
ACK N O W LED G EM EN TS ... 4
1 IN TR O D UC TIO N ... 10
1.1 ADDRESSING PROBLEMS OF HEART DISEASE: THE CASE OF ISCHEMIC MITRAL REGURGITATION ... 10
1.2 CURRENT APPROACHES To TREATMENT ... 12
1.3 PROPOSED N Ew TREATMENT ... 13
1.4 STUDY PURPOSE AND SCOPE ... 14
2 AM P DEVICE SIM ULA TIO N ... 15
2.1 BACKGROUND ... 15
2.2 AM P SIMULATION APPARATUS ... 15
2.2.1 On-H eart Elem ents ... 16
2.2.2 Base Ring Version I ... 17
2.2.3 Base Ring Version 2 ... 18
2.2.4 Balloon ... 19
2.2.5 Assem bly ... 20
2.2.6 Fluid Pumping System (FPS) ... 20
2.2.7 Linear Actuator ... 21
2.2.8 Syringe and M ounts ... 23
2.2.9 Electronic Gating System (EGS) ... 25
2.2.10 Sensors and D ata Acquisition ... 27
2.2.11 Apparatus Assembly ... 28
2.3 IN-V ivo EXPERIMENT 1 (PERFORMED JUNE 15 TH 2003) ... 29
2.3.1 Background and Preparation ... 29
2.3.2 Summary ofProcedure ... 30
2.3.3 Issues Encountered ... 31
2.3.4 D ata Acquired ... 33
2.3.5 D iscussion ofResults ... 34
2.4 IN-V fvo EXPERIMENT 2 (PERFORMED AUGUST I 1TH 2003) ... 36
2.4.1 Improvem ents to Instrumentation ... 36
2.4.2 Summary ofProcedure ... 38
2.4.3 D ata Acquired ... 41
2.4.4 D iscussion ofResults ... 49
2.5 FUTURE RESEARCH ... 50
3 IN VITR O M O DEL DEV ELO PM EN T ... 51
3.1 BACKGROUND ... 51
3.2 D ESIGN AND M ANUFACTURE ... 51
3.3 VERSION 1.0 ... 53
3.3.1 D esign ... 53
3.3.2 M anufacture ... 54
3.3.3 Silicone Putty M olding ... 56
3.3.4 P-4 Silicone Rubber ... 57
3.3.5 Ventricle Fram e ... 58
3.3.6 Force M easurem ents and Redesign ... 59
4 SHAPE MEMORY ALLOY AMP PROTOTYPE DEVELOPMENT ... 62
4.1 BACKGROUND ON SHAPE M EMORY A LLOY ... 62
4.2 POTENTIA L D ESIGNS ... 63
4.2.1 Lever Prototype...63
4 .2 .1.1 D esig n ... 6 3 4.2.1.2 M anufacturing and Assembly ... 65
4 .2 .1.3 T estin g ... 6 6 4 .2 .1.4 S tatu s...6 6 4.2.2 Bowing Shim Prototype...67
4 .2 .2 .1 D esig n ... 6 7 4.2.2.2 M anufacturing and Assembly ... 68
4 .2 .2 .3 T estin g ... 6 9 4 .2 .2 .4 S tatu s...7 0 4.3 SM A A M P D EVICE VERSION 1...71
4.3.1 D esign ... 71
4.3.1.1 M echanical System M odifications ... 71
4.3.1.2 Electrical System M odifications ... 72
4.3.2 M anufacturing and Assembly...73
4.3.2.1 Ceramic Pulley M achining...75
4.3.3 Testing and Analysis...77
4.3.4 Status ... 79
4.4 SM A A M P D EVICE VERSION 2...79
4.4.1 D esign ... 79
4.4.1.1 M echanical System M odifications ... 79
4.4.1.2 Electrical System M odifications ... 81
4.4.2 M anufacturing and Assembly...83
4.4.3 Testing and Analysis...84
4.5 FUTURE RESEARCH ... 86
5 CO N CLU SIO N S A ND FU TURE RESEARCH ... 87
REFEREN CES...89
APPENDIX A : DIM EN SIO NAL SCH EM ATICS ... 92
APPENDIX B: CALCULATIONS OF LINEAR ACTUATOR REQUIREMENTS...105
APPENDIX C: CALCULATIONS FOR SMA LEVER PROTOTYPE...109
List of Figures
F ig ure 1 The m itral valve...11
Figure 2: Echocardiograph of MR in a sheep's heart[1]. ... 12
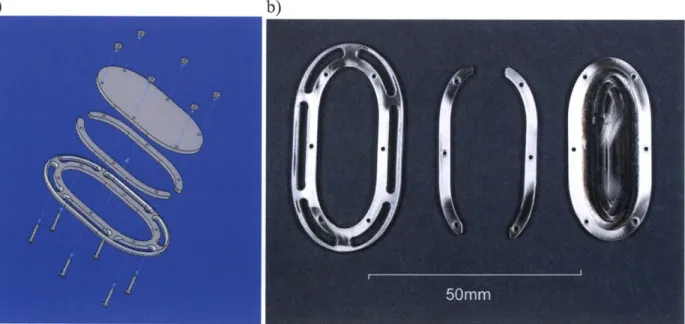
Figure 3: a) CAD assembly of Base Ring Version 1; b) Photo of machined main components of Base Ring Version 1. ... 1 7 Figure 4: a) CAD assembly of Base Ring Version 2; b) Individual machined parts of Base Ring Version 2...18
Figure 5: Fabricated balloon for on-heart assembly...19
Figure 6: Photos of the fully assembled on-heart assembly...20
Figure 7: Photo of the Linmot PS01-3 7x240 linear actuator used in simulation apparatus... 22
Figure 8: a) CAD assembly of Perfektum 50 mL syringe mounts; b) Machined Delrin component of Perfektum sy ring e m o u n ts...2 4 Figure 9: a) CAD Assembly of syringe-actuator coupler; b) Machined Delrin components of syringe-actuator c o up le r...2 5 F igure 10: E G S circuit diagram ... 26
Figure 11: M achined D elrin E GS circuit box. ... 27
Figure 12: Simulation apparatus mounted onto its optical table...28
Figure 13: On-heart elements sutured to LV epicardium during first in-vivo procedure. ... 31
Figure 14: Addition made to Base Ring during in-vivo procedure 1. ... 32
Figure 15: Comparison of A/2 output waveform versus actual actuator position: a) 200 ms period waveform; b) 400 m s p eriod w aveform . ... 34
Figure 16: CAD assembly of Base Ring 3 used for second in vivo procedure... 36
Figure 17: Series of devices prepared for second in vivo procedure: a) Base frames; b) Backings... 37
Figure 18: Output waveform prepared for second in-vivo study. ... 38
Figure 19: EGS trigger output from Millar catheter input. ... 40
Figure 20: On-heart elements sutured onto LV epicardium during second in-vivo procedure...41
Figure 21: Comparison of output waveform demand position versus actual actuator position for second in-vivo s tu dy . ... 4 2 Figure 22: Pressure (blue) and Trigger Signal (red) with FPS pumping on trigger prior to the on-heart elements' installation (baseline m easurem ent)...43
Figure 23: Pressure (blue) and Trigger Signal (red) with FPS pumping on trigger and the on-heart elements' su tured o n th e L V . ... 4 4 Figure 24: Echocardiograph image recorded during the second in vivo study showing prominent MR with the active p atch sim ulation device inactive. ... 46
Figure 25: Echocardiograph image recorded during the second in-vivo study showing the AMP simulation device's balloon inflating on trigger with ventricular systole...47
Figure 26: Echocardiograph image recorded during the second in-vivo study showing relief of MR by the active p a tch sim ulation device...48
Figure 27: Balloon filled with 8 m L offluid...49
Figure 28: SLA manufactured model of a pig heart's ventricles: a) Side view; b) Top view... 52
Figure 29: a) CAD assembly of the half ellipse mold Version 1. b) Photo of the SLA manufactured mold pieces...54
Figure 30: Isometric view of Silicone putty L V ellipse molding... 57
Figure 31: P-4 Silicone-Rubber molding of the in-vitro L V ellipse. ... 58
Figure 32: a) CAD assembly of the half ellipse in vitro model b) Photo of the SLA-manufactured frame and silicone rubber molded half-ellipse assembled for use... .... 59
Figure 33: Experimental setup for force measurements of the P-4 Silicone-Rubber L V ellipse. ... 60
Figure 34: CAD assem bly of lever prototype...64
Figure 35: a) Top view of manufactured assembly; b) Side view of manufactured assembly; c) Lever prototype with lever d ep loy ed . ... 6 5 Figure 36: CAD assembly of bowing shim prototype...68
Figure 37: a) Top view of bowing shim prototype; b) Isometric view of bowing shim prototype. ... 69
Figure 39: CAD assembly of SMA AMP device Version 1... 72
Figure 40: Final assembly of SMA AMP device Version 1. ... 74
Figure 41. CAD of Macor pulley wheel. ... 75
Figure 42: Ceramic pulley wheel machining cutofffig. ... 76
Figure 43: Ceramic pulley wheel, finished product: a) Frontal view; b) Side view. ... 77
Figure 44: CAD assembly of the SMA AMP device Version 2...81
Figure 45: Circuit diagram of the SMA AMP Version 2 power triggering circuit... 82
Figure 46: Final assembly of SMA AMP device Version 2... 83
F igure 47: P ow er triggering circuit... 84
Figure 48: SMA AMP Version 2 device sutured to in vitro ellipse. ... 85
Figure 49: Schematic of Base Ring Version 1...92
Figure 50: Schematic of Base Ring Version 2... ... 93
Figure 51: Schematic of Perfektum 50 mL syringe mounts... 94
Figure 52: Schematic of syringe-actuator coupler...95
Figure 53: Schematic of Base Ring 3 frames prepared for second in vivo procedure. ... 96
Figure 54: Schematic of Base Ring 3 backings prepared for second in vivo procedure... 97
Figure 55: Schematic of in vitro half ellipse molds... 98
Figure 56: Schematic of in vitro assembly frame... ... 99
Figure 57: Schematic of lever prototype...100
Figure 58: Schematic of bowing shim prototype... 101
Figure 59: Schematic of SMA AMP device Version 1...102
Figure 60: Schematic of Macor pulley...103
List of Tables
Table 1: Performance requirements for linear actuator. ... 22
Table 2: Recorded AP values throughout second in-vivo procedure. ... 45
Table 3: Properties of compounds used to mold the L V ellipse. ... 55
Table 4: Results from force measurements ofLV ellipse...60
Table 5: Summary of design criteria for SMA prototype...63
I
Introduction
1.1
Addressing Problems of Heart Disease: The Case of Ischemic
Mitral Regurgitation
Ischemic mitral regurgitation (MR) is a common complication of ischemic heart disease.
A patient suffering from ischemic heart disease will often develop a region of weakened tissue where the heart is deprived of oxygen. This weakened area tends to bulge outwards under normal
bio-mechanical stress. When this bulging area is located on the left ventricle (LV), the papillary muscles (PM) on the LV's endocardium are displaced and will often tether the leaflets of the mitral valve, preventing them from coapting and causing regurgitation back into the left atrium (LA)[1]. The physiology of the mitral valve is shown in Figure 1. This process of LV remodeling can lead to serious complications. Significant MR develops in one quarter to one third of patients who suffer from ischemic heart disease and doubles their late mortality rate after a myocardial infarction or revascularization[2,3,4].
Figure 1: The mitral valve.
Figure 2 shows an image taken with an echocardiograph of a sheep suffering from MR.2
The echocardiograph assigns colors to blood flow vectors. In Figure 2, the red color indicates a
flow towards the echo probe while a blue color indicates a flow away from the probe. This
makes it very easy to visualize any backflow through the mitral valve. The tenting of the valve's
leaflets caused by PM displacement can also be seen.
Illustration source: [5].
2 Echocardiography is the staple observation technique for MR.
Anterior annulus Anterior leaflet Anteromedial commissure
Posterolateral comm iss ure
Posterior leaflet
(3 lobes)
Posterior )Chordae tendineaG
annulus
Lateral papillary Medial papillary
Figure 2: Echocardiograph of MR in a sheep's heart[1].
1.2
Current Approaches to Treatment
Approximately 18,000 patients have mitral valve surgery per year[5]. The current
treatments for MR are mitral ring annuloplasty or mitral valve replacement. Mitral ring
annuloplasty involves installing an oval plastic ring around the mitral annulus.3 This plastic ring
has an outer diameter slightly smaller than that of the valve. By suturing the annulus to this ring, the annulus is reduced in size, bringing the valve's leaflets closer together which allows them to
coapt and prevent further MR. The problem with this treatment is two-fold. First, any valve
surgery is both major and relatively high risk. During surgery, the heart must be stopped and the
patient must be placed on a cardiopulmonary bypass pump4 for several hours (average valve
3 Mitral valve's base.
4 Referred to as being placed "on-pump." The cardiopulmonary bypass pump oxygenates the blood and provides blood flow throughout the body to keep the body alive while the operation is on-going.
repair surgery duration is four hours)[6]. Most importantly however, MR often recurs within a year if LV remodeling persists[7,8,9,10].
Mitral valve replacement involves replacing the entire valve with a mechanical or xeno-biological5 substitute. To treat ischemic MR, a mechanical valve is generally used since the new
valve can function independently of any remodeling of the LV. Major drawbacks of this procedure are that it also requires the patient to be placed on a cardiopulmonary bypass pump during the surgery. There are also long-term drawbacks such as the patient needing to take anti-coagulant medication for life to prevent blood clots forming in and around the new valve[1 1]. Both of these procedures are targeted towards the symptoms of ischemic MR. Both disregard the fact that the mitral valve itself is almost always in excellent health. It is simply being tethered open by PMs displaced due to ventricular remodeling.
1.3
Proposed New Treatment
A new approach to MR treatment would be a major contribution to this field of research.
Experiments performed at the Cardiac Ultrasound Laboratory at the Massachusetts General Hospital (MGH) point to a new type of therapy for LV remodeling[1]. The idea of correcting ventricular remodeling with the application of an external mechanical device was tested. A Dacron6 mesh was sutured onto a sheep's LV and a balloon was inserted under the mesh. The balloon was then filled with water, creating an indentation in the LV at the location of the PMs. This realigned the PMs with the mitral valve which allowed it to close more completely and had
5 Usually a pig's or cow's valve is used as a replacement.
6 Dacron is a brand of polyester fiber with high tensile strength, and is resistant to stretching and degradation by
a significant impact on MR. The problem with this static mechanical solution is that it increases
the stiffness of the LV wall and also reduces the LV's blood intake volume. This countered some
of the improvement in overall heart-pumping efficiency achieved by the MR reduction.
The MGH experiments highlight the need for an active device to compensate for
pumping inefficiencies due to MR. Ideally an active mechanical device on the heart's epicardium
would be able to create an indentation to displace the PMs during cardiac systole and then retract
during diastole so as not to obstruct the LV's inflation. The ultimate goal would be to create a
"patch" made from an artificial muscle technology. Such a patch could be applied directly to the epicardium and would both relieve MR and also increase the pumping force that a damaged LV
can generate.
1.4
Study Purpose and Scope
This thesis presents the design and early development of an artificial muscle patch
(AMP) device to treat MR. Chapter 2 covers the development of an AMP simulation device
designed for use during a series of in-vivo experiments to proof the concept of an AMP. Data
gathered during these experiments concerning the pressure and motion requirements of an AMP
device is also presented. Chapter 3 discusses the development of an in-vitro model to test present
and future AMP device iterations. Chapter 4 covers the development of an AMP device based on
shape memory alloy, an artificial muscle technology. The final chapter summarizes progress
2 AMP Device Simulation
2.1
Background
While a static patch had been shown to alleviate ischemic MR and was a relatively
simple device to construct, the function of this patch was not very complex. Data from the Cardiac Ultrasound Laboratory experiments with static patches also focused on the qualitative
analysis of the static patches' effects on the MR under observation. Few data exist on the extent
of myocardial displacement that the static patch was effecting or the force required to do so. Furthermore, no data were available on the timing and speed of actuation that an active patch should have relative to LV systole. Attempts to design an artificial muscle-based device from
these incomplete data would have required too much guess-work to establish the device's
operating parameters, leading to many failed attempts that would be both time consuming and
require the needless use of test animals. It was therefore decided that an artificial muscle patch
simulation device should be constructed in order to proof the concept of active patch therapy and to gather as much quantitative data as possible to develop the missing design criteria required for the creation of an AMP device.
2.2
AMP Simulation Apparatus
In order to make the data gathering results as reliable as possible, a mechanism for
effecting change to the LV wall having the least amount of variables was selected. Continuing
along the same lines as the Cardiac Ultrasound Lab's previous method[l], a fluid-filled balloon
portion of the device would be a fluid pumping system (FPS) capable of receiving gated signals
from the test animal's heart and of filling and emptying the balloon at very high rates.7 An
electronics package also had to be developed to receive a signal either from an electrocardiogram
taken directly from the test animal's heart or from an internal LV pressure monitor already in
place in the operating room, and transform this signal into a digital triggering pulse recognizable
by the fluid pump. The final element of the instrument was a series of sensors to measure the pressure applied by the balloon to ensure sufficient displacement of the myocardium to relieve
MR.
2.2.1 On-Heart Elements
The Cardiac Ultrasound Laboratory's original balloon patch device was held in place
using a Dacron mesh sutured to the LV wall. This setup was satisfactory for a static device but
unsuitable for an active device, where its constant motion would cause location shifts. This
would not have provided good results since the effect of the patch observed in the Levine
experiments was very dependant on its location[1]. In order to solve this problem it was
necessary to build a frame, referred to as a base ring, which attached to the balloon and would be
in turn sutured onto the epicardial wall of the LV. A balloon that could be connected to the fluid
line coming from the pumping system would then have to be designed to properly fit into the
base ring.
7 Systolic contraction of the LV lasts approximately 180 ms for a heart rate of 2Hz (120 bpm) (standard heart rate for a sheep during an in-vivo procedure)[12].
2.2.2
Base Ring Version 1
The first iteration of this base ring was designed to hold a circular-shaped balloon. Its
parts were modeled in CAD (Figure 3a) then machined on a HAAS 3-axis CNC mill from 1.5
mm thick stainless steel sheet stock. Figure 3b shows the machined bottom two layers of the ring
assembly. Dimensional schematics can be seen in Appendix A, Figure 49.
a) b)
Figure 3: a) CAD assembly of Base Ring Version 1; b) Photo of machined main components of Base Ring Version 1.
Based on the design and preliminary machining, and in consultation with the
cardiologists at the Cardiac Ultrasound Laboratory, it was decided that an oval-shaped balloon
8
would be more successful. As a result, further development of this iteration was halted before
completing any other element of this base ring design.
8
This decision was based on the Cardiac Ultrasound Laboratory's previous experiments using a static patch[1]. The longer oval balloon covers a greater area of the LV's epicardium thus reducing the difficulty in trying to align the balloon precisely with the PMs. It also does not deform a single point of the epicardium as much as a smaller round balloon would which would put less stress on the base ring's sutures.
2.2.3
Base Ring Version 2
In order to accommodate an oval-shaped balloon, a new base ring was constructed with
the appropriate shape. This iteration used a design and method similar to that used for version 1.
This oval base ring was designed as a three-layered device held together by Ml screws. Slots
were machined into the bottom layer's periphery to provide an easily accessible edge. This edge
could then be used to suture the assembly to the heart. The top layer was an oval 2.5 mm wider
than the periphery of the bottom layer's cutout. Its center was also partially milled out to provide
extra space for the balloon. The middle layer consisted of an oval ring segmented in two to allow
the balloon to be fitted and clamped between the top and bottom layers. Figure 4a shows the
CAD assembly of the oval base ring. Figure 4b shows each individual machined part while Figure 4c shows the final machined assembly. Dimensional schematics can be seen in Appendix
A, Figure 50.
a) b)
2.2.4
Balloon
Once the oval base ring was complete, a balloon of the same dimension as the ring's
inner cutout was assembled. The insert of the balloon was a nylon tube fitting that was ground
down to fit inside of the Teflon PFA tube coming from the FPS. The balloon material was taken
from two intra-aortic balloons provided by the Cardiac Ultrasound Laboratory. The intra-aortic
balloons measured 200 mm in length but only 85 mm from the tips down were used. Wet Surface
Gap Filling epoxy was applied to the threaded end of the nylon fitting, which was then inserted
into the open base of the balloon section. 250 pm wire was then wrapped tightly around the
portion of the balloon mated to the nylon fitting. Finally, flexible urethane epoxy was generously
applied on top of the wire and on the edges of the mated balloon section to cover any sharp edges
or wire endings. Figure 5 shows the assembled balloon. Two were built to ensure that at least one
of the assembled balloons would work properly.
2.2.5
Assembly
Once the oval base ring and balloon were completed they were assembled in two steps.
The balloon was inserted between the two middle sections of the oval ring, and then the ring's
top layer was placed into position and secured by tightening the nuts on the M1 screws. Figure 6
shows the assembled on-heart portion of the simulation device.
Figure 6: Photos of the fully assembled on-heart assembly.
2.2.6 Fluid Pumping System (FPS)
In order for the system to function properly, the fluid pumping system would have to be
gated to the systolic portion of the LV's contractile cycle. As previously mentioned, systole
occurs over a 180 ms period in a test animal with a 2 Hz (120 bpm) pulse[12]. This meant that
the balloon needed to be filled and emptied in approximately 200 ms. This placed very high
mechanisms. The combination of a linear actuator pushing a syringe was chosen as the best option given these requirements.
2.2.7 Linear Actuator
In order to select a linear actuator, calculations of force and velocity requirements had to be performed. The volume required to fill the balloon that would be attached to the heart was taken from the Cardiac Ultrasound Laboratory's prior in-vivo experiment using a similar-sized
balloon. On average, a balloon filled with 11 mL was successful at relieving MR[ 1]. Assuming a syringe inner diameter of 20 mm,9 the linear actuator needed to have a travel of approximately
40 mm in order to displace the proper amount of fluid.10 This number was increased to 150 mm
in order to have the option of using a syringe of a different diameter at a later time. Using these assumptions, calculations were performed based on an estimate of the maximum pressure required to displace the LV and on the Poiseuille Flow equation for the pressure drop across each section of tube (Equation (1)) to determine the maximum force that the linear actuator would need to produce to meet the requirements of this application. The entire calculation is shown in Appendix B.
12-p -Q -L
AP := + a-p -L
(1)7 -R
A summary of the linear actuator requirements is shown in Table 1. All values were obtained from calculations shown in Appendix B.
9 Estimate based on available syringes.
REQUIREMENTS Length of Travel Force Output Acceleration (under 110 N Table 1: Performance VALUE 150 mm -110 N load) >10.84 m/s2 requirements for linear actuator.
Possibilities were narrowed down to three manufacturers: Parker Daedal[13],
Aerotech[14] and Linmot[15]. The Linmot actuator was selected because of its superior
price/performance ratio. Although its positional resolution of 100 tm was inferior to its
competitors, it was still well within the tolerances for this application. Figure 7 shows the Linmot
PSO1-37x240 linear actuator.
Figure 7: Photo of the Linmot PS01-37x240 linear actuator used in simulation apparatus.
Another interesting feature of the Linmot actuator's controller is that it allows the user to
create custom-shaped position versus time waveforms for the Linmot linear actuator to execute.
These waveforms can be easily modified within the Linmot controller's software interface, permitting modifications during the in-vivo procedure. This was especially useful since the LV's
systolic and diastolic cycles are not of the same duration.1 This feature made it possible to adjust
the position of the actuator at any given time to better match the characteristics of the test animal's LV cycle characteristics.
Finally, the Linmot controller directly accepts a TTL1 2 triggering signal. This meant that
a substantial amount of programming could be bypassed by simply creating a hardware electronic trigger'3
connected to a heart monitoring instrument.
2.2.8
Syringe and Mounts
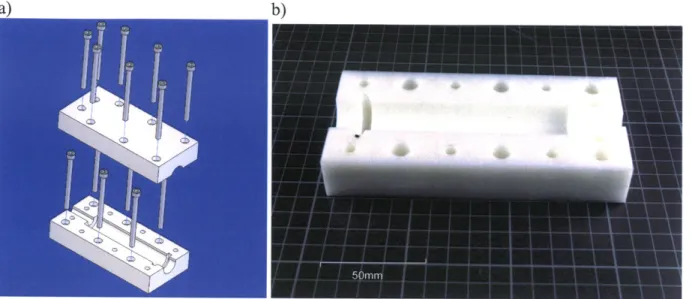
A Popper & Sons Perfektum 50 mL glass syringe[16] was chosen for the water handling portion of the pumping system. Its smooth action provided very little friction resistance and it was rated for high-pressure applications.14 The syringe needed to be seated within an
immobilizing mount to ensure that the Linmot actuator did not apply any significant off-axis force to the syringe's plunger. Otherwise the actuator accelerating at 50m/s 2 would quite easily
have shattered the syringe. Because the life expectancy of the syringe in this system was also unknown an all-encasing mount was built to contain any critical failure. The syringe body was measured and the mount was machined from two pieces of 25.4 mm thick Delrin. Since there
was a significant amount of variability in the syringe's exterior dimensions a certain amount of sanding and filing was necessary for the mount to accommodate more than a single syringe. Figure 8a shows the CAD assembly of the syringe mount. Figure 8b shows one of the machined halves of the mount. See Appendix A, Figure 51 for dimensional schematics.
11
I Systole occurs over approximately 80 ms, diastole over approximately 130 ms for a 2 Hz (120 bpm) heart rate.
Transistor-Transistor Logic (TTL) - A circuit element characterized by its ability to switch between high on-state
to a low off-state.
13 Details covered in the Electronic Gating System section on page
25. 14 No data were available on its maximum pressure capacity.
b)
Figure 8: a) CAD assembly of Perfektum 50 mL syringe mounts; b) Machined Delrin component of
Perfektum syringe mounts.
Once the mount was completed, a coupler also needed to be machined to join the syringe plunger to the Linmot actuator. The coupler was built in the same style as the mount. Figure 9a shows the CAD assembly of the syringe-actuator coupler. Figure 9b shows the machined top and bottom halves of the coupler. Dimensional schematics are available in Appendix A, Figure 52.
a)
Figure 9: a) CAD Assembly of syringe-actuator coupler; b) Machined Delrin components of syringe-actuator coupler.
2.2.9
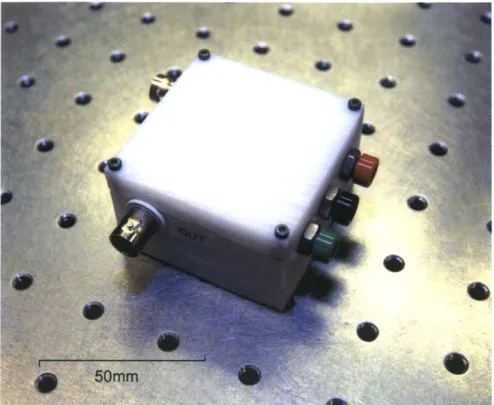
Electronic Gating System (EGS)
The next requirement was that the fluid pump be "gated" to the LV's systolic cycle. Since the Linmot controller was capable of accepting a 10 V TTL triggering signal, a hardware-based electronic trigger was constructed to produce this signal from a heart monitoring instrument's output.
The electronic gating system (EGS) was constructed around an MC14106BCP Hex Schmitt trigger, an integrated circuit (IC) that produces a high output signal in its rest state but switches to a low output state once the input signal passes the trigger's threshold.15 Since the
input signal would be relatively small, a non-inverting amplifier was placed in front of the trigger to boost the signal's voltage. A potentiometer was placed in this amplifier to enable it to accept a
The exact threshold depends on the Schmitt trigger's supply voltage. In this case, a supply voltage of 10 V was used making the triggering threshold 5.9 volts.
wide range of input signals and also to adjust the triggering sensitivity of the EGS. An inverter
was placed after the trigger to provide a positive output signal and an amplifier was placed after
the inverter to adjust the output signal's voltage to 10 V. Figure 10 shows a circuit diagram of
the EGS. 2MQ I 0kQ 2kQ 5k 10 ~ M[14106B[P I C Heart LM741 _M741 M4 Trigger SignaL- + +VCC Output Input -VCC
Figure 10: EGS circuit diagram.
The circuit was soldered together onto a 45 mm by 45 mm prototype board and placed
into a custom circuit box machined from Delrin. Female BNC connectors were installed in the
Delrin box and connected to the input and output of the circuit. Female banana jacks were also
installed on the box to accept the power supply lines for the circuit elements. Finally, a threaded
bolt was inserted in the bottom of the box to allow it to be screwed down into an optical table.
Figure 11: Machined DeIrin EGS circuit box.
2.2.10 Sensors and Data Acquisition
Finally, sensors were added to the AMP simulation apparatus in order to gather data on
the active patch's force and extent of displacement. Two sensors were inserted into the path of
the fluid line between the fluid pump and the balloon. A flow meter was placed in series at the
syringe's output to measure the flow of water while the FPS was pumping. A pressure transducer
was placed in parallel with the pump-to-balloon line to measure the pressure inside of the fluid
line. The internal line pressure varied cyclically when the FPS was active but the pressure
transducer would pick up any external pressure applied to the balloon. During the in-vivo
procedure, this rise in internal line pressure corresponded to the pressure required to displace the
LV wall. This last could be calculated from the recorded pressure using the Poiseuille flow
The two sensors' outputs were in the form of a voltage signal on a 0 to 5 V scale. Both
were connected through a BNC-2 110 connection box to a National Instruments 6062E Data
Acquisition (DAQ) card in a laptop computer. A Visual Basic interface16 developed in Visual
Studio .NET[17] was used to control the DAQ card's recording functions.
2.2.11
Apparatus Assembly
Each element of the simulation apparatus was mounted onto a 900 mm by 600 mm
optical table and the elements connected together. Tube sections between the syringe and sensors
were kept to a minimum length, Teflon tape was applied to all threaded sections of NPT-tube
connectors and gap-filling epoxy was applied to all tube connections to ensure that no air would
infiltrate the line. Finally, a im length of Teflon-PFA tube was used to connect the apparatus to
the on-heart assembly. Figure 12 shows the simulation apparatus fully assembled.
Figure 12: Simulation apparatus mounted onto its optical table.
2.3
In-Vivo Experiment
I
(Performed June
1 5th,2003)
2.3.1
Background and Preparation
Preparation for the in-vivo procedure began 12 weeks prior to the procedure date.17 The
sheep under observation had certain coronary arteries ligated to obstruct blood flow to the LV
and create an infracted area. The sutures used to ligate the coronaries were left in until the
in-vivo procedure so as to better reproduce the characteristics of a chronically infracted LV. This
preparation was conducted by Dr. Luis Guerrero of the Cardiac Ultrasound Laboratory.
In the days prior to the in-vivo procedure, a series of tests were carried out to gauge the
FPS's performance under various conditions that might be encountered during the upcoming
in-vivo procedure. It was decided to use a k/2 sine wave as the position versus time output
waveform for all tests. The amplitude of the waveform was used to modify the volume pushed
into the balloon by the actuator while the speed of each pumping action was controlled by the
period of the sine wave. The Linmot controller's software was especially useful for testing the
FPS's limits this since the actuator possessed internal encoders that the software used to plot the
output waveform against the actual position of the actuator. This made it possible to detect what
maximum heart rate and volume displacement were possible without the actuator lagging or the
fluid lines taking in air bubbles.1 8 Most importantly, baseline pressure variations for the system
pumping at different volume displacements were recorded. It was necessary to do this prior to
the experiment since the balloon device would immediately be sutured to the sheep's LV once
the procedure began. These baseline data would be used in post-procedural data analysis to
17 While the standard preparation time for a chronic model infarct study procedure is eight weeks, due to difficulty
in obtaining all of the simulation apparatus equipment, a four-week delay was incurred. This delay would not have affected results.
18 All fluid line connections were sealed with silicone and/or water-rated gap-filling epoxy, but it was discovered
that when the actuator passed a certain operating frequency the integrity of the connections was compromised by the intense pressure variations and air would infiltrate into the fluid lines. Below this frequency, no significant air infiltration was detectable.
compare baseline pressure variations in the fluid line with the pressure variation when the balloon was applied against the LV.
The wiring and equipment of the simulation apparatus was simplified as much as possible as the entire setup needed to be brought to the Cardiac Ultrasound Laboratory at MGH for the procedure. The optical table where the pumping system was bolted was placed on top of a cart with all of the support equipment (power supplies, Linmot controller and oscilloscope) placed on the carts lower shelf.
2.3.2 Summary of Procedure
The actual procedure lasted approximately six hours. The equipment described above was transported to MGH, all electrical connections were made and the fluid line was filled with water to remove all air from the system. During this time, the sheep was brought into the operating room, sedated, prepped and its thoracic cage was opened to expose the heart. At this point the sheep's heart required two hours of preparation (discussed in the following section). The cart was then brought into the OR, the EGS was connected to an EKG monitor and the balloon device was sutured onto the sheep's LV wall. Tests were run with the FPS used first to statically fill the balloon and record the pressure produced against the balloon by the heart's pumping. This also
served to see what volume of water had to be pushed into the balloon to produce a significant change in MR. Once this was complete, the system was set to pump on trigger. Figure 13 shows the on-heart elements sutured to the sheep's LV.
Figure 13: On-heart elements sutured to LV epicardium during first in-vivo procedure.
After approximately 4 hours of testing, during which the sheep fell into cardiac arrest and
required defibrillation to re-stabilize, the sheep's heart function had become too weak for any
further experimentation data to be reliable and the procedure was halted.
2.3.3
Issues Encountered
It was discovered immediately after opening the sheep's thoracic cage that its heart had
not developed the extent of ischemic MR required for the experiment. Two more coronary
but it was sporadic and the sheep's heart function became quite weak due to the added trauma of a second ligation procedure. This made all observation of MR during the procedure problematic and generally cast doubt on the validity of the results obtained.
Another minor issue was the source of the EGS triggering signal. Shortly before the procedure it was decided to take the triggering signal from the heart's sinoatrial (SA) node by attaching a lead directly to it. This should have produced a trigger signal that was approximately 30 ms before LV systole[12], giving a certain buffer of time before the FPS needed to be activated. Once in the OR, however, receiving a clear signal from the SA node or from the LV was difficult therefore the EGS was connected directly to an EKG monitor through a BNC cable. Finally, the balloon's base ring was not the ideal shape for such a procedure. The pocket where the balloon was sitting was too deep, which restricted the balloon's maximum protruding distance into the LV. In order to achieve some level of MR relief it was necessary to place a 5
mm thick backing made from electrical tape to further extend the balloon. Figure 14 shows this addition to the base ring.
2.3.4
Data Acquired
Many different volumes and frequencies were tested by adjusting the output waveform's
characteristics. Pressure and flow data were recorded for each waveform used. Because of the
poor condition of the test animal, none of the echocardiograph recordings were of particular
benefit. Since persistent MR could not be established, it was impossible to discern whether the
apparatus was performing according to theoretical predictions. The most relevant data extracted
from this procedure were related to the simulation apparatus itself. Recordings of the linear
actuator's actual position versus its demanded position (X/2 output waveform) were taken while
the on-heart elements were sutured to the LV epicardium and the FPS was pumping on trigger.
The actual position did lag significantly when the output waveform was set to a period of 250 ms or shorter, but this speed of actuation did retract the balloon before the end of systole. Once this
was observed, the waveform was rejected. A waveform with a period of 400 ms was found to work best.19 Figure 15a shows the actuator's lag with the 200 ms period waveform. Figure 15b shows that the actuator still lags slightly behind the demand waveform. This confirms that there is a certain variation introduced by the actuator in the timing of the balloon's inflation within the operating range used during the procedure.
a) b)
200bs Period Waveform 4ms Output Waveform -Aod Psvt
35- --Pe-d1-iie 25 30 225 220 10 10 -0G 50 100Tmem 15 200 0 50 100 150 20 250 300 350 400
Figure 15: Comparison of X/2 output waveform versus actual actuator position: a) 200 ms period waveform;
b) 400 ms period waveform.
Pressure and flow data were also recorded both before the on-heart elements were sutured
to the LV and while they were being tested. The flow data obtained showed that the sensor
lagged significantly behind the FPS' actuation. This was due to the inability of the flow sensor's
turbine mechanism to keep up with the rapid changes in flow rates and directions being
produced. The pressure data were not reliable because of the aforementioned issues encountered
during the procedure. They were therefore discounted from further analysis.
2.3.5 Discussion of Results
As previously discussed, the state of the sheep's heart was such that most if not all of the
MR-affecting data are suspect since persistent MR could not be established. It was impossible to
tell if the MR was actually being relieved by the balloon device's inflation or if improvements
were due to temporarily-improved heart function. As such, no conclusion about the balloon's
Despite its limitations, several significant pieces of information were extracted from this procedure. First, the linear shape of the base ring unnaturally distorted the LV's shape while the LV was at rest. All of the surgical staff agreed that a base ring better fitted to the heart's curvature would improve both device and heart function.
Another valuable observation was that the output waveform executed by the FPS needed to be optimized to better match the LV's motion. The k/2 sine wave used failed to account for the delay due to inertia that occurred during the transition between systole and diastole. This resulted in a premature retraction of the balloon prior to the completion of the LV's contraction and allowed some MR to occur before diastole. Overall, the k/2 sine wave was not ideal for this application since its adjustability was limited. An increase in the period would lengthen the balloon's total inflated time but would also increase the delay before the balloon was at full inflation. A waveform with a rapid rise followed by a plateau at the balloon's full inflation level and a rapid drop would have better followed the heart's actual movements.
Another element that caused some data discrepancies was the use of an EKG signal as the triggering signal for the EGS. The EKG waveform was erratic which caused the EGS to sometimes trigger the FPS too late or not at all. A better source for the triggering signal would have to be found for the ensuing in-vivo study.
In light of these shortcomings, the pressure values obtained during this in-vivo experiment are unreliable. By changing the output waveform, base ring configuration and timing of the FPS' activation, this value could vary significantly. Another experiment addressing the above issues was performed to obtain more credible data.
2.4
In-Vivo Experiment 2 (Performed August
11t,
2003)
2.4.1
Improvements to Instrumentation
For the second in-vivo experiment, all of the lessons learned in the previous in-vivo
procedure were used to improve the simulation apparatus. The most important change to the
device was the creation of a new base-ring design. This new base ring held the balloon much as
the original ring had but its suturing loops were extended away from the balloon in its long
direction to reduce the amount of stress placed on the sutures when the balloon was inflated. The
ring was also curved to approximate the LV's exterior contour. This design was built on a
Stereolithography machine (SLA) and had only two parts. The first was an oval frame with four
arms extending from the oval's ends. These arms ended with small oval loops where the sutures
could be attached. The second part was a backing that fit on top of the oval frame to hold the
balloon in place. Figure 16 shows the CAD assembly of the new base-ring design.
Based on the first in-vivo study's experiences and on the general unpredictability of
biological systems, an entire series of frames and backings with different characteristics were
prepared so that the best-fitting frame and backing could be fitted to the new test animal's heart.
Various frames were built with suture loops extended outwards to different distances and with
extending arms arrayed in asymmetrical configurations. Curved protrusions were added to a
series of backings in order to increase the maximum depth of indentation that the balloon could
effect. Backings with protrusions ranging from 2 to 5 mm were prepared. Finally, two sets of all
frame and backing designs were built, each with a different curvature. Figure 17 shows the entire
series of devices prepared for the procedure. Dimensional schematics can be seen in Appendix
A, Figure 53 and Figure 54.
a) b)
Figure 17: Series of devices prepared for second in vivo procedure: a) Base frames; b) Backings.
Improvements were also done to the FPS' output waveform. A new waveform
configuration was created to replace the k/2 waveform from in the first experiment. This new
the waveform. A plateau was inserted into at the waveform's maximum amplitude to extend the balloon inflation period. This waveform was custom configured for this particular application. Due to the time required to make adjustments to this waveform, a series of preconfigured
waveforms were prepared prior to the in-vivo experiment. These waveforms varied in inflation
and deflation time (30 ms to 50 ms) and also in the length of their plateau (50 to 200 ms). Figure
18 shows an example of one of the output waveforms.
Output Waveform --Output Waveform 35-30 E 1 25-0 0 0 S2015 - 10-0 100 200 300 400 500 Time (ms)
Figure 18: Output waveform prepared for second in-vivo study.
2.4.2
Summary of Procedure
Logistically, the second in-vivo study proceeded in the same way as the first. The
sheep was brought into the OR and prepared. The sheep's heart was examined by echocardiography before beginning any testing. It was observed that the sheep had developed a much more significant amount of chronic MR than the previous test animal. The base ring frames and backings were arrayed before the surgeon, who chose the best fitting pair for the test animal's heart (Figure 17, frame number 3 and backing number 3). The on-heart assembly was then sutured onto the LV and connected to the FPS. The EGS input was connected to an LV pressure monitor that received its data from a Millar catheter20 [18] inside of the LV. This
provided a signal directly related to the motion of the LV. Although the use of this signal meant that the FPS would activate when the LV was already beginning systole, the clarity of the signal from the Millar catheter outweighed the slightly delayed triggering of the FPS. Furthermore, the ability of the linear actuator to accelerate extremely rapidly2 1 was used to compensate for the late
triggering. Figure 19 shows the EGS' trigger output and the Millar catheter input.
20 A Millar catheter is a pressure measuring device that consists of a pressure transducer placed at the distal end of
the catheter. This allows the transducer to be inserted directly into the LV to obtain precise LV pressure measurements.
21 The Linmot PSOI-37x240's maximum acceleration is 268
m/s2 .
Trigger Outnut versus Millar Catheter Innut 1.2-1.1 - 1-0.9 - 0.8-0.7 -0.6
-Figure 19: EGS trigger output from Millar catheter input.
Initial tests were performed to determine the balloon inflation volume required to affect
the sheep's MR. Once this was determined, testing began with the EGS controlling the FPS.
Figure 20 shows the on-heart elements sutured to the sheep's LV while the balloon is at full
inflation.
100 200 300 400 500
Time (ms)
CL
0
-Millar Catheter Input
- Trigger Output 12 11 10 9 8 7 6 5 4 3 2 -1 0 600 700 800 900 1000 C) 0 0. 4) I-U05
Figure 20: On-heart elements sutured onto LV epicardium during second in-vivo procedure.
2.4.3
Data Acquired
The same tests were performed during the second in-vivo study as in the first procedure.
The output waveform and actual position were plotted while the FPS was pumping on trigger to
verify that the actuator did not lag behind its demand position. Figure 21 shows that the actuator
600 800
Time (ms)
1000 1200 1400
Figure 21: Comparison of output waveform demand position versus actual actuator position for second in-vivo study.
Pressure and flow data were again recorded to measure the balloon countering pressure
(BC pressure (PBc)) of the LV with the new simulation apparatus configuration. Figure 22 shows
the pressure measurements taken while the FPS was pumping on trigger before suturing the
on-heart elements to the sheep's LV. They provide baseline data for the FPS's function independent
of any contribution from the LV wall against the balloon's surface. Figure 23 shows the pressure
measured after the on-heart elements were sutured onto the LV epicardium. Flow data were also
taken for the first few series of measurements but a malfunction in the flow sensor prevented
further data recording. Fortunately these data were not critical to the performance analysis. Linmot Demand Versus Actual Position
-Actual Position -Demand Position 40 35-30 25 .2 0 01 20 15-10 0 200 400 1600
Baseline Pressure Variation 200 195 -190 185-- 180-175 --170 Baseline Pressure + Triggering Signal 0 300 600 900 1200 1500 1800 2100 2400 2700 3000 3300 3600 3900 4200 4500 4800 5100 5400 5700 6000 Time (ms)
Figure 22: Pressure (blue) and Trigger Signal (red) with FPS pumping on trigger prior to the on-heart elements' installation (baseline measurement).
6 .5 -4 0 -3 3 -2 -1 -0 T. I0
.1
On-Heart Pressure Variation 200 195 190 185 180 175-170 -165 -160 -155 - 150-0 300 600 900 1200 1500 1800 2100 2400 2700 3000 3300 3600 3900 4200 4500 4800 5100 5400 Time (ms)
Figure 23: Pressure (blue) and Trigger Signal (red) with FPS pumping on trigger and the on-heart elements' sutured on the LV.
Equation (2) was used to calculate the BC pressure (PBc) from the data in Figure 22 and
Figure 23. Variations in pressure (AP) were calculated by subtracting the height of a valley
minimum from the height of the following peak's maximum. The values from a data set were
averaged and compared to the averaged value from the baseline data set to obtain the BC
pressure. The baseline pressure curve was compared in this manner against four measurements
taken during the course of the procedure with output waveforms of different periods. A AP was
calculated for each one and the baseline AP was subtracted from them, yielding a series of BC
pressure values. All AP and PBC values are shown in Table 2. On average the LV exerted 10.31
kPa of pressure against the balloon while the FPS was pumping on trigger.
-I
- On-Heart Pressure - Triggering Signal a-U) 'U 6 -5 -4 -3 0 -2 - 1 n 0 5700 6000-n (PPA(n+ 1) - PVA(n)) n=0 n n I (PPB(n+ 1) - PVB(n)) n=0 n I Average:
Table 2: Recorded AP values throughout second in-vivo procedure.
10.31
The most intriguing observation from the second in-vivo study was that the active patch
device simulator was successful at relieving the sheep's MR. While the system was pumping on
trigger it could be seen on an echocardiograph that the sheep's MR would consistently decrease.
If the system was halted, the MR would return almost immediately. Figure 24 shows an image
recorded on an echocardiograph of the sheep's LV and LA during systole with the simulation
device inactive. The blue plume representing blood returning through the open mitral valve is
quite prominent.2 2
22 An echocardiograph set in color vector mode such as this one displays all flows moving towards the scanning
probe in red and all flows moving away from the probe in blue.
PBC =
(2)
OUTPUT WAVEFORM AVERAGE AP STANDARD PBC
PERIOD (KPA) DEVIATION
Baseline 20.20 0.61
-500 ms -1 33.34 0.64 13.15
500 ms -2 30.17 0.40 9.97
400 ms 26.49 0.37 6.29
Figure 24: Echocardiograph image recorded during the second in vivo study showing prominent MR with the active patch simulation device inactive.
Figure 25: Echocardiograph image recorded during the second in-vivo study showing the AMP simulation device's balloon inflating on trigger with ventricular systole.
In comparison to Figure 24, Figure 26 shows an echo image of the sheep's LV and LA
during systole. The MR plume is not present as it was in Figure 24. The MR was consistently
Figure 26: Echocardiograph image recorded during the second in-vivo study showing relief of MR by the active patch simulation device.
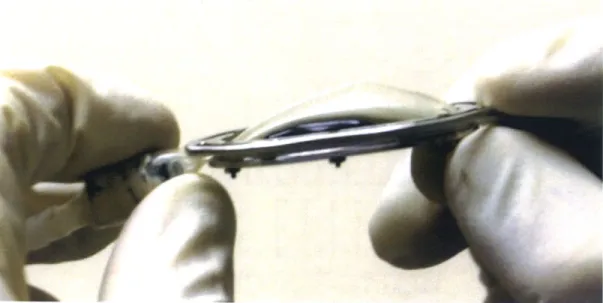
This relief of MR was obtained by filling the balloon with 8 mL of fluid.
Post-operatively, this volume was injected back into the balloon in order to measure the depth of
protrusion that the balloon was creating. Figure 27 shows an image taken with the balloon filled
Figure 27: Balloon filled with 8 mL of fluid.
2.4.4 Discussion of Results
The healthy state of the test animal's heart greatly contributed to the overall success of this second experiment. Whenever the simulation device was inactive, the echocardiogram showed the MR consistently returning to its original level (prior to installing the base ring onto the LV). This made the effects of the simulation device on the MR quite apparent.
Although there was a significant amount of variation in the calculated BC pressures for different attempts, this experiment was very successful in establishing a lower bound for the pressure that an artificial muscle would be required to produce to affect MR in a sheep's LV.
Most importantly, the success of the active patch simulation device at relieving MR in this test animal proves the concept of active patch therapy, one of the major goals of this endeavor.
2.5
Future Research
There are a number of potential uses for the AP simulation apparatus in future research. It
could be used to test various attachment configurations for an implantable device. One of the
important issues to resolve for such a device is what configuration of suture points would
produce the most efficient LV deformation to relieve MR. The AP simulation system could be
used with a variety of base ring configurations to study this problem experimentally. Another
potential avenue of research is into the timing of the FPS activation and duration, which could be
further studied to enhance the output waveform and provide the most efficient MR relief. These
![Figure 2: Echocardiograph of MR in a sheep's heart[1].](https://thumb-eu.123doks.com/thumbv2/123doknet/14092708.464850/12.918.274.615.108.517/figure-echocardiograph-mr-sheep-s-heart.webp)