Artificial Intelligence Impact on Occupations and
Workforce
by
Hazal Mine Kansu
B.S. Quantitative Economics and International Relations,
Tufts University (2014)
Submitted to the Institute of Data, Systems, and Society (IDSS) in partial fulfillment of the requirements for the degree of
Master of Science in Technology and Policy at the
MASSACHUSETTS INSTITUTE OF TECHNOLOGY
September 2019
@Massachusetts
Institute of Technology 2019. All rights reserved.Author Certified by Accepted by MASSACUTS LNSTITUTE OF TECHNOLOGY
JAN
16 2020
LIBRARIES
Signature redacted
Institute for Data, Systems, and Society
IA Augur/t31, 2019
Signature redacted
A V
/Geoffrey
G. ParkerProfessor, Thayer School of Engineering, Dartmouth College Visiting Scholar, MIT Sloan School of Management
- Thesjs Supervisor
Signature redacted
f- Noelle Selin Director, Technology and Policy Program Associate Professor, Institute for Data, Systems, and Society and
> Department of Earth, Atmospheric and Planetary Sciences
;) -5 -w118
by
Hazal Mine Kansu
B.S. Quantitative Economics and International Relations,
Tufts University (2014)
Submitted to the Institute of Data, Systems, and Society (IDSS) in partial fulfillment of the requirements for the degree of
Master of Science in Technology and Policy at the
MASSACHUSETTS INSTITUTE OF TECHNOLOGY
Abstract
Recent developments in machine learning (ML) have persuaded researchers that automated technologies without human intervention may transform occupations across the economy. My research seeks to assess how and where ML will affect the workforce. I extend the ideas of Brynjolfsson, Mitchell, and Rock (2018), who assess each task in the economy for its Suitability for Machine Learning (SML). This paper builds on their summary statistics to provide a more detailed analysis of where ML is likely to have its greatest impact in the economy. Combining their technological suitability data with labor market data, this paper suggests a policy model for better planning labor mobility and allocation of human resources in the face of upcoming technological changes.
Thesis Supervisor: Geoffrey G. Parker
Title: Professor, Thayer School of Engineering, Dartmouth College;
Acknowledgements
I am grateful to the many people who helped me during my time at MIT. I would like to thank my advisor, Professor Geoffrey Parker, for offering me his time, advice, and guidance throughout this process. Thank you also to Daniel Rock for his thoughtful feedback and helpful discussions, and to the MIT IDE family for welcoming me and giving me the opportunity to study Future of Work with continuous support and encouragement. To Barb and my TPP friends for sharing many moments of happiness, celebrations, and adventures over the past two years.
Thank you to my mom and dad for always being there for me, none of this would have been possible without their love and caring. And to Aykut for his advice, patience, and constant faith in me and my
1 Introduction 1
1.1 M otivations . . . . 2
1.1.1 Labor market trends . . . . 2
1.1.1.1 Changes in educational attainment in the U.S. . . 3
1.1.1.2 Changes in labor demand in the U.S. . . . . 4
1.1.1.3 Effect of observed trends on the U.S. workforce . 4 1.1.2 Technological developments in Al . . . . 5
1.1.3 Connecting data to policy . . . . 8
1.2 The Role for Policy . . . . 8
1.3 Labor Economics Perspectives on Technology and Labor . . . . . 11
1.3.1 The canonical model . . . . 11
1.3.2 Skill Biased Technological Change . . . . 12
1.3.3 The task based approach . . . . 13
1.4 D ata . . . . 14
1.4.0.1 SM L data . . . . 15
1.4.0.2 Government data (O*NET and BLS) . . . . 17
2 Analysis of Tasks 19 2.1 SM L score calculations . . . . 19
2.3 Occupation growth and SML scores . . . . 3 Industry Level Analysis: Finance and Insurance 3.1 SML scores by industry . . . . 4 Connecting data to policy
4.1 M issing links . . . .
4.2 Proposed model . . . . 4.2.1 SML scores vs. O*NET automation scores
4.2.2 Skill adjacencies . . . .
4.2.3 Local dynamics . . . . 4.2.4 Other factors . . . . 4.3 Sample analysis . . . . 4.4 Future steps in modeling . . . .
4.5 Public policy recommendations for local governments on their fu-ture of work efforts . . . . 4.5.1 Collect high-quality data about work and workforce . . . . 4.5.2 Utilize empirical models in funding decisions for job trans-fer and training programs . . . . 4.5.3 Build tools to empower employees to make better use of job
market inform ation . . . . 4.5.4 Incentivize companies to increase in-house training efforts. 4.5.5 Build support networks and career pathway systems for
transitioning workers . . . .
5 Conclusions
A The Suitability for Machine Learning Rubric B Additional plots CONTENTS 23 31 31 35 . . . . 35 . . . . 36 . . . . 37 . . . . 39 . . . . 42 . . . . 43 . . . . 43 . . . . 48 48 49 50 51 52 52 54 56 62
List of Figures
1.1 Technology mentions in earnings calls have increased in recent years 7
1.2 PCA correlation for SML task scores . . . . 16
1.3 SML score clusters by job category . . . . 17
2.1 SML scores for highest vs. lowest growth occupations (2016-2026) 21 2.2 Density graph for occupation task scores in finance and insurance 22 2.3 Standard deviation for tasks in highest and lowest scoring jobs . . 23
2.4 Task score dispersion for highest and lowest scoring jobs . . . . . 24
2.5 task score dispersion for highest growth jobs . . . . 24
2.6 task score dispersion for lowest growth jobs . . . . 25
2.7 Task descriptions for highest growing jobs (2006-2016) . . . . 25
2.8 Task descriptions for highest growing jobs (2016-2026) . . . . 25
2.9 task clusters for highest growth jobs (2016-2026) . . . . 27
2.10 task clusters for jobs with highest difference in growth (2006-2016 vs 2016-2026) . . . . 28
2.11 Work activity groups for lowest growing jobs (2006-2016) . . . . . 30
2.12 Work activity groups for lowest growing jobs (2016-2026) . . . . . 30
2.13 Work activity groups for highest growing jobs (2006-2016) . . . . 30
2.14 Work activity groups for highest growing jobs (2016-2026) . . . . 30
3.2 Task score dispersion - finance and insurance . . . . 33
3.3 Density graphs - finance and insurance . . . . 33
4.1 SML job scores vs. expected job growth (2006-2016) . . . . 38
4.2 O*NET job automation scores vs. expected job growth (2016-2026) 38 4.3 Comparing SML scores to O*NET automation scores . . . . 38
4.4 Jobs vs Skills heatmap . . . . 40
4.5 Job distance heatmap . . . . 42
4.6 A number of viable job transfer options for Police, Fire, and Am-bulance Dispatchers with better pay and similar skill requirements 46 4.7 Limited job transfer options for Postal Service Mail Carriers sug-gests more retraining efforts will be needed . . . . 47
B.1 task clusters for lowest growth jobs (2016-2026) . . . . 63
B.2 task clusters for highest growth jobs (2016-2026) . . . . 64
B.3 task clusters for lowest growth jobs (2006-2016) . . . . 65
B.4 task clusters for highest growth jobs (2006-2016) . . . . 66
B.5 Job transfer options for postal service clerks, with better pay and similar skill requirements . . . . 67
B.6 Job transfer options for dispatchers, except police, fire, and ambu-lance, with better pay and similar skill requirements . . . . 68
B.7 Job transfer options for data entry keyers, with better pay and similar skill requirements . . . . 69
B.8 Job transfer options for travel agents, with better pay and similar skill requirem ents . . . . 70 B.9 Job transfer options for reservation and transportation ticket agents
Chapter 1
Introduction
The goal of this research is to explore the susceptibility of occupations in the US economy to near-term disruption from ML technologies, and how the policy makers can better plan for allocation of labor resources in the face of upcoming technological changes.
This work is motivated by the desire to better understand the relationship be-tween skills, job tasks, and occupations and what they mean for the future human labor force. There have been many academic studies to better understand the potential impact of the new technological developments on the economy. On the policy side, many people are working on new policies and strategies to find ways to prepare the workers for potential upcoming changes. However, there seems to be a disconnect between data driven studies and policy makers. Informed policy making could allow better preparation of the current and the future workforce to meet the needs of our changing economy in response to the ever changing inno-vation landscape. As our understanding of how the new technologies will change occupations improves, the potential to utilize data driven insights in policy mak-ing will improve as well. This paper attempts to bridge the gap between academic studies and decision makers who work on future of work policies. Using currently
available data, the paper proposes a model that could improve job transition and training policies regarding future of work, and presents a road map for future analysis when better, more granular data becomes available.
1.1
Motivations
The recent developments and trends that motivated this research project can be presented under three categories: 1) recent employment trends in labor markets that led to income inequality, 2) technological improvements in artificial intelli-gence, 3) current policy options addressing the questions around future of work. This section will provide an overview of these trends.
1.1.1
Labor market trends
The fear of automation and its potential to displace labor have been around for a long time. In 1930, Keynes voiced his concerns over technological unemployment due to labor's inability to catch up with increasing technical efficiency [Keynes, 2010]. While the automation impact on job creation has been positive in long term by leading to creation of more complementary jobs, the short term effects are more mixed, potentially displacing workers [Autor, 2015]. In the past, similar examples of various disruptive technologies replacing human labor in short term led to increased employment by creating more jobs that require similar skills in long term [Mandel, 2017]. Below is an overview of some of the employment trends from the past few decades, and how they may be affected from adoption of new technologies.
1.1 Motivations
1.1.1.1 Changes in educational attainment in the U.S.
There have been vast changes in educational attainment of the US workforce in the last few decades. Both high school and college completion rates have increased: the high school completion rate increased from less than 65% for people born in 1930 up to about 90% in 1950s. For the same period, college graduation rates increased from less than 15% to more than 25% [Acemoglu et al., 2012;
Autor, 2014]. On the contrary, the U.S. experienced a serious slow down of
educational attainment in the 1970s, particularly for males [Gruber, 2000]. While there have been an increase in supply of highly educated workers, the wage dynamics have shown an unexpected trend. Basic economic principles would suggest that the lower relative demand would make the high school educated workforce a scarce resource, causing their wages to increase. On the other hand, increasing supply of college educated people would create competition for a lim-ited number of jobs, lowering their wages. Contrary to expectations the wages for the college educated workers continued to increase, while the wages for the less educated workforce declined [Autor et al., 2019]. The wage gap between high school graduates and college graduates have continued to widen in the 1980s, which then saw a gradual decline and a flattening into the 2000s [Valletta, 2018]. In fact, returns to education fell in the first half of the twentieth century, but rose at the end of the second half [Goldin and Katz, 2007].
Researchers have been trying to identify the potential reasons for the patterns observed in wage trends. A prominent explanation has been the deployment of new technologies changing the need for skilled (college-educated) labor in the workplace.
1.1.1.2 Changes in labor demand in the U.S.
There have been significant changes in industry mix over the past few decades as well. Sales, production, and administrative occupations, which are classified as "middle-skill" positions, have declined as percentage of the overall jobs in the
U.S. Technician and manager positions, which are classified as "high-skill", have
increased, as well as jobs in personal services, care and protection services and labor occupations, which are considered to be "low-skill" jobs [Autor et al., 2019]. College educated workers tend to fulfill the high-skill or middle-skill jobs in the economy, while people who completed high school or less tend to be placed in middle-skill or low-skill jobs.
There seems to be a decline in the available middle-skill jobs in the econ-omy over the last few decades. During this period, people with college degrees in middle-skill positions seem to have moved into high-skill occupations, which implies higher wages as well. However, for people without a college degree who were in middle-skill jobs seem to have taken jobs in the low-skill job categories, which may pay significantly lower wages [Autor et al., 2019].
In addition to the changes in the characteristics of the labor force, the overall labor contribution to the economy has been declining [Autor et al., 2017]. While the causes for this phenomenon remain uncertain, there seems to be an impact from large monopolies leveraging more capital, which implies more resources being spent on implementing new machinery and solutions to leverage new technologies.
1.1.1.3 Effect of observed trends on the U.S. workforce
The trends explained above have real life implications for different groups in the society. For certain subgroups in the U.S. population, especially men with high school education, wage declines during this period have been dramatic [Autor et al., 2019]. In addition, the upward income mobility between generations has
1.1 Motivations
decreased dramatically due to increasing inequality in income distribution, with the rate of upward mobility down from 90% for 1940 birth cohort to 50% for
the 1980 cohort [Chetty et al., 2017].
As the new technological developments are perceived to be a major driver in changes in labor dynamics, understanding what these new technologies are and how they will get incorporated into the workplaces is an important step for this paper.
1.1.2
Technological developments in AI
The idea of creating automated processes to combine knowledge and information to generate new knowledge has been around for a long time. Alan Turing pre-sented this idea in 1950 to identify what we mean by intelligence in humans and how that may be replicated by machines [Turing, 1950]. However, the expensive-ness of the amount of computing power required was a big barrier until recently. In the last 25 years, available computing power per dollar spent has increased by a factor of ten in about every four years, which is the main reason why the scientists were able to start implementing the ideas they have started developing long before [Nordhaus, 2001]. Computers have become faster, cheaper, more ac-cessible, and can store more information. Machine learning algorithms have also improved and people have gotten better at knowing which algorithm to apply to their problem. These improving cost advantages enabled significant successes in Al through the past few decades [Anyoha, 2017].
The increase in pace of Al innovation has been largely attributed to ML as it shifted from computers acting based on codes entered by programmers to methods that enable computers leveraging the potential for accumulated data [Brynjolfs-son et al., 2018b]. Some of the ways in which Al technologies are implemented are not new. For example, the idea of using patterns in available data and identifying
correlations has been around for a long time. However, the increase in compu-tational speed with declining costs and the availability of data from many new data sources (sensors, tools, online etc.) have improved ML prediction models and made them much more effective to complete everyday tasks [Agrawal et al.,
2017].
Recently, we have seen computers beating humans in games and autonomous cars getting closer to becoming part of daily life [Buchanan, 2005; Moldrich, 2018]. Examples include Google's AlphaGo application, Al systems capable of classify-ing diseases as successfully as doctors, and language translations at human-level accuracy 12. These examples also demonstrate that teaching machines could be
more human-like, which means ML systems will be able to improve themselves over time towards unsupervised learning [McAfee and Brynjolfsson, 2017].
The technological improvements in some fields such as image recognition are more rapid than in other fields (e.g. achieving humanlike general intelligence) [McAfee and Brynjolfsson, 2017]. Faster development signal that business ap-plications of these new technologies are on the horizon. Today, the commercial use of these new Al applications is limited. However, frontier companies such as Google are starting to use deep learning in many projects across the firm [McAfee and Brynjolfsson, 2017]. While we have not seen the impact of these new tech-nologies in the workplace yet, industry players are starting adopt some of these technological developments, with many companies testing and incorporating ma-chine learning, robotics, and natural language processing technologies into their business [Shoham et al., 2018]. The yearly report by Al Index shows a steep increase in academic papers published on Al, as well as jobs requiring Al skills.
lhttps://deepmind.com/blog/alphago-zero-learning-scratch/ 2
Yoav Shoham, Raymond Perrault, Erik Brynjolfsson, Jack Clark, James Manyika, Juan Carlos Niebles, Terah Lyons, John Etchemendy, Barbara Grosz and Zoe Bauer, "The Al Index
2018 Annual Report, Al Index Steering Committee, Human-Centered Al Initiative, Stanford
1.1 Motivations
The graph below shows the mentions of Al and ML in earnings calls through the past. 10 years. While the increase in mentions does not indicate adoption of the technologies by these companies, it shows that the companies have these new technologies as part of their agenda, potentially signaling adoption in the near-term.
Company earnings calls mentions -Sum of all
industries (2007-2017) 1000 Artificial o 800 h****"°° 600 MchineLeaing 400 -Big Data 200 -Cloud 0 P I-Year
Figure 1.1: Technology mentions in earnings calls have increased in recent years Source: Prattle, data shared as part of A Index Annual Report 2018
It is also important to note that Al may be a general purpose technology (GPT), which is the type of innovation that generates significant spill over affects and has a broader impact on the economy than just in its direct application areas [Brynjolfsson et al., 2017]. Thus we would expect these breakthroughs to stimulate innovation in areas that are not measurable at the moment, increasing the potential productivity gains to the levels higher than what would be predicted based only on the current technological developments.
1.1.3
Connecting data to policy
Rising wage inequality and increasing automation in the workplace will likely affect many workers in the near future. The spread of technology is uneven 1, which could disadvantage certain groups in the short term while advantaging others, hence further contributing to inequality. Thus, there is a certain need for policy makers to address these concerns in a timely manner.
There are multiple challenges on the research side that present obstacles to accurately analyzing impact of Al on labor, including lack of high-quality granular data on occupational descriptions and job requirements, lack of modeling to better understand substitutive vs. complementary effect of new technologies, and the need for better understanding of how technological change is linked to other market dynamics such as migration and trade [Frank et al., 2019]. However, there seems to be many more opportunities to leverage existing data resources and research in policy making23
The next section discusses more broadly the role of policy in the Al impact on labor. Chapter 4 presents a model which could help policy makers plan their Al policy and worker retraining strategies.
1.2
The Role for Policy
The rapid developments in Al technology have the potential to drastically change employment opportunities. What this change may look like in real life has been difficult to predict due to unknowns about how the new technologies may get implemented in the work place and varying job market dynamics.
'https://www.mckinsey.com/featured-insights/artificial-intelligence/ai-adoption-advances-but-foundational-barriers-remain 2 https://www.theatlantic.com/education/archive/2018/01/the-false-promises-of-worker-retraining/549398/ 3 https://www.nytimes.com/2017/02/23/magazine/retraining-jobs-unemployment.html
1.2 The Role for Policy
The expectations for how Al technologies will impact the economy vary sig-nificantly. Some think that automation will replace many of the existing jobs and limit new job creation, while others expect a big productivity boost that will lead to extensive amount of free time for people working fewer hours [Autor, 2015; Muro et al., 2019; Stevenson, 2018]. It is unclear at this point weather the optimists or pessimists have a better sense of what the job market will look like in the next few years.
The concerns around new technologies and how they may affect jobs and em-ployment are not new to Al [Jones, 2013; Keynes, 2010; Leontief, 1952]. Observing the full impact of the new Al technologies will take time, similar to how other new technologies affected the workforce in the past [Brynjolfsson et al., 2018b]. Also, whether the impact of Al will be the same as other impactful technologies of the past remains as an open question.
Despite the unknowns, there is a role for policy makers to shape how these technologies may affect societies in the near future. There are two broad cate-gories regarding Al that require policy input: the rate of diffusion of Al technolo-gies, and the effects of the diffusion [Agrawal et al., 2019]. How policy makers address these issues will have a significant impact on employment and wage in-equality issues due to technological improvements.
The way new technologies will be adopted in the workplace depends on many factors other than technological feasibility. Based on which application areas emerge earlier and the needs of different job markets, we would expect to see regional and across-industry differences in adoption. Workers in the first adopter industries would be affected sooner, and certain job categories/industries may get affected differently. Even though we expect to see these differences evening out in the longer term, an uneven spread of new technologies in the short term may affect employees across jobs in different ways and magnitude. Adoption will also
be influenced by local labor demand and supply, taxation, and offshoring trends among other factors.
Another unknown is whether the productivity effect from new technologies will propagate growth for a specific job line/industry or whether the substitution effect will be dominant, replacing human labor [Acemoglu and Restrepo, 2018]. The same technology could have different net effects on different job categories due to other factors affecting the labor market.
By weighing in on education policies and business cycles, policy makers may be able to make appropriate adjustments to minimize inequalities [Agrawal et al., 2017]. In the face of upcoming technological changes policy makers will need to address a number of questions including 1) how to deal with the potential unemployment in case the productivity gains from Al prove to be significant and spread fast? 2) how to prevent an increase in income distribution if the a new technology benefits groups of society unevenly 3) if automation does replace human labor, how will people re-purpose their time and energy?
Leveraging available data sources and studies in policy making would lead to better future of work policies. Improvements in data collection would help to eliminate some of the unknowns about the impact of new technologies [Mitchell and Brynjolfsson, 2017]. Governments can use methods that are already uti-lized by the private sector to better understand the changing job market and the skill landscape across different regions. By combining the ability to collect real time digital information with the traditional data sources such as national surveys, local governments can deliver a clear and comprehensive picture of the job landscape, taking a big step to understand the job market issues and identify potential solutions. In the meantime, available data can be used differently to improve decision making, which this paper discusses in Chapter 4.
1.3 Labor Economics Perspectives on Technology and Labor
1.3
Labor Economics Perspectives on
Technol-ogy and Labor
1.3.1
The canonical model
The economic modeling on wage and skills distribution has been based on the idea that the college/high school wage ratio serving as a summary index of the education premium. College educated workers tend to get higher wages relative to non-college educated workers, supposedly as compensation for spending longer time in school gaining advanced skills. The wage difference is determined by the relative supply and demand for these skills [Katz and Murphy, 1992; Tinbergen, 1974].
The basic model to think about returns to schooling or other skill differentials was pioneered by Katz and Murphy [Katz and Murphy, 1992]. The model utilizes a competitive supply-demand model in a closed economy which produces only one good. In this model, the workers are paid based on their respective marginal contribution. This model assumes two types of workers: skilled and unskilled. These two groups are imperfect substitutes, meaning changes in wages do not depend on the relative supply of workers in different groups but on the factor of skills [Autor, 2019]. The production function can be written as follows:
Y(t) = [(Aj(t)L(t))P +
(Ah(t)H(t))P]1/P(1) L(t) stands for unskilled workers, H(t) for skilled workers, and A for changes in technology, with an inelastic supply of workers at time t. Note that this equa-tion ignores the capital factor for now. This funcequa-tion assumes that technologies only augment the productivity of workers and do not substitute them in theproduction process. The model suggests that skilled and unskilled workers are q-complements, meaning the greater supply of one category of workers should increase the wages for the workers in the other category [Autor, 2019]. The in-tuition behind this idea is as follows: a certain, fixed fraction of input from both high skilled and low skilled labor groups is required to generate output. If there is an increased number of workers in one group, there will be room to employ more workers from the other group since the two groups are not perfect substitutes, and skills from both groups are required to generate output. This increase in de-mand would create scarcity on the supply side, pushing wages higher. However, as discussed earlier, the opposite of this trend has been observed in empirical data on wages in the 20th century.
The key result from the canonical model is that when the supply of one labor group increases, the skill premium for that group would fall. However, in devel-oped countries we have seen a steady increase in wages of skilled workers while the supply of skilled (educated) workers continued to increase [Broecke et al., 2018]. While the canonical model seems to explain long term trends relatively well, there are certain periods (1940s and 1970s) where the trends remain unexplained by
this model [Autor, 2019].
1.3.2
Skill Biased Technological Change
One prominent assumption to explain labor market trends in recent decades is an increase in relative demand for the high skilled labor. An explanation for this increase is the sense that new technologies demand more high skilled workers in the workplace. This complementarity between technological developments and the increase in demand for high skilled labor is called skill-biased technological
change (SBTC) [Deming, 2017; Katz and Murphy, 1992]. The skill-biased
1.3 Labor Economics Perspectives on Technology and Labor
more schooling, led to the so-called "race" between technology and supply of skilled labor [Acemoglu and Autor, 2011; Goldin and Katz, 2007].
This framework assumes new technologies introduced to the production sys-tem are factor-augmenting, meaning any technological change has a positive effect on the productivity of at least one skill group [Acemoglu and Autor, 2011]. The assumption ignores the possibility that a new technology may instead substitute some skills attributed to workers, or have a skill-unbiased impact on the work-force, which is one of the missing elements in understanding how employment has been historically affected from technological changes [Goldin and Katz, 1998].
1.3.3
The task based approach
Despite its success in predicting longer term patterns, increasing wage inequality, falling real wages for certain subgroups, employment polarization, and declines in labor share, cannot be fully explained by the canonical model. The task based model helps to improve our understanding of relationships between skills, job tasks, and how new technologies affect workers and their wages.
An understanding of the difference between skills and tasks is crucial to ap-preciate this model. Skills can be defined as a collection of capabilities that a worker gains through schooling or other means of training. Tasks can be defined as building blocks of an occupation; each occupation encompasses a number of tasks that are executed by workers who fall under the respective job title. Tasks are not unique; many tasks are required in multiple occupations. A skill is an ability that a worker can utilize effectively to complete multiple tasks.
In the canonical model, there is a one-to-one mapping assumption between skills and tasks, meaning a worker utilizes one skill to complete one task in the production process. In real life, a worker usually utilizes a combination of her different skills to complete a number of required tasks depending on the job.
New technologies may automate some tasks currently performed by a worker, but automation of a subset of requirements per job does not replace the worker entirely. A task-based approach provides flexibility in thinking about how new technologies may affect labor.
Steps in a production process can be thought of as different tasks that use both capital input (think of machines that are utilized in completing the task) and human labor input. When a new technology is used to automate a task or part of a task, the share of each task per unit production assigned to labor vs. capital changes. The task model enables variability to study these changes. The units of production are identified as tasks that collectively represent what each occupation entails. These tasks can be completed by human labor, capital, trade, or off-shoring [Autor, 2013]. Tasks can also be grouped into categories to better identify which ones could be accomplished by new technologies [Autor et al., 2003]. Enabling regrouping of tasks is a powerful concept as it is in line with the malleable nature of occupations and how they emerge/change/disappear over time [Autor et al., 2019]. This approach will be useful in this paper when discussing job and task adjacencies and potential labor movements from one position to another.
1.4
Data
This paper uses the following datasets in analysis:
o Suitability for machine learning (SML) data collected using the AI rubric
developed by Brynjolfsson, Mitchell, and Rock (2018).
o Data from the Occupational Information Network (O*NET) database
1.4 Data
* Local labor market data for various U.S. cities
A brief description of how different data sources have been used is included
below.
1.4.0.1 SML data
The unique dataset used in this paper is the second iteration of the dataset measuring suitability for machine learning (SML) using the rubric developed by Brynjolfsson, Mitchell, and Rock (2018). The questions were answered for each work activity corresponding to each occupation in the U.S. economy. The goal of the survey is to understand whether each task identified in the U.S. job market today can be completed by a machine learning application.
The first version of the rubric, containing 23 questions, was used in their earlier paper [Brynjolfsson et al., 2018a]. The updated rubric with 21 questions was applied to 2,069 detailed work activities (DWAs) in the Bureau of Labor Statistics O*NET content model for all of the occupations in the U.S. Each DWA was rated on each of the 21 questions on a 5-point scale varying from Strongly Disagree (1) to Strongly Agree (5). The SML rubric questions are included in Appendix A [Rock, 2019]. The respondents were found via Amazon Mechanical Turk. Each DWA was rated minimum at least 10 times in randomized batches [Rock, 2019]. These DWA scores are mapped to 18,112 specific occupation-level tasks defined by O*NET (with equal weighting of each rubric question within a task). These tasks are then weighed by the occupational importance scores provided in the O*NET database to calculate occupational-level SML scores.
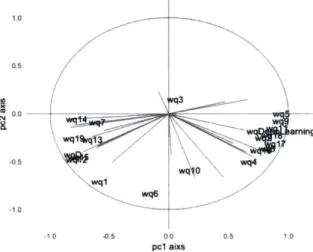
The results of a PCA analysis on the scores at the task level are shown below in Figure 1.2. As seen in the correlation circle, the survey questions vary on one axis, with the first principal component explaining around one third of the
expected as we would like the survey questions to measure the job's exposure to ML impact, with all questions collectively supporting the suitability aspect.
1.0 0.5 N0.0 arninG \ wql~q -0.5 w 0 wq6 -1.0 -1.0 -0.5 00 0.5 1.0 pc1 aixs
Figure 1.2: PCA correlation for SML task scores
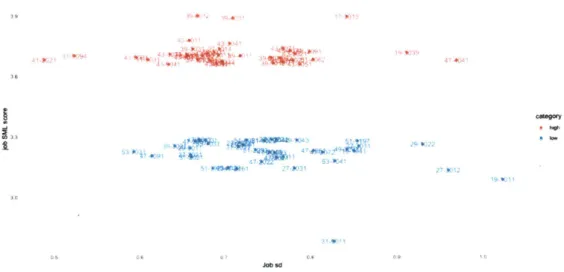
The clusters below in Figure 1.3 are obtained by dimension reduction on sur-vey answers grouped for each occupation, and colored by O*NET job families. The job families are occupations that are grouped based on the required work activities, skills, education, training, and credentials by each occupation. As ex-pected, jobs with similar training and skill requirements tended to cluster together based on their SML scores. Further information on score calculation methods are provided in Chapter 2.
It is important to note the limitations of survey data in measuring the routine-ness of tasks. There may be mispresentation and human error baked into the collected survey responses. In addition, it is a challenge to ask responders to distinguish what is routine from a human's perspective vs. the complexity of automation from the technological perspective. A mundane cleaning task done by a janitor would be distinctly repetitive from the janitor's perspective, but the level of visual recognition and motor skills to be performed by a machine to complete the same task is much more complicated [Autor, 2013]. This survey
1.4 Data
* .. ... 1.. .
1
. - . ... .. Fodipsinndeg • M n
jbg y .Mae .mdEglge M msinm i sm .Bus2g a d 2 2agImmms.Cneuo ndEao
Figure 1.3: SML score clusters by
job
categorytries to avoid such friction through specific questions at work activity level.
1.4.0.2 Government data (O*NET and BLS)
Other data used in this study include data from the O*NET database.
Oc-cupational Information Network (O*NET) is agovernment database that uses standardized surveys to conduct interviews to understand and explain the occu-pations in the U.S. market. The database was mainly established as aguide to
assist people who are looking for
jobs
in their search. Through the website userscan search for
jobs,
skills, tasks, better understand the needs andexpectationsof different
jobs.
O*NET database has also been used by many researchers as acomprehensive standardized index of the U.S. workforce and occupations. The detailed data includes importance and frequency scores for tasks, skills, and work
activities, as well as insights into similarities between different
jobs.
Historical and projection
job
growth data from Bureau of Labor Statistics(BLS) was used to identify any trends between
job
growth and SML scores. TheIn Chapter 4, data from all the data sources listed above are used in combina-tion. The SML survey data was used in combination with the O*NET automation data and labor market data from three U.S. cities: Boston, St. Louis, and Hous-ton. Various data on regional labor demand, wages, and job requirements were used to account for regional differences that needs to be taken into account when using ML suitability metrics in policy making. My model that uses these data sets is explained in detail in Chapter 4.
Chapter 2
Analysis of Tasks
Summary
This section includes an exploratory analysis using the SML scores. The SML scores were combined with job growth projections to identify trends and under-stand which skills/tasks will be on demand given expected technological changes.
2.1
SML score calculations
As explained in the previous chapter, the crowd sourced SML data by Brynjolfs-son, Mitchell, and Rock (2018) provides very granular machine learning suitability ratings for all work activities identified in the U.S. economy.
These work activity scores are used to calculate task level scores for each task identified in the O*NET database. The task level scores are then used to cal-culate job-level scores for each occupation. Multiple methods to calcal-culate the consolidated scores have been tested to account for the varying importance, so-phistication, and frequency of each task in different occupations. Occupational average scores were calculated using 1) equal weights for each task, 2) only
im-portant tasks, 3) all tasks weighted by their O*NET importance scores.
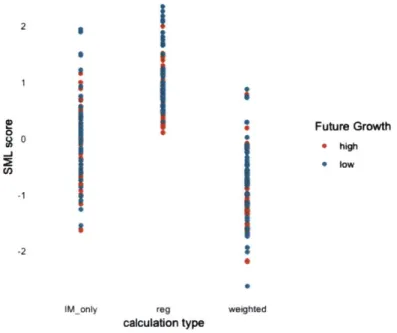
These three score types were matched with job growth projections to identify any trends. The expectation was that the jobs that are more susceptible to ML may have lower future growth. We tested whether one of the calculation methods had a stronger explanation power assuming technological change will be a major driver of future job opportunities. Figure 2.1 below shows the scores based on different calculations. Each data point represents the standardized SML score for an occupation, colored by whether it is projected to be a high growth (top 5%) or low growth (bottom 5%) job. The first column only uses important tasks to calculate the job score, the second column is non-weighted, and the third column includes all tasks weighted by their O*NET importance scores.
There were no identifiable trends distinguishing the different calculation meth-ods. No clustering of of high growth vs low growth jobs on the y-axis was ob-served. I chose to use importance weighted scores for my analyses to account for all identified conponents of an occupation.
2.2
Identifying potential complementarities
us-ing SML scores
While there are some studies on how likely the specific tasks, occupations and industries will be impacted from new technologies, there have not been many attempts in clarifying the kind of impact we would expect to see. A new tech-nology can 1) complement existing work, 2) substitute workers, or 3) have no impact at all. What type of effect we will observe in the workplace depends on many variables including economic incentives, labor market dynamics as well as technological feasibility. This section presents the exploratory work on the path to identify complementing or substituting effects of new technologies.
2.2 Identifying potential complementarities using SML scores 2
8I
1I
Future Growth 0 high 0 lo -1 -2 0IM-only reg weighted
calculation type
Figure 2.1: SML scores for highest vs. lowest growth occupations (2016-2026)
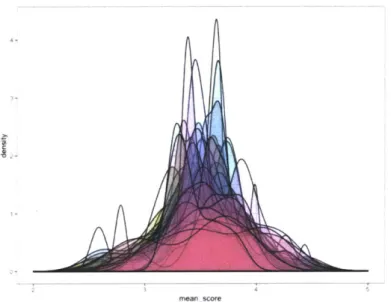
Figure 2.2 shows the task score distribution for each occupation in the finance and insurance industry (industry chosen for visual simplicity). Frequency peaks are visible at different score points for each occupation. The dispersion of scores within a job may suggest complementarity. The score spread may suggest that part of the tasks in a given occupation may be very suitable for ML while the remaining tasks will continue to be carried out by human labor, signaling potential reorganization and regrouping of tasks within or between occupations.
Any patterns we expect to observe in SML data should be easiest to observe for the highest scoring vs. the lowest scoring occupations. Thus the following figures show the highest 5% and lowest 5% scoring occupations for visual simplicity.
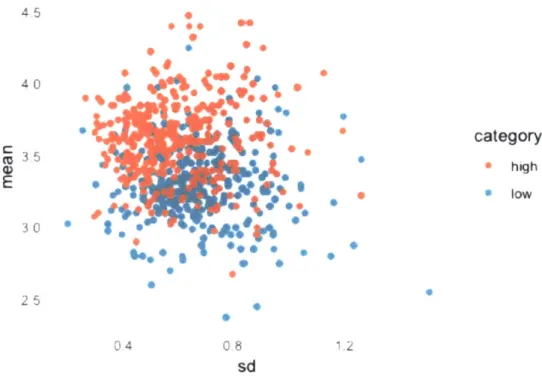
At the task level, Figure 2.3 shows the standard deviation of SML scores for all tasks identified for the highest and lowest scoring occupations. The graph suggests that the tasks in lowest scoring jobs had higher variation in the survey answers. For example, of the 21 questions answered per task, for a given task in
mean_score
Figure 2.2: Density graph for occupation task scores in finance and insurance
a low growth job, some questions may have received 5s (fully automatable) and other questions may have received s (not automatable). Ideally, a task that is fully automatable should have the highest score (5s) for all survey questions, and vice versa. The dispersion in lowest scoring jobs suggests that the answers to the survey were not as strongly supportive of the automation prospects of the task.
Figure 2.4 shows standard deviation vs. SML score for each occupation, taking each answer to survey questions per task as a separate data point. There is significant dispersion in results with an obvious distinction between the high and low scoring jobs.
High scoring jobs with high standard deviation may signal some complemen-tary impact of ML technologies. We would also expect for a perfectly replaceable task to receive same high marks on all questions, with low standard deviation and a higher mean, placed on the upper left corner of the graph. However further analysis and higher quality data is needed to make any inferences as the variance could be due to a number of reasons. The dispersion could also be a reflection of
2.3 Occupation growth and SML scores
lower quality data from surveys.
4,5 0 . .* • 40
*e
category
g
3 5e
high LI,. * low 3.0 2-5 0-4 0.8 1.2Sd
Figure 2.3: Standard deviation for tasks in highest and lowest scoring jobs
2.3
Occupation growth and SML scores
Assuming technological change will be a major driver in employment trends in the future, next we examined SML scores by growth projections. Occupations with higher employment growth projection are expected to hire more workers to meet the market need in completing the tasks of an occupation. Such growth could occur due to an increase in 1) product/service demand, or 2) new emerging tasks increasing labor demand. Higher growth may suggest that any negative impact from technology that could have slowed down employment is outweighed by the need for higher labor input, or that most of the important and relevant
39 3KV 4 3 40131-9094 % 393 -i A high CO 33 A Ia 47MM 5-4 51 -03" 61 27-3031 27-4012 19-90l1 31-901 o s o.6 U 7 0.8 9 Job ad
Figure 2.4: Task score dispersion for highest and lowest scoring jobs
tasks of the job cannot be automated in the next ten years. On the other hand, lower occupational growth could indicate higher chance of deployment of new technologies as opposed to utilizing labor for completing tasks.
The boxplots below show the dispersion seen in task level scores for both high and low growth jobs, suggesting there may be potential for identifying certain types of task groups within these occupations.
Task scores for highest growth occupations
£ E
Figure 2.5: task score dispersion for highest growth jobs
An initial text analysis on the task descriptions of jobs that grew the most in the last 10 years vs. those that are projected to grow the most in the next 10 years showed interesting results. As seen in the word clouds built for the tasks of occupations that grew the most in the past 10 years (between
2006-2.3 Occupation growth and SML scores
Task scores for lowest growth occupstions
Figure 2.6: task score dispersion for lowest growth jobs
2016), the most frequent word was "equipment", while the same analysis for the jobs that are expected to grow the most in the next 10 years revealed that the word "patient" is the most frequently used word in the task descriptions. This is consistent with other studies that identify growing opportunities in care services as opposed to the more prevalent jobs requiring the ability to use certain tools in the past Fujisawa and Colombo [2009].
a dtio"'products logistics su f"se
methods monitor obain
Wmedical §ao tyitiescnnails _jE
~reports
g'coordiriateWO *'O.reoS
results r,
~
C itpartsmaras
enSUre
03._2 6) servicesunedaresensure +- recordst 'Rusedresearcn
~
eet'determine
o
ew oplans-EdatE
Uc
eaususe job S --- eve.ntssiteshan csd.CR
3
")ClientS
plan
T-w SassistE foodconduct StaskSsC
procedures
tests Ce p a i C.ake programstIME 5 tain operfOrm ystems
Ieport 5cleaC°satela , productionpatient
Figure 2.7: Task descriptions for
highest growing jobs (2006-2016)
Papply r m"" _> keep j p - ra s problems se t prkoealns Ctese er a C to ptsc4 . k
fe1dprocedUreS
family TSTodpe~orimcords
2 areas duties test " arearecord~ e
-°dtreatment
.:,detemine
~systemsC~ cae
2 Eassislanceweii lncl rftwork
patients
mEassist
J) N mediCaloc C provide R10Cis e 0useneeds.2-,<eP.aj 2 -,c_ tests plan *
0-r-E - C patient
sWf Eat>eE-therapy; C
repair in Es pedousid
,hi~eang._ te~l qbtajn 'I
required appropate results me aSn E
con ofersr .- i e coordsnutepri
cgf onferes ior - ixiy necessary findingsaE
Figure 2.8: Task descriptions for
highest growing jobs (2016-2026)
Next, we used k-means clustering for the tasks in jobs with highest potential
growth to identify any distinct task groups based on their SML scores. The
2016-2026 are included below. The same clustering methods were used for the highest and lowest growing jobs between 2006-2016 (graphs included in Appendix B).
Cluster plot 229 8495 2gg48 297 Hsg 2 68 337 8 435 5411 3%W 4165 4 1 4 2 298 2 353 2 1 52 p 4 a Is 7 2R6 3726 18848 3 2 238 '547 404M276 773 -20 372 8 1 g 7 594 69 487 544 4464' 510 asa gsao - 6# 71 2 32 169 4 5 1 369 2 511 598 74 516 5 24 38 51 523 5N AMN 38m7;111, 2tr 36 58 -84 296 360 jt 2 7 1 5 sq5532375 229 573 59 5 -2 23 182 6 3 " 328 38 ISO DimI (28.6%)
Figure 2.9: task clusters for highest growth jobs (2016-2026)
207 duster W2 a3 4
0
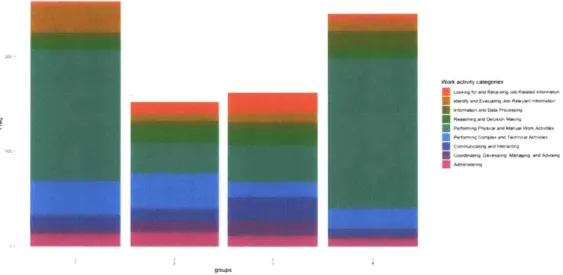
0 a 0 aGrouping clustered tasks into broader categories of work activities was helpful in identifying some trends in high and low growth occupations over different time periods. Figures 2.11-2.14 show these clusters for high growth vs low growth jobs
over two periods: 2006-2016 and 2016-2026.
Below in Figure 2.10 is a graph showing task clusters for jobs that have seen the highest changes in 10-year growth. In this graph we see all task clusters dom-inated by activities that require physical and manual effort, which is consistent with the previously observed trends reducing reliance on manual effort by workers due to automation along with other trends (e.g. offshoring).
Work avity catego s
groups
Figure 2.10: task clusters for
jobs
withhighest difference ingrowth (2006-2016vs 2016-2026)
Comparing work activities for the lowest growth
jobs
in 2006-2016 vs2016-2026 (Figure 2.11 vs. 2.12), it can be seen that thetasks inthe 2006-2016
period are dominated by the physical and manual labor tasks, consistent with the lower growth expectation for physical labor intensive tasks. For 2016-2026, while manual tasks are still present, there isan increased number of tasks that
2.3 Occupation growth and SML scores
the slowest going forward.
While the clusters do not exhibit very distinct groups of tasks, they still pro-vide some insight in comparison to one another. In the highest growing jobs (2006-2016) there is only one cluster with manual tasks. For jobs that are ex-pected to grow the most in the next 10 years, there seems to be less information communication and data processing related tasks, which may be due to the use of new technologies in the workplace already streamlining these activities.
While some preliminary patterns are identifiable from these visuals that are consistent with the broader literature discussed earlier, further analysis is nec-essary to identify any meaningful clusters within the task data set and better understand why the pattern changes may be happening in work activity distri-butions. NLP analysis with larger data sets from companies like Burning Glass could provide more valuable insights, building on the preliminary results here based on the O*NET descriptions.
Work activity groups for lowest growing jobs (2006-2016) I.,, U---- U---,-- U-.--- U,---
U-Figure 2.13: Work activity groups for highest
growing jobs (2006-2016) ,- U--- U,---U-' 0 C m Q3 Figure 2.11:
U--Figure 2.12: Work activity groups for lowest growing jobs
(2016-2026)
Figure 2.14: Work activity groups for highest growing
Chapter 3
Industry Level Analysis: Finance
and Insurance
Summary
This chapter provides an exploratory susceptibility analysis of the Finance and Insurance industry. It covers limitations of the analysis done with the current available data, and includes suggestions for further analysis to better understand industry dynamics of ML susceptibility going forward.
3.1
SML scores by industry
Figure 3.1 shows the SML scores by industry. The highest scoring industry seems to be the Finance and Insurance industry. A potential reason could be the high number of assistants and phone agents in this industry that emerge as a highly
ML susceptible occupation group.
Figure 3.2 shows the dispersion of task scores for each occupation in the finance and insurance category. Each red dot shows the SML score for a specific task,
352-i 4P
-IuCS ndustry
Figure 3.1: SML scores by industry
and each box-plot shows the dispersion of task scores within each occupation. The dispersion of scores Figure 3.2 suggests that within a sector different positions may get effected from new technologies in different ways, at different times. The highest median scoring job is Brokerage Clerks (43-4011). Operations Research Analysts (15-2031) seem to have very little dispersion in their task scores, with most tasks seeming equally susceptible to ML. In contrast, task scores for Compensation Managers (11-3111) show a very large spread as the job seems to combine highly automatable tasks with others that require human
input.
Figure 3.3 depicts the analysis of the same data in a slightly different way. The density plot has the added benefit of showing task score distributions with mul-tiple peaks. For instance, Securities, Commodities, and Financial Services Sales
Agents (41-3031), and Credit Authorizers, Checkers, and Clerks (43-4041) show
multiple peaks in their density graphs. This could mean that a significant portion of tasks belonging to these occupations have high/low SML scores, which may
3.1 SML scores by industry
Task scores by occupation
401
25
Figure 3.2: Task score dispersion - finance and insurance
provide further insight that is not readily accessible from only the occupational mean and standard deviation.
0 2 4: 2 02.53.03.54.04.55.0 2.02.53.03.54.04.55.0 2.02.5 3.03.54.04.55.0 -1--A~ .1 11.1. 1 L J _J T 1= 1 202:53.03.54.0455.0 2.02.53.03.54.04.5.00 Meanscore 2 0 4 2 0 4 2 0 4 2 0 2.02.53.03.54.04.55.0
Figure 3.3: Density graphs - finance and insurance
Such plots can be a starting point for industry deep-dives. Similar dispersion graphs could serve as visual tools to identify particularly susceptible-appearing occupations and groups of tasks preemptively. However, further information is needed to deduce actionable results based on these analyses. Further data on task frequency, importance, and level of sophistication for each task would give a much
_________ 43.4914M 434410 . 434011 00 4301.00 1 132M I&U10 1&1&0 1-10
~amm ~~nn00
IMAIMA4 10 0 4 2 0 2o2.0ss.os.sa4oass.0better sense of which jobs with a significant portion of their crucial tasks getting automated. Task similarity data could be incorporated to understand which jobs show similar susceptibility characteristics. Job pairing data (complementary positions that tend to work together) may help in identifying the jobs that could get combined as a result of automation, with fewer people being required to fulfill merged positions.
Chapter 4
Connecting data to policy
Summary
Technical feasibility of new ML implementations is important, but not sufficient in understanding its potential affect on workers. The speed of adoption and the way new technologies are used by employers depend on many other local labor market conditions. The proposed model in this chapter attempts to incorporate such effects into decision making for worker movements and retraining due to technological changes.
4.1
Missing links
As demonstrated earlier in this paper, it is very hard to predict the kind of impact a new technology might have on jobs. Certain technologies may increase productivity and have a net positive impact on employment while others may substitute the need for human labor and cause unemployment.
In addition, the same technology may have different impacts on different soci-eties depending on labor force demographics, taxation, or cost of adoption. These
dynamics are not easy to measure as the data sources available today are not tai-lored for our purposes, which creates challenges in linking data to actionable policies.
There are many existing options to implement future of work policies and programs depending on the needs of different job markets 1 23 4 The proposed
model is intended to help identify jobs and industries in need for policy interven-tion. This analysis can help with identifying the right policy options, connecting the results from data analysis to actionable policies in funding and retraining the workforce preparing for future changes.
4.2
Proposed model
The model's goal is to combine the ML susceptibility and automation data with local dynamics to identify opportunities in local markets where people may move between jobs as a result of technological changes. This model was influenced by Morgan Frank's analysis of skill adjacencies [Alabdulkareem et al., 20181 as well as the works presented at the MIT Technology and Policy Hackathon 2019 Future of Work challenge.
The model takes into account the following factors:
• SML data
" O*NET automation score " Job vacancies
lhttps://www.questsa.org 2
Would Active Labor Market Policies Help Combat High U.S. Unemployment? By Jun Nie andEthanStruby- https://www.kansascityfed.org/publicat/econrev/pdf/1lq3Nie-Struby.pdf
3
https://www.irs.gov/credits-deductions/individuals/earned-income-tax-credit 4
Why the U.S. Needs Wage Insurance, Harvard Business Review,
https://hbr.org/2016/01/why-the-u-s-needs-wage-insurance 5
state-run individual retirement accounts -
4.2 Proposed model
•
Occupational wages" Education requirements
Note that the model uses both SML scores as well as the O*NET automation scores, which is a more comprehensive impact measure for new technologies. As discussed earlier, the current version of the SML rubric is designed to capture only the potential impact of ML on occupations, while the new technological developments include many others such as robots as well as improvements in traditional IT that impact occupations.
4.2.1
SML scores vs. O*NET automation scores
Figures 4.1 and 4.2 show the correlation between the expected job growth rates from the BLS and the scores that measure impact of new technologies. The first figure shows the correlation between the SML score and expected growth rate of occupations, which is very low. The latter shows a stronger correlation between the O*NET automation score and the same growth projections, which is expected as automation is a broader concept that includes all other technological developments. ML is only one part of overall workplace automation, which is why we may see some correlation between these scores. Accordingly, in Figure 4.3 below SML scores only corresponds to explaining roughly 1/3 of the variation in the O*NET automation data.
Note that the O*NET score measures the level of current automation in the job and does not account for new technological changes that will have an impact in the future. For example, we have not really seen the impact from ML appli-cations since we are still in the early stages of transformation. While surveys similar to the SML survey on other aspects of the automation in workplace can give a more complete picture of the impact of technological developments on the
6 % 40 W6 3 0 0( * -0.5 0.1 0.5 1.0 Expected growth (2016-2026)
Figure 4.1: SML job scores vs. expected job growth (2006-2016)
600
40
-0S 0.0 0.5 1.0
Expectd growIh (2016-2026)
Figure 4.2: O*NET job automation scores vs. expected job growth (2016-2026)
1000 *0 0*6% " 0.5 *. * 0 * 025 oo . . 0.00 0.0 .: % 0.00 0.2s 0.50 OSs 1. SML Score