Publisher’s version / Version de l'éditeur:
Vous avez des questions? Nous pouvons vous aider. Pour communiquer directement avec un auteur, consultez la
première page de la revue dans laquelle son article a été publié afin de trouver ses coordonnées. Si vous n’arrivez pas à les repérer, communiquez avec nous à [email protected].
Questions? Contact the NRC Publications Archive team at
[email protected]. If you wish to email the authors directly, please see the first page of the publication for their contact information.
https://publications-cnrc.canada.ca/fra/droits
L’accès à ce site Web et l’utilisation de son contenu sont assujettis aux conditions présentées dans le site LISEZ CES CONDITIONS ATTENTIVEMENT AVANT D’UTILISER CE SITE WEB.
Proceedings of the American Society for Composites / Joint US-Canada
Conference on Composites, 2011-09-26
READ THESE TERMS AND CONDITIONS CAREFULLY BEFORE USING THIS WEBSITE.
https://nrc-publications.canada.ca/eng/copyright
NRC Publications Archive Record / Notice des Archives des publications du CNRC :
https://nrc-publications.canada.ca/eng/view/object/?id=e81de8d8-e139-4607-8da8-d21e23bcb892 https://publications-cnrc.canada.ca/fra/voir/objet/?id=e81de8d8-e139-4607-8da8-d21e23bcb892
NRC Publications Archive
Archives des publications du CNRC
This publication could be one of several versions: author’s original, accepted manuscript or the publisher’s version. / La version de cette publication peut être l’une des suivantes : la version prépublication de l’auteur, la version acceptée du manuscrit ou la version de l’éditeur.
Access and use of this website and the material on it are subject to the Terms and Conditions set forth at
Clay-containing polymeric nanocomposites, characterization, high
pressure dilatometry
1
Clay-containing polymeric
nanocomposites; Characterization, high
pressure dilatometry
2
*
ABSTRACT
In structural clay-containing polymeric nanocomposites (CPNC) ca. 2 – 5 wt% clay is dispersed in polymer matrix: thermoplastic, thermoset or elastomeric. Since most clay/polymer systems are antagonistically immiscible, in analogy to immiscible polymer blends, a two-step compatibilization is required: (1) intercalation of clay into organoclay and (2) addition of functional compatibilizer(s). The volume of these compatibilizing species usually is larger than that of clay itself. These additives affect the thermodynamic, rheology and other performance characteristics of CPNC. Since the system is immiscible, i.e., sensitive to stresses during the compounding and forming stages, the reproducibility of behavior may be a problem. Furthermore, from the chemical and physical points of view the natural and synthetic clays are complex. The purified natural clay may contain 2-5 wt% contaminants (humic derivatives, quartz, gypsum, dolomite, ...), whereas the synthetic ones may be a mixture of different crystallographic forms (e.g., lamellar and needle-like). Both types of clay have polydispersed platelets shape and size. Accordingly, characterization of CPNC should start with that of clay, its platelet size, their inherent dispersibility (absence of interlamellar crystalline welding) and presence of contaminants. CPNC are being characterized by the rheological methods in the solid and molten state. Their mechanical, barrier, dielectric and other properties are determined following the standard methods. However, the use of the high pressure dilatometry (HPD) is relatively rare, even when this is the simplest way for determining the free volume and the thermodynamic interaction parameters as well as the key engineering quantities: the thermal expansion and compressibility coefficients. The HPD measurements are important, especially in view of the kinetic nature of transitions (vitrification, crystallization) that stretches into the non-equilibrium melt. An overview of the method and results obtained for CPNC with amorphous or semi-crystalline polymeric matrices are described. CHARACTERIZATION OF CLAY
The clay-containing polymeric nanocomposites (CPNC) are dispersions of clay in a polymer. For good performance the exfoliation is desired. In industrial manufacture of structural CPNC crystalline clay, natural or synthetic, is used. The clay platelets are 0.7 –
1.7 nm thick with the aspect ratio: p = diameter/thickness = 20 – 6000 [1]. 1
* L. A. Utracki, NRCC/IMI, 75 de Mortagne, Boucherville, QC, Canada J4B 6Y4
The natural clays are contaminated with (1) organic (e.g., humic substances, HS), (2) parasitic clays
3
(e.g., amorphous or non-expandable) and (3) particulate minerals (quartz, sand, silt, feldspar, gypsum, orthoclase, apatite, calcite, dolomite, biotite, etc).
CPNC manufacture involves melt compounding in a single or twin-screw extruder (SSE or TSE, respectively) in the shear or extensional flow field. Dispersing in extensional flow is more energy-efficient, generates better dispersive and distributive mixing, is performed in a more uniform flow field at lower temperatures and it does not re-aggregates solid particles as the shear field does. Some years back the extensional flow mixer (EFM) and its dynamic version, DEFM were developed. These devices may be
attached to a SSE or TSE, or it may be used as stand-alone [2]. 2 The key requirement for
good CPNC clay is its ability to exfoliate, which is related to the ionic imbalance of the crystalline layers, compensated by hydrated ions in the interlayer galleries. The most important (natural or synthetic) exfoliating clays are: montmorillonite (MMT), hectorite (HT), and saponite (SP). These minerals have an octahedral layer (Oc) sandwiched between two tetrahedral (Tc) ones. The synthetic clays are classified as [3]: 3
• Semi-synthetic, prepared in a reaction of natural mineral with salt.
• Synthetic, formed in a reaction between metal salts or oxides.
• Templated, starting with organic templates, which after synthesis may be pyrolyzed.
In the recent VAMAS TWA-33 project three types of sodium-clays were studied [4]: 4
(1) the natural MMT, Cloisite®-Na+ (C-Na+), (2) the semi-synthetic fluoro-hectorite, Somasif
ME-100, and (3) the synthetic fluoro-tetrasilicic mica, Topy-Na+. Their properties are listed
in Table I.
Table I. Properties of the sodium-clays.
Property C-Na+ ME-100 Topy-Na+
Specific density, g/mL 2.86 2.6 2.6
Interlayer spacing, d001 (nm) 1.17 0.95 1.23
Platelets thickness, nm 0.96 0.91
CEC (meq/g) 0.92 1.2 0.80
Nominal aspect ratio, p (-) 280 ≤ 6000 ≤ 5000
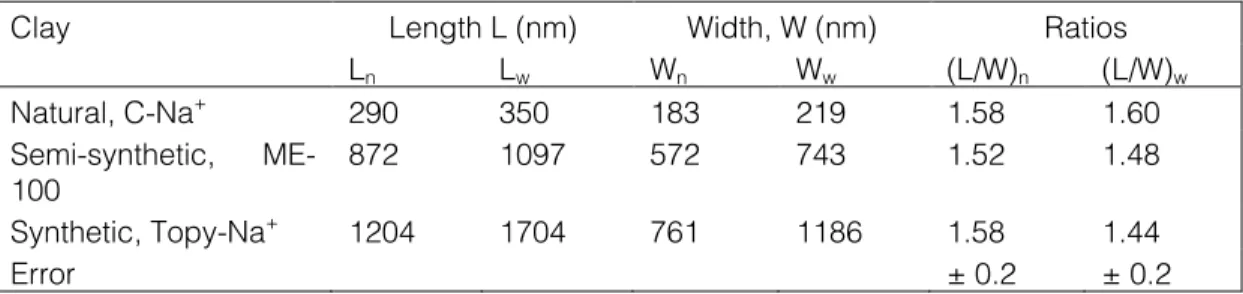
The clays were characterized for platelet shape, size, chemical composition and impurities. The test methodology and results are published in [4]. Example of ME-100 images is shown in Figure 1. The number and weight average values of the platelet length and the orthogonal width (subscripts n and w, respectively) are listed in Table II. The average clay platelet dimensions in three orthogonal directions are: thickness t ≈ 1 nm, width W ≈ 20 – 4000 nm, length L ≈ 30 – 6000 nm, with the nearly universal ratio L/W ≈ 1.5 ± 0.1. The distribution of clay platelet size is nearly Gaussian.
Table II. Statistical analysis of three clays.
Clay Length L (nm) Width, W (nm) Ratios
Ln Lw Wn Ww (L/W)n (L/W)w Natural, C-Na+ 290 350 183 219 1.58 1.60 Semi-synthetic, ME-100 872 1097 572 743 1.52 1.48 Synthetic, Topy-Na+ 1204 1704 761 1186 1.58 1.44 Error ± 0.2 ± 0.2
4
Figure.1. Scanning electron microscopy (SEM) and atomic force microscopy (AFM) images of Somasif ME-100 platelets. As an example, the platelet length is indicated as L; the width is taken as the largest perpendicular to L platelet size [4].
Chemical analysis of clays was obtained by the Energy-dispersive X-ray (EDX) analysis in SEM. Since clay particles may have locally different composition, ca. 30 particles were sampled at least five locations, each. Results are listed in Table III.
Table III. Elemental composition of C-Na+ and ME-100 clays [4].
Source C-Na+ ME-100
Nominal [Al3.34Mg0.66Na0.66](Si8O20)(OH)4 (NaF)2.2(MgF2)0.1(MgO)5.4(SiO2)8
Found [Al2.9Fe0.6Mg0.35Na0.72](Si8O20)(OH)4 (NaF)0.94(MgF2)2.3(MgO)2.7(SiO2)8
O 21.10 22.80 Na 0.72 0.94 Mg 0.35 5.00 Al 2.90 -- Si 8.00 8.00 Fe 0.63 -- F -- 5.50
There are three principal sources for variability of composition in the natural C-Na+
and semi-synthetic ME-100 clays: (a) non-uniform atomic substitution in the crystalline cells, (b) reported tendency of natural clays to vary composition with each particle, (c) presence of impurities. Owing to the latter, in natural clays the scatter of ±15% has been observed. Variability in ME-100 is larger than the error of measurements what also reflects on the local variation of composition. The chemical heterogeneity may cause batch-to-batch variability of the mechano-chemical sensitivity during CPNC compounding, degradability, weatherability, sensitivity or lack of it toward antioxidants and stabilizers, etc.
Purification of natural clays into polymer-grade materials is a complex process with
about 300 steps. The patents specify that the product should contain ≤ 5 wt% of
impurities, > 300 nm large [5]. 5 The following minerals were identified in C-Na+:
vermiculite, quartz, cristobalite, rutile, albite, microcline, aragonite, vaterite, dolomite, gypsum, anhydrite, alunite and sylvite. As expected, the semi-synthetic ME-100 contained traces of contaminants brought in with talc: vermiculite and gypsum. The presence of
5
particulates, incompatible with the matrix polymer, reduces mechanical performance as well as the barrier performance.
CPNC
Clay dispersion in SSE or TSE resembles that of polymer alloys and blends (PAB), thus thermodynamic interactions and complex flow field (shear, chaotic and extensional
mixing) are of key importance [6, 7]. 6, 7 In CPNC, the interactions are modified by
intercalant, and compatibilizers, as well as by clay high surface energy, which leads to adsorption-&- solidification of the organic molecules. Such adsorption has been observed using the surface force analyzer (SFA) and the neutron scattering methods [8-11].8, 9, 10, 11
Also molecular dynamics computations predict formation of the solidified layer [12-14].12,
13, 14
The CPNC tensile and flexural properties (i.e., modulus or strength) are proportional to each other [15].
Thus, in the z-direction perpendicular to clay surface there are two layers with
reduced molecular dynamics: z1 ≈ 2-9 nm thick solid layer followed by z2 – z1 = 100-120
nm thick layer where molecular mobility progressively increases from z1 to z2. Luengo et
al. determined that on a freshly cleaved mica flake thickness of the first and second layer were 5-6 and 100 nm, respectively. Thus, the polymer melt bulk behavior was observed at z2≥ 110 nm.
15 At low loadings the relative modulus follows the linear dependence:
/ 1 ( %)
R c m w
E ≡E E = +a w wt (1)
(subscripts c and m stand for composite and matrix, respectively). For CPNC with PA or
PP matrix aw ≈ 0.2, thus at 5 wt% clay the modulus doubles. In elastomers the effect is
larger: aw ≈ 0.7. Factorial analyses indicate that ER is a linear function of the interlayer
spacing, d001. The tensile strength theory predicts that relative strength:
(
)
1 1
R c m f f m
σ ≡σ σ ≤ +φ σ σ −
(2)
where φf is clay volume fraction. Because of polymer solidification on clay, the
experimental σR values for CPNC with PA-6 or PP are 9 and 5 times larger than predicted
by eq. 2. At low clay content, the rigidity and strength linearly increases with exfoliation. HIGH PRESSURE DILATOMETRY (HPD)
TRANSITIONS
Within the temperature range from 0 (K) to decomposition the polymers undergo several transitions. Of these, the melting, Tm, and the glass transition temperature, Tg, are
best known. In addition to these there are smaller ones detectable on the derivative properties, e.g., the compressibility and the thermal expansion coefficients (κ and α, respectively):
(
)
o(
)
oT ,P ,q T ,P ,q
lnV P ; lnV T
κ ≡ ∂ ∂ α ≡ ∂ ∂ (3)
where Po and To are solidification pressure and temperature, respectively, and q is the rate
of heating or compressing.
The first, quantum transition at
T
< 80 K, was predicted by Simha et al. [16]. 16Above, but at T < Tg there are other glass-glass transitions, identified by the letters of
Greek alphabet [17].17 Of these T
β ≈ 0.8 Tg is the most important as it limits the region of
physical aging of vitreous materials [18].18 Also at T > T
6
cross-over transition, Tc/Tg ≈ 1.15 – 1.35. The magnitude of this ratio was found dependent
on the fragility index [19]:19
(
)
1 log 1 / g g T T d m T d T η = =
(4)The transition at Tc is readily observed by neutron scattering and other vibrational
spectra, in dielectric or rheological measurements, but not directly in PVT. The
mode-coupling theory (MCT) considers liquid as an assembly of particles enclosed in cages formed by their neighbors with α-relaxation controlling the behavior. Only at T > Tc the
molecular vibrations dominate. Götze and Sjogren wrote: “Tc seems to be an equilibrium
parameter of the system, which separates the supercooled liquid state in two regions”
[20]. 20 Semi-crystalline polymers have a dual nature, in part being amorphous in part
crystalline; in most Tm≈ 1.5 Tg [21].21
DETERMINATION OF PVT
The HPD is used for determining the PVT surface in V = V(T, P) coordinates with accuracy of 0.0002 ml/g. The specimens are tested within the range of temperatures, T = 300-590 K, and pressures, P = 0.1 to 190 MPa. The measurements are automatic, either
increasing or decreasing T and P in steps. Depending on the selected rate the
measurement of 350 to 750 data points takes 16 to 36 h. The four procedures used for PVT tests are listed in Table IV.
Table IV. Procedures of PVT measurements
Procedures Constant variable Adjusted variable
Isothermal heating (“standard”)
T is kept constant until P-sweep is completed, then increased to another level between the
ambient and the maximum level, Tmax.
P increases from 10 to 200 MPa.
Isothermal
cooling Initially T ≈ Tg + 30
oC is constant until
P-sweep is completed, then decreased to another level toward the ambient T
P increases from 10 to 200 MPa.
Isobaric heating P is kept constant until T-sweep is completed,
then increased to another level between 10 and 200 MPa
T increases from
ambient to Tmax.
Isobaric cooling P is kept constant until T-sweep is completed,
then increased to another level between 10 and 200 MPa
T decreases from T ≈ Tg + 30 oC to ambient
Note: As P increases the resulting adiabatic heating increases the set T by up to 5oC. In
principle, the experiments may also be conducted reducing P.
The “standard” and the isobaric cooling tests show large transitory regions below
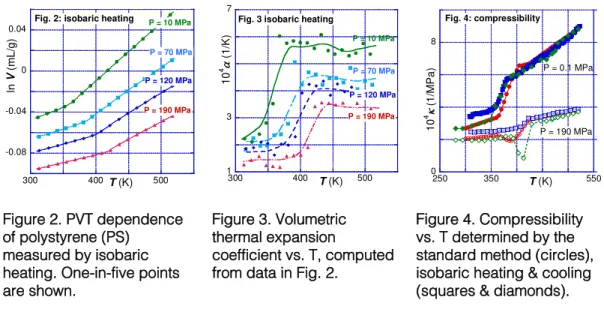
Tg. Only the isobaric heating in Figure 2 shows a regular behavior with nearly constant
slopes (a measure of the thermal expansion coefficient, α) in the vitreous and molten phase. Evidently, different procedures are used for different purpose. For example, the standard procedure guarantees that specimens see the highest temperature only at the end of the test, thus these measurements are not affected by the thermal degradation. The
isobaric cooling from T ≈ Tg + 30 oC has been used for studying the thermodynamics of
7 -0.08 -0.04 0 0.04 300 400 500 ln V ( m L/ g) T (K)
Fig. 2: isobaric heating P = 10 MPa
P = 70 MPa P = 120 MPa P = 190 MPa 1 3 5 7 300 400 500 10 4 α ( 1 /K ) T (K)
Fig. 3 isobaric heating
P = 10 MPa P = 70 MPa P = 120 MPa P = 190 MPa 0 4 8 250 350 450 550 Fig. 4: compressibility 10 4κ (1 /MP a ) T (K) P = 0.1 MPa P = 190 MPa Figure 2. PVT dependence of polystyrene (PS) measured by isobaric heating. One-in-five points are shown.
Figure 3. Volumetric thermal expansion
coefficient vs. T, computed from data in Fig. 2.
Figure 4. Compressibility vs. T determined by the standard method (circles), isobaric heating & cooling (squares & diamonds). EFFECTS OF CLAY, INTERCALANT AND COMPATIBILIZER
Since the expandable clay is hygroscopic containing ca. 7 wt% H2O, CPNC
samples must be vacuum dried [23].23 Commercial organoclay contain up to 40 wt%
excess of intercalant with relatively high free volume content that affects PVT behavior. Highly polar PA-6 strongly interacts with crystalline clays having high surface energy
[24].24 The interactions are so strong that PA-6 expels intercalant from clay surface and
forms 4 – 6 nm thick solid layer of polymer, followed by about 100 nm thick layer of organic molecules with increasing mobility as the distance from the clay surface increases
[25]. 25 The adsorption and solidification reduce the free volume by ca. 15%. In CPNC,
polymer and organoclay are thermodynamically immiscible and must be compatibilized. The thermodynamics treat nano-sized clay platelets and polymeric macromolecules as statistical elements of the network, thus if exfoliation is required, system miscibility is needed. Since macromolecular diffusion into the clay galleries reduces the system entropy, ∆S < 0, the miscibility might be expected only if the enthalpy is negative, ∆H < 0, i.e., if the specific interactions are strong [26].26
DERIVATIVES; COMPRESSIBILITY AND THERMAL EXPANSION COEFFICIENT
The raw data that come from HPD usually have well defined, constant P-values, but because of adiabatic heating effects, T is different at each P level. Thus, if the derivatives α and κ are required, one need to have evenly spaced data points at constant T and P. Three methods have been applied to accomplish this, viz., fitting the data to a polynomial, or the Tait equation [27, 28], 27, 28 but the best approach is an interpolation to the same
T-value at P = constant. When the derivatives are used for detecting small transitions, only the interpolative method is acceptable [29].29
Numerical differentiation of dependencies displayed in Figure 2 leads to the temperature-dependent thermal expansion and compressibility coefficients presented in Figures 3 and 4, respectively. The simplest α-dependencies were obtained by isobaric
heating at a rate of 2oC/h. Figures 3 and 4 show that while the thermal expansion
coefficient, α = α(T) within the vitreous and molten phase varies little with T, the
compressibility coefficient, κ = κ(T) increases in both phases. Notably, in Figures 2 – 4
there is a weak evidence for the presence of Tc transition at 475 ± 5 K. The heating or
cooling rate in the vicinity of Tg is important for the polymer structure and behavior on both
sides of the transition temperature, related to the non-equilibrium fractal structures below Tc [30, 31]. 30, 31
8 -2 0 2 4 6 8 300 350 400 450 500
Fig. 5 Thermal expansion of CPNC
10 4*α (1 /MPa ) T (K) P = 0.1 MPa P = 190 MPa w = 17% w = 2% w = 0% 2 4 6 2.4 2.8 3.2 0 10 20 104*α m,P=0 106*(dα m/dP)P=0 10 4*α m , P =0 10 6 *( dα m /d P ) P =0 w (wt%) 2 4 6 8 10 0.5 1.5 2.5 3.5 4.5 300 350 400 450 500 Fig. 7 Compressibility of CPNC κ ( 1 /MP a ) a t P = 0 .1 κ (1 /MP a ) a t P = 1 9 0 T (K) Figure 5. Temperature dependence of the volumetric thermal expansion coefficient at two pressures and four concentrations.
Figure 6. The thermal expansion coefficient at T > Tg and its pressure
gradient as function of clay concentration, w.
Figure 7. Compressibility coefficient vs. T at P = 0.1 and 190 MPa for PNC containing: w = 0, 2 and 17 wt%.
CPNC was melt compounded from PS-with 0 – 17.1 wt% of Cloisite®10A organoclay in
a TSE [32-34].32, 33, 34 The HPD data were obtained using the “standard” PVT isothermal
heating procedure; Figures 5 and 6 display α as function of P, T and w. In the vitreous
state αg shows two types of behavior. For clay loadings w ≤ 2 % it has low value
decreasing with P to about zero, whereas for w > 3.6 wt% its values are negative, i.e.,
heated specimen shrinks with T instead of expanding. The magnitude of αg at
T < T
gstrongly depends on the cooling process from the melt. In the molten state the isobaric values of αm are nearly constant, independent of T. Addition of clay reduces αg in the full
range of P. In the vicinity of w2 = 3.6 wt% the function takes a dip. A similar, but stronger
local decrease is observed in the melt; Figure 6 displays αm = αm(w) at ambient pressure
and its pressure gradient. Figure 7 displays κ as functions of P, T and w. By contrast with α, the compressibility tends to increase with T. However, the temperature dependence of κ decreases with P virtually to zero at the highest P and w. The κ = κ(w) dependence also
goes through a local minimum near w2 = 3.6 wt%.
EFFECT OF CLAY ON α AND κ IN PA-6 BASED PNC
Dry PA-6 has two transitions of interest: Tg(PA-6) ≈ 323 and Tm(PA-6) ≈ 500 K, both
dependent on P as well as on the method of material preparation. The HPD measurements of PA-6, its PNC-2 and PNC-5 containing 2.29 ± 0.13 and 4.91 ± 0.24 wt% of clay, respectively (inorganic content), were carried out at T = 300 – 580 K and P = 0.1 – 190
MPa [35].35 The derivatives α and κ were computed by numerical differentiation of the PVT
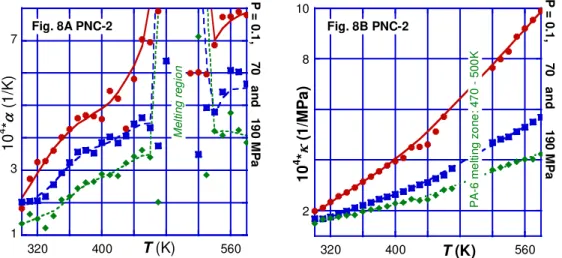
isobaric or isothermal dependencies. As shown in Figure 8, the attention focused on Tm
region and its variation with P, T and w. The thermal expansion coefficient for the crystalline phase of PA-6 and its PNCs is shown is separated from the melt by a “chimney-like” melting zone. The addition of clay reduces α of the solid phase, and increases its value in the melt. This behavior might be related to the presence of high crystallinity regions in the vicinity of the MMT high energy surface. By contrast with α the κ = κ(T)
function for PA-6 and its PNCs follows the same dependence on both sides of Tm, as
theoretically predicted [36, 37].36, 37 The low-P compressibility slightly increases with clay,
9 1 3 5 7 320 400 480 560 Fig. 8A PNC-2 10 4 *α (1 /K ) T (K) M el ti ng r eg io n P = 0. 1 , 70 a n d 19 0 M Pa 2 4 6 8 10 320 400 480 560 Fig. 8B PNC-2 10 4 *κ ( 1/ M P a) T (K) P A -6 m e lti ng z o ne : 47 0 500 K P = 0 .1, 7 0 an d 1 9 0 M P a
Figure 8A and 8B. The thermal expansion and compressibility coefficients vs. T at
P = 0.1 – 190 MPa for PA-6 nanocomposite with 2 wt% clay, PNC-2. THERMODYNAMIC THEORIES
The numerical calculation of α and κ from the HPD data, on purpose did not
involved any theoretical model. However, since an adequate theory may lead to determination of the interaction parameters, cohesive energy density, internal pressure, and the free volume content, a short discussion is justified. Furthermore, the theoretical analysis of CPNC behavior offers an insight into the non-equilibrium phenomena, such as diffusivity, rheology, positron annihilation lifetime spectroscopy (PALS), etc. [38]. 38
SIMHA-SOMCYNSKY CELL-HOLE THEORY
The Simha and Somcynsky (S-S) cell-hole theory is based on the lattice-hole model [39, 40].39, 40 The molecular segments of s-mer occupy y-fraction of the lattice sites, while
the remaining randomly distributed sites, h = 1 – y, are left empty accounting for the free volume. The theory was derived assuming thermodynamic equilibrium, later also postulating that at T < Tg part of the free volume is frozen, what extended the theory to the
vitreous and semi-crystalline non-equilibrium states [41].41
The derivation starts with the configurational partition function, which incorporates the Lennard-Jones (L-J) “6-12 potential” with two interaction parameters: the maximum attractive energy, ε∗, and the segmental repulsion volume, ν∗. Next, assuming the corresponding states principle (CSP), the variables are divided by the characteristic reducing parameters:
( )
( )
* * * * * * * * * s * * * * s P zq / sv V V / V P V c T T / T M T zq / Rc RT s P P / P V v / M ε ε = ≡ ≡ ⇒ = ⇐ = ≡ =
(5)where zq=s z
(
−2)
+2 is the number of interchain contacts between s segments (each ofmolecular weight: Ms = Mn/s) in a lattice of the coordination number z, and 3c is the
number of the external degrees of freedom. The reduced free volume function is a volume-average of the solid-like and gas-like contributions. From the configurational Helmholtz
10
free energy S-S derived the equation of state (eos), the cohesive energy density, CED
,solubility parameter, δ = δ(T, P), and the internal pressure, pi[42-45].
42, 43, 44, 45
Next, the S-S theory for a single component liquid was extended to homogeneous, binary mixtures, postulating that there is only one type of vacancies and one cell size for the components [46, 47].
46, 47 The average interaction parameters ε* and v* are
related to binary ones via:
( )
( )
2 4 m m * * * * i k i ,k i ,k i ,k v X X v ; m , ε =∑
ε ∈ (6)where the two values of m reflect the assumed Lennard-Jones 6-12 potential. The S-S theory for multicomponent systems well describes the phase equilibria, CED, solubility as well as PVT behavior of polymer mixtures with gases, liquids [48]48, solids [49-51] 49, 50, 51
and nanocomposites [52, 53]. 52,53
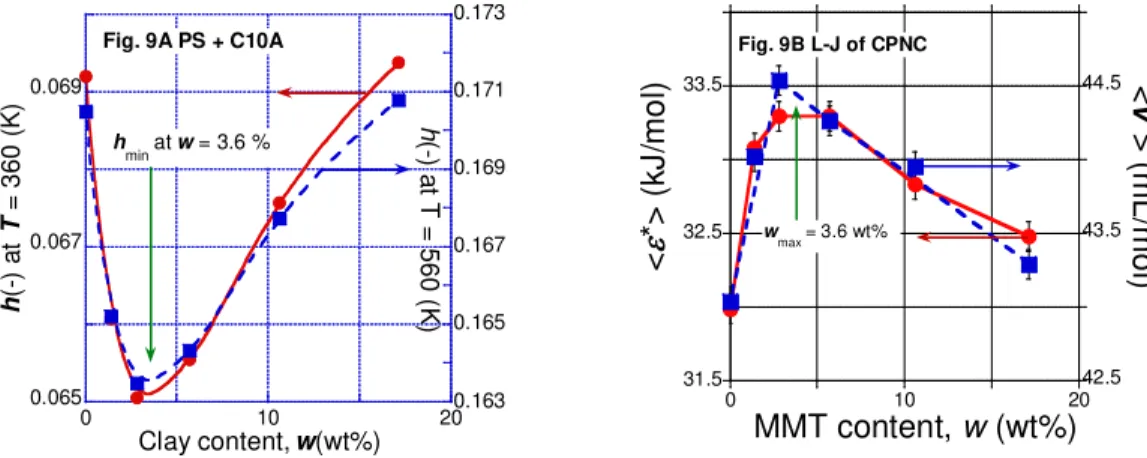
Figures 8A and 8B illustrate the effect of clay content on the free volume parameter h and the L-J interaction parameters in molten PNC with PS matrix. At constant clay loading of 2 wt% adsorption-&-solidification of polymer linearly reduces the free volume content with the interlayer spacing, d001 [32]:
. 32 001 2 51 0 833 1 000 h . . d ; r . ∆ = + = (7)
Because of the favorable thermodynamic interactions between clay and PA-6 these
CPNCs are exfoliated, at 2 wt% clay h is reduced by 15%. The functions: h, ε* and v*
vs. w go through a local extrema at w2 = 3.6 wt% clay – further addition of organoclay
reduces the interlayer spacing and dilutes the intercalated stacks. The effect parallels the behavior of derivative properties on clay content shown in Figures 6 and 7.
The old notion of structure in molten polymers is being accepted on the theoretical and experimental evidences. The twinkling fractal theory (TFT) of the glass transition and
recent atomic force microscopy (AFM) in the tapping-mode [54, 55] 54, 55 are convincing
proofs of the dynamic, solid aggregate presence below and above Tg– only above the
crossover temperature, Tc, the true liquid-like behavior was found. The detailed analysis of
data from HPD, as well as dynamic shear tests of PS indicate the presence of a transient
structure on both sides of Tg; hence, molten polymer not always is at the thermodynamic
equilibrium. For example, the difference of rigidity in quenched and annealed specimens was detectable at T ≥ Tg + 20oC, i.e., half way to Tc = 419 ± 2 K, or Tc/Tg = 1.16 ± 0.01.
0.065 0.067 0.069 0.163 0.165 0.167 0.169 0.171 0.173 0 10 20 Fig. 9A PS + C10A h (-) a t T = 36 0 (K ) h (-) a t T = 5 6 0 (K ) Clay content, w(wt%) h min at w = 3.6 % 31.5 32.5 33.5 42.5 43.5 44.5 0 10 20 <
ε
*> ( k J /m o l) <v *> ( m L/ m ol ) MMT content, w (wt%) w max = 3.6 wt% Fig. 9B L-J of CPNCFigure 9A and 9B. Free volume and the L-J interaction parameters (Figure 9B) vs. clay content for PS-based CPNC at P = 0.1 MPa and T = 360 and 560 (K).
11 0.6 1 1.4 1.8 0 10 20 P = 190 P = 0.1 P = 70 F F (-) MMT, w(wt%) w solid = 3.6 wt% P = 1 9 0, 70 a n d 0. 1 M P a
Figure 10. Free volume frozen fraction, FF = FF(w), for PS-1301 with 0 – 17 wt% of C10A at the selected (for clarity) five pressures, P = 0.1 – 190 MPa. See text.
Analysis of the PVT surface by means of the S-S eos leads to the hole content, h, which should correlate with liquids viscosity following the dependence [56-59]: 56, 57, 58, 59
(
)
0 1 s 2 ln 1 ij const s a a Y ; Y / h a σ η = = + ≡ + (8)The relation was found valid for low molecular weight n-paraffins or silicon oils within
the ranges of T = 20 to 204oC and P = 0.1 to 500 MPa, with constants: a
1 = 0.79 ± 0.01
and a2 = 0.07. However, it failed when applied to data of eight molten polymers, whose
PVT and η = η(P, T) were measured [60]. 60 The discrepancy is related to the presence of
structures in the latter systems at Tg≤ T ≤ Tc ≈ TLL. The presence of structures within this
temperature range was postulated by Boyer and his colleagues; only above TLL the
processing would yield articles with smooth surface and good, reproducible performance [61-62]. 61, 62 0.82 0.86 0.9 0.94 300 400 500
V
(m
L
/g
)
T
(K)
P (MPa) 0.1 40 100 190 Fig. 11 PNC-5Figure 11. Specific volume of PA-6 with 5 wt% clay at P = 0.1 – 190 MPa. Points are experimental and lines computed from the Midha – Nanda –Simha-Jain (MNSJ) theory.
12
THE VITREOUS REGION
Properties of the vitreous phase depend on the way it was achieved [63].63 The
analysis followed the procedure developed by Simha and his colleagues [64-66].64, 65, 66
Accordingly, the frozen fraction of free volume, FF, was computed from the relation:
(
)
(
)
1 P ,glass P ,extrapol 1
FF = − ∂h / T '∂ ∂h / T '∂ ≤ (9)
Figure 10 displays the FF = FF(w) dependence of CPNC = PS + C10A at several pressures. Only at w < w2 = 3.6 wt%, FF < 1 is found, while at higher clay concentration
FF > 1. This behavior stems from the adsorption-&-solidification of the CPNC samples during melt quenching from T > Tg + 50oC.
MNSJ EQUATION OF STATE FOR SEMI-CRYSTALLINE CPNC
Thermodynamic theory for semi-crystalline polymeric systems borrows from several sources: the quantum theory of polymeric glasses at T ≤ 80 K [16], cell model for crystalline polymers [67]67, and several later refinements [68, 69]. 68, 69
35
The cell lattice does not have holes, thus the reducing parameters (P*, T*, V*) are different than those computed using S-S eos cell-hole theory for equilibrium liquids. The theory is valid for the crystalline phase at Tg ≤ T (K) ≤ Tm. The applicability for describing the PVT dependencies
has been examined first for neat PE and PA-6 and then to CPNC. For the PA-6 systems the additivity of the crystalline and non-crystalline domains was assumed [35-37]. , 36, 37 The
sequence of the computation steps and the assumed models are detailed in the original publications. Figure 11 displays the final fit of the theory to HPD data.
INTERACTION COEFFICIENTS
The L-J potential with adjustable exponents: m = 10 – 13, n = 6 – 7 was cast into the present form of the “6-12 potential” after the quantum mechanics showed that the attractive forces between hydrogen atoms follow with n = 6, and the repulsive interactions with m = 2n [70].70
* ε
The 6-12 potential was incorporated into the S-S and MNSJ theories.
The single component, intersegmental L-J interaction parameters are and *
v , whereas
those for multi-component systems are averages, *
ε and *
v . For extracting the
individual binary interactions from these latter ones a model is needed.
The situation is relatively simple for the single-phase polymeric systems or even for immiscible binary polymer blends, where properties of each component directly can be
measured, and only the heterogeneous ones, *
ij
ε and * ij
v (i.e., polymer-i with polymer-j), must be determined from the blend behavior. It is noteworthy that such a treatment ignores the presence of the interphase whose importance increases with the enhanced dispersion [71]. 71
CPNCs are more complex systems than blends as they comprise matrix, nano-sized particles, intercalant, compatibilizer(s) and various industrial additives. Furthermore, the clay usually exists in a wide spectrum of dispersion ranging from fully exfoliated to micron-size aggregates. Clay also adsorbs the organic phase creating a gradient of molecular mobility stretching up to 120 nm from the clay surface. During the last 20 years CPNCs
with immiscible polymer blends became of interest [72]. 72
The CPNC model should specify the composition of the matrix and dispersed solid
phase. For computations, the solid particles are made off clay platelets with z1 ≈ 4–6 nm
thick, solidified organic having the interaction parameters
Thus, it is a challenge to convert these systems into a model mixture of matrix and dispersed in it solid particles that will realistically simulate the physical behavior.
22 *
ε and 22*
v . The remaining materials comprising the organic layer at z > z1 must be treated as a matrix with 11
* ε and
11 *
v . In consequence, the model implicitly assumes that the L-J parameters depend on the clay content, limited to the low clay content, w < w2 = 3.6 wt% [53].
13
Because of differences in clay-polymer interactions, one should not assume that a single model will be applicable to all CPNC. For example, owing to polarity of PA-6 and strong interaction with negatively charged clay platelets, the PA-6 based CPNC are relatively easily exfoliated by the synthetic or compounding method. However, since the intercalant location and molecular structure are different than that observed in PS or polyolefin (PO) matrix, the model for extracting the L-J parameter should account for the difference [15]. Flow analysis of the PA-6 based CPNC led to the “hairy clay particles”
(HCP) model [73]. 73
For CPNCs out of the six parameters only two (
By contrast, the ones with polyolefin (PO) or PS matrix, which does not bond to clay surface, are immiscible with most intercalants and need compatibilizer. In conclusion, before devising a realistic model for tested PNC, information about composition, thermodynamic interactions and degree of dispersion is needed [52].
* 11
ε
and *11
v
) can be measureddirectly. The two cross-interaction parameters, * 12
ε
and *12
v
, are calculated following theBerthelot’s rule and the algebraic average, respectively:
(
)
1 2 1 3 1 3 3 12 11 22 12 11 22 8 / * * * * * / * / and v v v ε = ε ε =
+
(10) The remaining two parameters, ε22* and v22*, are then calculable from average interactionexpressions.
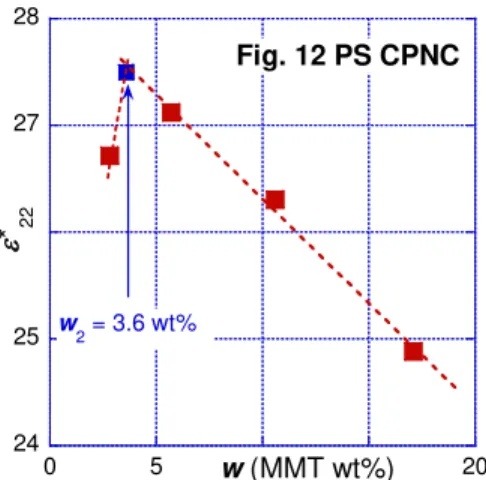
Figure 12 displays the concentration dependence of ε for PS-based CPNC. The 22*
broken line represents the dependence with the expected maximum at the critical
concentration, w2 = 3.6 wt% [52]. Figure 13 shows the concentration dependence of the
computed binary interaction parameters in the full range of clay content, w = 0 – 100 wt%
for PP-based CPNC with C20A. The computations lead to *
11
ε
and *11
v
for all points, excepting the two last ones at w = 100 wt% clay corresponding to ε22* and v22*. From thesetwo sets of numbers the cross-interactions, *
12
ε
and *12
v
, may be calculated.The theory also suggests that the L-J parameters may not be independent, viz. * * *
v P
ε ∝ [45]. The empirical relation for PS and its CPNC is: ε ≅* 13 4. +0 445. v ; r* =0 95. . The binary interaction parameters for the matrix ( 11* 11*
v
,
ε ) and for the solid phase (ε22*,
v22*) are listed in Table V. It may seem odd that the difference between the interaction
parameters of the matrix and solid part is so small. However, the definition of solids is a clay platelet enrobed with an organic phase, thus there are no clay-clay interactions, but rather those between polymeric solid layers adsorbed on the clay platelets and the polymeric matrix. 24 25 26 27 28 0 5 10 15 20 Fig. 12 PS CPNC ε* 22 w (MMT wt%) w 2 = 3.6 wt% 28 29 30 31 50 55 60 65 0 2 4 Fig. 13 PP CPNC
ε
*
ij ijv*
w1/3(wt%) ij = 11 ij = 22Figure 12. Computed stack-stack interaction for intercalated PS-based CPNC.
Figure 13. L-J interaction parameters for PP-based CPNC.
14
Table V. The binary interaction parameters for PNC with PA-6, PP and PS matrix.
Polymer Matrix Solid Refs.
11 * ε 11* v ε 22* v 22* PA-6 34.1 ± 0.3 32.0 ± 0.1 31.2 ± 0.3 25.9 ± 0.3 35 PP 28.9 ± 0.1 50.6 ± 0.4 30.7 ± 0.4 59.9 ± 0.3 53 PS 32.0 ± 0.6 43.0 ± 1.7 33.0 ± 0.1 44.2 ± 0.1 52 THEORETICAL PREDICTIONS
Theories are built assuming that on the one hand they should simulate the phenomenon and on the other permit comparison with experimental results. The notorious assumption in the polymer theories is an omission of polydispersity, the presence of additives and the non-random distribution of properties, e.g., introduced by mixing or temperature gradients. Furthermore, the thermodynamics theories usually assume equilibrium within a single phase.
The S-S and MNSJ equations of state predict the PVT variability of, respectively, amorphous and semi-crystalline molten polymer and the α and κ derivatives. The theories are cast in reduced form, thus they are universally applicable to any system with known set of the reducing parameters, P*, T* and V* (viz. eq. 5). Figures 14A and 14B show,
respectively, the α and κ dependencies for PA-6 at, e.g., T = 5 – 284oC, P = 25 – 314
MPa, 104α = 3.35 – 8.02 (1/K) and κ = 0.13 – 1.01 (1/kPa); these values are well within the
experimental magnitudes of these coefficients. Similarly good representation of the
experimental data was obtained for PS at T = 20 – 313oC, P = 11 – 189 MPa, where 104α =
3.52 – 8.44 (1/K) and κ = 0.07 – 0.60 (1/kPa).
The S-S eos well describes the PVT behavior of amorphous polymers up to the second volume derivatives. The experimental PA-6 data were compared with a theoretical model assuming dispersion of PA-6 crystals in its melt. Accordingly, the applied MNSJ and S-S theories, respectively, showed excellent agreement with the experimental data.
2 4 6 8 0.025 0.035 0.045
α
T
*
T/T*
P/P* 0.02 0.07 0.15 0.25 Fig. 14A PA-6P A -6 m e lt ing z on e melt semi-crystalline 0.1 0.3 0.5 0.7 0.9 0.025 0.035 0.045
κ
P*
(-)
T/T*
P/P* 0.02 0.07 0.15 0.25 Fig. 14B PA-6 P A -6 m e lt ing z on e melt semi-crystallineFigure 14A and 14B. Theoretical predictions of the thermal expansion and compressibility coefficients in reduced variables for a semi-crystalline/molten polymeric system
15
SUMMARY AND CONCLUSIONS
This presentation discussed three aspects of CPNC: • Characterization of clays
• HPD measurements, thermodynamic theories and binary interactions
• The non-equilibrium structures on both sides of Tg. .
The natural clays significantly vary with the geographical location and local mine strata. The differences are in: platelet shape, size and size distribution, chemical composition and the presence of organic and inorganic contaminants.
Of the four HPD test procedures the most useful is the isobaric heating method, while the “standard” isothermal compression is useful for the thermally unstable systems. The PVT data should be directly numerically differentiated for α and κ coefficients.
Amorphous and semi-crystalline PVT data well follow the S-S and MNSJ theories,
respectively. Comparison of the theoretical predictions with the experimental plots of the α
and κ variation with T and P show good agreement up to the second derivative. For
CPNC, the analysis of the HPD data by means of these theories leads to the determination of the binary matrix-clay L-J interaction parameters.
Finally, the demonstrated non-equilibrium nature of polymeric systems on both
sides of Tg demands caution while generalizing the result; a significant difference in melt
behavior was observed by varying the time scale of the experiment.
REFERENCES
1 Utracki, L. A. 2004. Clay-Containing Polymeric Nanocomposites, RAPRA, Shawbury, UK. ISBN: 978-1-85957-488-1
2 Utracki, L. A., M. Sepehr and J. Li. 2006. “Melt compounding of polymeric nanocomposites,” Intern. Polym. Process., 21(1): 1 – 14.
3 Utracki, L. A., M. Sepehr, and E. Boccaleri. 2007. “Synthetic, layered nano-particles for polymeric nanocomposites (PNC’s),” Polym. Adv. Technol., 18(1): 1–37. DOI: 10.1002/pat.852
4 Utracki, L. A., W. Broughton, N. Gonzalez Rojano, L. Carvalho, and C. A. Achete. 2011.
“Clays for polymeric nanocomposites,” Polym. Eng. Sci., 51(4): 559–572. DOI
10.1002/pen.21807.
5 Clarey, M., J. Edwards, S. J. Tsipursky, G. W Beall. and D. D. Eisenhour, Method of manufacturing polymer - grade clay for use in nanocomposites, US Pat., 6,050,509, 18.04.2000.
6 Utracki, L. A. Ed., 2002. Polymer Blends Handbook, Kluwer, Dordrecht. ISBN: 978-0-306-48244-1
7 Song, W., 2000. “Comprehensive study of a new extensional flow mixer,” SPE ANTEC, Techn. Pap. 46(1): 270-275.
8 Israelachvili J. N., M. Tirrell, J. Klein and Y., Almog. 1984. “Forces between two layers of adsorbed polystyrene immersed in cyclohexane below and above the Θ-temperature,” Macromolecules, 17(2): 204 – 209.
9 Horn, R. G. and J. N. Israelachvili. 1988. “Molecular organization and viscosity of a thin film of molten polymer between two surfaces as probed by force measurements,” Macromolecules, 21(9): 2836 – 2841.
10 Cosgrove T., T. G. Heath, K. Ryan and T. L. Crowley. 1987. “Neutron scattering from adsorbed polymer layers,” Macromolecules, 20(11), 2879 – 2882.
16
11 Cosgrove T., T. G. Heath, T. J. S. Phipps and R. M. Richardson. 1991. “Neutron
reflectivity studies of polymer adsorbed on mica from solution,” Macromolecules,
24(1): 94 – 98.
12 Fleer G., M. A. Cohen-Stuart, J. M. H. M. Scheutjens, T. Cosgrove and B. Vincent. 1993. Polymers at Interfaces, Chapman and Hall, London.
13 Hentschke R. 1997. “Molecular modeling of adsorption and ordering at solid interfaces,” Macromol. Theory Simul., 6(2): 287 – 316.
14 Termonia Y. 2009. “Monte Carlo modeling of dense polymer melts near nanoparticles,” Polymer, 50(4): 1062 – 1066.
15 Tokihisa M., K. Yakemoto, T. Sakai, L. A. Utracki, M. Sepehr, J. Li and Y. Simard, 2006. “Extensional Flow Mixer for Polymer Nanocomposites,” Polym. Eng. Sci. 46(8): 1040– 1050; DOI 10.1002/pen.20542
16 Simha R., J. M. Roe and V. S. Nanda. 1972. “Low-temperature equation of state for amorphous polymer glasses,” J. Appl. Phys., 43: 4312 – 4317.
17 Boyer R. F. 1980. “Dynamics and thermodynamics of the liquid state T > Tg of amorphous polymers.” J Macromol Sci. – Phys., B183: 461 – 553; Boyer R. F. 1987.
“Evidence from TLL and related phenomena for local structure in the amorphous state
of polymers,” in Order in the amorphous state, R. L. Miller and J. K. Rieke, eds. New York: Plenum.
18 Struik L. C. E. 1978, Physical aging in amorphous polymers and other materials.
Amsterdam: Elsevier.
19 Surovtsev N. V. 2007. “Interrelation between fast relaxation and mode-coupling theory temperature in glass formers,” J. Phys.: Condens. Matter., 19, 196101 (8 pp).
20 Götze W., L. Sjogren 1992. “Relaxation processes in supercooled liquids,” Rep. Prog. Phys., 55: 241-370.
21 Boyer R. F. 1985. “TLL and related liquid state transitions-relaxations: A review,” in
Polymer Yearbook 2, R, A. Pethrick, ed., Chur-London-Paris-New York: Harwood Academic Publishers.
22 Quach A. and R. Simha. 1971. “Pressure-volume-temperature properties and
transitions of amorphous polymers; polystyrene and poly(o-methyl-styrene),” J. Appl.
Phys., 42, 4592 – 4606; Quach A. and R. Simha. 1972. “Statistical thermodynamics of the glass transition and the glassy state of polymers,” J. Phys. Chem., 76: 416 – 421. 23 Utracki L. A., R. Simha and A. Garcia-Rejon, 2003. “Pressure-Volume-Temperature
relations in nanocomposite,” Macromolecules, 36(6), 2114 – 2121.
24 Tanaka G. and L. A. Goettler, 2002. “Predicting the binding energy for nylon 6,6/clay nanocomposites by molecular modeling,” Polymer, 43(2), 541-553.
25 Luengo G., F.-J. Schmitt, R. Hill and J. N. Israelachvili, 1997. “Thin film rheology and tribology of confined polymer melts: contrasts with bulk properties,” 30(8), 2482 – 2494.
26 Kim K., L. A. Utracki and M. R. Kamal, 2004. “Numerical simulation of polymer
nanocomposites using a self-consistent mean-field model,” J. Chem. Phys., 121,
10766 - 10777.
27 Tait P. G. 1889. “On some of the physical properties of fresh water and of sea-water,” in Report on the Scientific Results of the Voyage of H.M.S. Challenger, Thomson C. W., ed., Physics and Chemistry, 2(IV), 1.
28 Nanda V. S. and R. Simha. 1964. “Theoretical interpretation of Tait equation parameters,” J. Chem. Phys., 41, 1884 – 1885.
29 Utracki, L. A. 2012. “PVT Characterization of polymeric nanocomposites,” Chapter 2 in Characterization Techniques of Polymer Nanocomposites, V. Mittal, Ed., Wiley VCH Verlag, Weinheim, Germany.
17
30 Wool R. P. 2008. “Twinkling fractal theory of the glass transition,” J Polym Sci. Part B
Polym Phys., 46:2765–2778.
31 Utracki, L. A. and P. Sammut. 2011. “Molten Polystyrene Structures Above the Glass Transition, T > Tg,” J. Polym. Sci. Part B: Polym. Phys., 49, 000–000; DOI: 10.1002/polb.22313.
32 Tanoue S., L. A. Utracki, A. Garcia–Rejon, J. Tatibouët, K. C. Cole and M. R. Kamal. 2004. “Melt compounding of different grades of polystyrene with organoclay: Part 1. Compounding and characterization,” Polym. Eng. Sci., 44(6), 1046 – 1060.
33 Tanoue S., L. A. Utracki, A. Garcia–Rejon, P. Sammut, M.-T. Ton-That, I. Pesneau, M. R. Kamal and J. Lyngaae-Jørgensen. 2004. “Melt compounding of different grades
polystyrene with organoclay: Part 2. Rheological properties,” Polym. Eng. Sci., 44(6),
1061 – 1076.
34 Tanoue S., L. A. Utracki, A. Garcia–Rejon, J. Tatibouët and M. R. Kamal. 2005. “Melt compounding of different grades of polystyrene with organoclay: Part 3. Mechanical properties,” Polym. Eng. Sci., 45(6), 827 – 837.
35 Utracki L. A. 2009. “Equation of state of polyamide-6 and its nanocomposites: 1.
Fundamentals and the matrix,” J. Polym. Sci. Part B: Polym. Phys., 47(3), 299 -- 313;
“2. Effects of clay”, J. Polym. Sci. Part B: Polym. Phys., 47(10), 966–980.
36 Utracki L. A. 2009. “Compressibility and thermal expansion coefficients of nanocomposites with amorphous and crystalline polymer matrix,” European Polym J., 45(7), 1891–1903.
37 Utracki L. A. 2010. “PVT of amorphous and crystalline polymers and their nanocomposites,” Polym. Degradation Stability, 95(3), 411–421.
38 Utracki L. A. and A. M. Jamieson, eds. 2010. Polymer Physics: From Suspensions to
Nanocomposites to Beyond, New York: J. Wiley & Sons.
39 Simha R. and T. Somcynsky. 1969. “On the statistical thermodynamics of spherical and chain molecule fluids,” Macromolecules, 2(4): 342 – 350.
40 Somcynsky T. and R. Simha. 1971. “Hole theory of liquids and glass transition,” J. Appl. Phys., 42: 4545 – 4548.
41 Jain R. K. and R. Simha. 1979. “High-pressure isotherms of polyethylene crystals,” J. Polym. Sci.: Polym. Lett. Ed., 17(1): 33 – 37.
42 Utracki L. A. 2004. “Statistical thermodynamics evaluation of solubility parameters and polymer miscibility,” J Polym Sci. Part B: Polym Phys., 42(15): 2909 – 2915.
43 Utracki L. A. and R. Simha. 2004. “Statistical thermodynamics predictions of the solubility parameter,” Polym. Int., 53(3): 279 – 286.
44 Utracki L. A. and R. Simha. 2001. “Free volume and viscosity of polymer-compressed
gas mixtures during extrusion foaming,” J. Polym. Sci.: Part B: Polym. Phys., 39(3):
342 – 362
45 Utracki L. A. 2005. “Pressure-Volume-Temperature dependencies of polystyrenes,” Polymer, 46(25): 11548 – 11556.
46 Jain R. K. and R. Simha. 1980. “On the statistical thermodynamics of multicomponent fluids: equation of state,” Macromolecules, 13(6): 1501 – 1508.
47 Jain R. K. and R. Simha. 1984. “Statistical thermodynamics of multicomponent fluids,” Macromolecules, 17(12): 2663 – 2668.
48 Utracki L. A. and R. Simha. 2001. “Analytical representation of solutions to lattice-hole theory,” Macromol. Theory Simul., 10(1): 17 – 24.
49 Simha R., R. K. Jain and S. C. Jain. 1984. “Bulk modulus and thermal expansivity of
melt polymer composites: statistical versus macro - mechanics,” Polym. Compos.,
18
50 Papazoglou E., R. Simha and F. H. J. Maurer. 1989. “Thermal expansivity of particulate
composites: interlayer versus molecular model,” Rheol. Acta, 28(4): 302 – 308.
51 Simha R., E. Papazoglou and F. H. J. Maurer. 1989. “Thermal expansivity and bulk
modulus of polymer composites: experiment versus theory,” Polym. Compos., 10(6):
409 – 413.
52 Utracki L. A., 2008. “Free volume of molten and glassy polystyrene and its nanocomposites,” J. Polym. Sci. Part B: Polym. Phys., 46(23): 2504 – 2518.
53 Utracki L. A. and R. Simha. 2004. “Pressure-Volume-Temperature Dependence of
Polypropylene/ Organoclay Nanocomposites,” Macromolecules, 37(26): 10123 –
10133.
54 Wool R. P. and A. Campanella. 2009. “Twinkling fractal theory of the glass transition:
Rate dependence and time–temperature superposition, in polymers,” J. Polym. Sci.
Part B: Polym. Phys., 47(24): 2578–2590.
55 Stanzione III J. F., K. E. Strawhecker and R. P. Wool. 2011. “Observing the twinkling fractal nature of the glass transition,” J. Non-Crystalline Solids, 357(2): 311-319, doi: 10.1016/j.jnoncrysol.2010.06.041.
56 Utracki L. A. 1983. “Pressure dependence of Newtonian viscosity,” Polym Eng Sci., 23(8): 446 – 452.
57 Utracki L. A. 1983. “Temperature and pressure dependence of liquid viscosity,” Canad. J. Chem. Eng., 61(5): 753 – 758.
58 Utracki L. A. 1986. “Correlation between PVT behavior and the zero – shear viscosity of liquid mixtures,” J. Rheol., 30(4): 829 – 841.
59 Utracki L. A. 1985. “A Method of Computation of the pressure effects on melt viscosity,” Polym Eng Sci., 25(11): 655 – 668.
60 Utracki L. A. and T. Sedlacek. 2007. “Free volume dependence of polymer viscosity,” Rheologica Acta, 46(4): 479–494; DOI 10.1007/s00397-006-0133-z.
61 Stadnicki S. J. and J. K. Gillham. 1976. “The Tll (> Tg) transition of atactic polystyrene,” J. Appl. Polym. Sci., 20(5), 1245 – 1275.
62 Keinath, S. E.; Boyer, R. F. 1981. “Thermomechanical analysis of Tg and T > Tg
transitions in polystyrene,” J. Appl. Polym. Sci., 26(6), 2077 – 2085.
63 Schmidt M. 2000. Macroscopic volume and free volume of polymer blends and
pressure-densified polymers. Ph.D. Thesis, Chalmers University, Göteborg.
64 McKinney J. E. and R. Simha. 1974. “Configurational thermodynamic properties of
polymer liquids and glasses. Poly(vinyl acetate).” Macromolecules, 7(6), 894 – 901;
ibid., 1976. 9, 430 – 441; 1977. J Res NBS – Phys Chem, 81A, 283 – 297.
65 Curro J. G., R. R. Lagasse and R. Simha. 1981. “Use of a theoretical equation of state to interpret time-dependent free volume in polymer glass,” J. Appl. Phys., 52(10), 5892 – 5897.
66 Utracki L. A. 2007. “Pressure-Volume-Temperature of molten and glassy polymers,” J. Polym. Sci. Part B: Polym. Phys., 45(3), 270 – 285.
67 Midha, Y. R. and V. S. Nanda. 1977. “Equation of state for a polymer crystal,” Macromolecules, 10(5), 1031 – 1035.
68 Simha R. and R. K. Jain. 1978. “Statistical Thermodynamics of Polymer Crystal and Melt,” J. Polym. Sci. Part B: Polym. Phys. Ed., 16(8): 1471 – 1489.
69 Jain R. K. and R. Simha. 1979. “Equation of state of semicrystalline and crystalline polymers,” J. Polym. Sci.: Polym. Phys. Ed., 17(11), 1929 – 1946.
70 Lennard-Jones J. E. and A. F. Devonshire. 1937. “Critical phenomena in gases I.”, Proc. Roy. Soc., 163(1), 53 – 70.
19
71 Utracki L. A. 1989. Polymer Alloys and Blends, Munich: Hanser Verlag; Utracki L. A.,
Ed. 2002. Polymer Blends Handbook, Dordrecht: Kluwer Academic Pub.
72 Utracki L. A. 2011. “Rheology of Polymer Blends,” in Encyclopedia of Polymer Blends,
Chapter 2, Volume 2, A. Isayev, Ed., Weinheim: Wiley-VCH Verlag.
73 Utracki L. A. and J. Lyngaae-Jørgensen. 2002. Dynamic melt flow of nanocomposites based on poly-ε-caprolactam,” Rheologica Acta, 41(5), 394 – 407.
![Table III. Elemental composition of C-Na + and ME-100 clays [4].](https://thumb-eu.123doks.com/thumbv2/123doknet/14129537.468899/5.918.149.747.80.367/table-iii-elemental-composition-c-na-clays.webp)


![Figure 14A and 14B. Theoretical predictions of the thermal expansion and compressibility coefficients in reduced variables for a semi-crystalline/molten polymeric system computed from a combination of S-S and MNSJ eos [36, 37]](https://thumb-eu.123doks.com/thumbv2/123doknet/14129537.468899/15.918.152.778.678.955/theoretical-predictions-expansion-compressibility-coefficients-variables-crystalline-combination.webp)
