Automatic Data for Applied Railway Management: Passenger
Demand, Service Quality Measurement, and Tactical Planning on
the London Overground Network
byMichael S Frumin
B.S., Computer Science, Stanford University (2000)
Submitted to the Department of Civil and Environmental Engineering and the Operations Research Center
in partial fulfillment of the requirements for the degrees of
Master of Science in Transportation
and
Master of Science in Operations Research
at theMassachusetts Institute of Technology
June 2010c
2010 Massachusetts Institute of Technology. All rights reserved.
Author . . . . Department of Civil and Environmental Engineering
Operations Research Center May 18, 2010 Certified by . . . . Nigel H.M. Wilson Professor of Civil and Environmental Engineering Thesis Supervisor Certified by . . . . Jinhua Zhao Research Scientist of Civil and Environmental Engineering Thesis Supervisor Accepted by . . . .
Dimitris J. Bertsimas Boeing Professor of Operations Research Codirector, Operations Research Center Accepted by . . . .
Daniele Veneziano Chairman, Departmental Committee for Graduate Students
Automatic Data for Applied Railway Management: Passenger Demand, Service Quality Measurement, and Tactical Planning on the London Overground
Network by
Michael S Frumin
Submitted to the Department of Civil and Environmental Engineering and the Operations Research Center
on May 18, 2010, in partial fulfillment of the requirements for the degrees of Master of Science in Transportation
and
Master of Science in Operations Research
Abstract
The broad goal of this thesis is to demonstrate the potential positive impacts of applying automatic data to the management and tactical planning of a modern urban railway. Tactical planning is taken here to mean the set of transport-specific analyses and decisions required to manage and improve a railway with time horizons measured in weeks, months, or up to a year and little or no capital investment requirements.
This thesis develops and tests methods to (i) estimate on-train loads from automatic measurements of train payload weight, (ii) estimate origin-destination matrices by combin-ing multiple types of automatic data, (iii) study passenger incidence (station arrival) behavior relative to the published timetable, (iv) characterize service quality in terms of the differ-ence between automatically measured passenger journey times and journey times implied by the published timetable. It does so using (i) disaggregate journey records from an entry-and exit-controlled automatic fare collection system, (ii) payload weight measurements from “loadweigh” sensors in train suspension systems, and (iii) aggregate passenger volumes from electronic station gatelines. The methods developed to analyze passenger incidence behavior and service quality using these data sources include new methodologies that facilitate such analysis under a wide variety of service conditions and passenger behaviors.
The above methods and data are used to characterize passenger demand and service qual-ity on the rapidly growing, largely circumferential London Overground network in London, England. A case study documents how a tactical planning intervention on the Overground network was influenced by the application of these methods, and evaluates the outcomes of this intervention. The proposed analytical methods are judged to be successful in that they estimate the desired quantities with sufficient accuracy and are found to make a positive contribution to the Overground’s tactical planning process.
It is concluded that relative measures of service quality such as the one developed here can be used in cross-sectional analysis to inform tactical planning activity. However, such measures are of less utility for longitudinal evaluation of tactical planning interventions when the basis against which service quality is judged (in this case the timetable) is changed. Under such circumstances, absolute measures, such as total observed passenger journey times, should be used as well.
Thesis Supervisor: Nigel H.M. Wilson
Title: Professor of Civil and Environmental Engineering Thesis Supervisor: Jinhua Zhao
Acknowledgments
The research presented in this thesis, indeed the entire course of graduate study which culminates in this thesis, was made possible by a number of parties whom the author wishes to thank and acknowledge.
• The Massachusetts Institute of Technology, its Department of Civil and Environmental Engineering, and the faculty and staff of the Master of Science in Transportation program for making a home for students interested in the science and practice of transportation.
• Professor Nigel Wilson and the other leaders of the Transit Research Group for the opportunity to conduct research into practical problems facing the public transport providers who make our cities possible.
• Transport for London, and its many staff members in the departments of London Rail, London Underground, and Fares & Ticketing, for financial support, feedback, knowledge, and two summers of internship employment.
• Certain railway managers in and around London and New York City, including Oliver Bratton and Herbert Lambert, for helping ground this thesis in the contemporary needs and practices of the managers of modern urban railways.
• Dr. Jinhua Zhao, along with Professor Wilson, for supervising the writing of this thesis.
• The MIT Operations Research Center for allowing the author to dig deeper into many of the technical and analytical methods applied in the field of transportation and in this thesis.
• The family, friends, colleagues, and classmates without whom it is difficult to imagine how the author would be anywhere near where he is today.
Contents
1 Introduction 15
1.1 Railway Management, Tactical Planning, and Automatic Data . . . 16
1.2 Motivation . . . 17
1.3 Objectives . . . 18
1.4 Research Approach . . . 19
1.5 Thesis Organization . . . 20
2 Public Transport in London 21 2.1 London and the Greater London Authority . . . 21
2.2 The Public Transport Network . . . 21
2.3 Public Transport Fares and Ticketing . . . 23
2.4 The London Overground Network . . . 25
2.5 Institutional Structures . . . 27
2.6 Investment and Expansion . . . 28
3 Data Needs and Sources 31 3.1 Data Needs . . . 31
3.2 A Synthetic Approach for the London Overground . . . 32
3.3 Data Sources . . . 34
3.3.1 The Oyster Smartcard Ticketing System . . . 34
3.3.2 “Loadweigh” Train Payload Weighing Systems . . . 35
3.3.3 Station Gatelines . . . 36
3.3.4 Manual Passenger Counts . . . 36
3.3.5 Network Representations . . . 36
3.3.6 Additional Data Sources . . . 37
4 Calibration of Loadweigh Systems 39 4.1 Literature Review and Industry Experience . . . 39
4.2 Model Development . . . 41
4.3 Exploratory Analysis . . . 43
4.4 Calibration Results for the London Overground . . . 45
4.5 Variability of On-board Loads . . . 48
5 Origin-Destination Matrix Estimation 53
5.1 Public Transport Network Assignment Literature Review . . . 54
5.1.1 Supply Models . . . 54
5.1.2 Paths and Path Choice Models . . . 56
5.1.3 Assignment Models . . . 58
5.2 OD Matrix Estimation Literature Review . . . 59
5.2.1 OD Estimation Example . . . 60
5.2.2 OD Estimation Methods . . . 61
5.2.3 Simulation of OD Estimation Methodologies . . . 66
5.3 OD Estimation Strategy for the London Overground . . . 66
5.3.1 Assignment Model for the London Overground . . . 67
5.3.2 Information Minimization Matrix Estimation . . . 76
5.4 Exploratory Analysis of OD Estimation Inputs . . . 78
5.4.1 Oyster Seed Matrix . . . 78
5.4.2 Link Flows . . . 78
5.4.3 Gateline Data . . . 80
5.5 OD Estimation Results . . . 81
5.5.1 Validation . . . 84
5.5.2 Loadweigh Sensitivity Analysis . . . 87
5.6 Conclusions and Recommendations . . . 89
5.6.1 Conclusions . . . 90
5.6.2 Recommendations . . . 91
6 Passenger Incidence Behavior 93 6.1 Literature Review . . . 93
6.1.1 Passenger Incidence Behavior . . . 94
6.1.2 Schedule-Based Assignment . . . 99
6.2 Methodology . . . 101
6.2.1 Behavioral Assumptions . . . 103
6.2.2 Algorithm . . . 103
6.2.3 Implementation . . . 105
6.3 Passenger Incidence Behavior on the London Overground Network . . . 106
6.3.1 Data . . . 106
6.3.2 Validation . . . 107
6.3.3 Results . . . 108
6.4 Conclusions and Recommendations . . . 110
6.4.1 Conclusions . . . 110
6.4.2 Recommendations . . . 111
7 Service Quality Measurement from AFC Data 113 7.1 Service Delivery and Service Quality Measurement Literature Review . . . . 114
7.1.1 Service Delivery Measurement and The Operator’s Perspective . . . . 115
7.1.2 Service Quality Measurement and The Passenger’s Perspective . . . . 117
7.1.3 Relative Service Quality . . . 119
7.2 Analytical Framework and Assumptions . . . 124
7.2.1 Journey Time Components and Standards . . . 124
7.2.2 Passenger Incidence and Behavioral Assumptions . . . 126
7.2.3 Framework Intuitions . . . 129
7.3 A Unified Unbiased Estimator for Aggregate Excess Journey Time . . . 130
7.3.1 Framework for Aggregate EJT . . . 130
7.3.2 Equivalence of Random and Scheduled Incidence Assumptions for Ag-gregate EJT of Random Incidence Passengers . . . 131
7.3.3 Blended Passenger Incidence Behavior . . . 133
7.3.4 Extension to a Heterogeneous Rail Network with Interchanges . . . . 135
7.4 Discussion . . . 136
7.4.1 Application Considerations . . . 136
7.4.2 Negative EJT . . . 137
7.4.3 EJT and Longitudinal Analysis . . . 138
7.5 Conclusions . . . 139
8 Oyster-Based Excess Journey Time on the London Overground 141 8.1 Excess Journey Time Methodology for the London Overground . . . 141
8.2 Graphical Validation . . . 143
8.3 Results . . . 146
8.3.1 Excess Journey Time on the London Overground . . . 146
8.3.2 Comparison with Existing Performance Metrics . . . 152
8.4 Conclusions . . . 154
9 Tactical Planning Case Study on the London Overground 157 9.1 The North London Line: Spring 2008 . . . 157
9.1.1 The Service Plan . . . 158
9.1.2 Passenger Demand . . . 160
9.1.3 Operating Performance: Service Delivery and Quality . . . 162
9.2 Tactical Planning Intervention: The Case for Even Intervals . . . 165
9.2.1 “3 + 3” Service on the North London Line . . . 167
9.3 Evaluation . . . 169
9.3.1 Evaluation Data . . . 170
9.3.2 Evaluation Results . . . 171
9.4 Conclusions . . . 174
10 Final Remarks 177 10.1 Summary and Conclusions . . . 177
10.1.1 Analytical Methods . . . 177
10.1.2 Applications of Automatic Data to Tactical Planning . . . 181
10.1.3 Methodological Contributions . . . 183
10.2 Recommendations for Data Collection on the London Overground Network . 184 10.3 Future Research . . . 185 A London Overground Station Information and Abbreviations 189
B London Overground Line and Segment Abbreviations 191
C Schematic Map of TfL Rail Services 193
D Assignment Model Algorithm for Operator Aggregation 195
List of Figures
1-1 Conceptual diagram of tactical planning hierarchy. . . 17
2-1 High level institutional structure for public transport service provision in London 23 2-2 Map of the London Overground network, with other rail services . . . 26
4-1 Cumulative distribution of London Overground loadweigh measurements . . 44
4-2 Loadweigh weight vs. time of day (random 10% sample) . . . 44
4-3 Loadweigh weight vs. time of day for peak load point of London Overground network (Canonbury to Highbury & Islington) . . . 45
4-4 Loadweigh weight vs. manual count data . . . 45
4-5 Residual vs. manual count for all data (unit segmented) and terminals-only (pooled) . . . 48
4-6 Loadweigh weight vs. time of day for peak load point data . . . 49
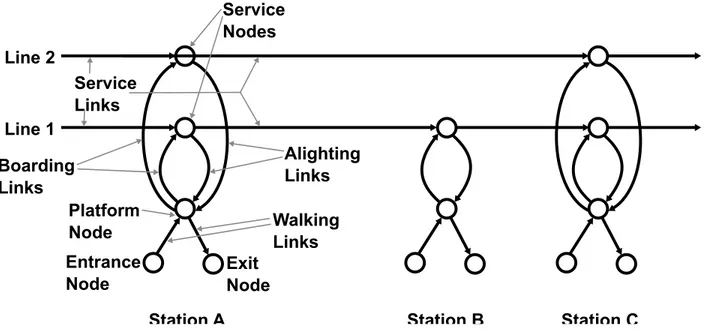
5-1 Example of line-based representation of public transport network . . . 55
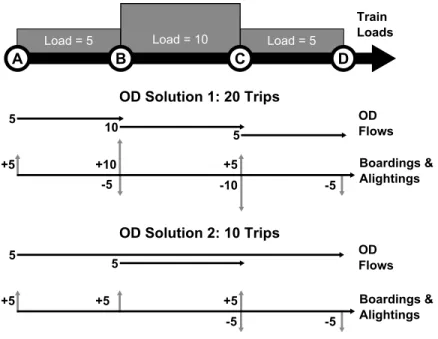
5-2 Example OD estimation problem . . . 61
5-3 Waiting time as a function of headway . . . 69
5-4 Illustration of network augmentation . . . 70
5-5 Sensitivity of London Overground Oyster-only competitive market size and assigned trips . . . 75
5-6 Distribution of non-zero OD flows in Oyster AM Peak seed OD matrix . . . 79
5-7 Counted and assigned Oyster link flows for AM Peak, March 2009 . . . 80
5-8 Oyster and gateline entry and exit counts at stations exclusive to the London Overground with recorded gateline data, March 2009 weekday AM Peak periods 81 5-9 Estimated OD flow vs OD flow from the Oyster seed matrix, clamped to London Overground network . . . 83
5-10 Estimated OD flow vs OD flow from the Oyster seed matrix, by London Overground Line . . . 83
5-11 Smoothed densities of OD validation measures under simulated loadweigh error 89 6-1 Distributions of passenger incidence for different levels of reliability of depar-ture time . . . 96
6-2 Illustration of run-based supply model . . . 101
6-3 Distributions of passenger incidence headways, by line and time period . . . 108
6-4 Distributions of passenger incidence, by London Overground line and time period . . . 109
6-5 Mean scheduled passenger waiting time by London Overground line and time
period . . . 110
7-1 Example Time-Distance Graph . . . 125
7-2 Example probability density function of incidence time for scheduled incidence passengers . . . 128
7-3 Example probability density function of incidence time for random incidence passengers . . . 129
7-4 Example probability density function of incidence time for blended random and scheduled incidence passengers . . . 134
8-1 Time-distance illustration of EJT estimation for a passenger from Stratford to Camden Road . . . 142
8-2 Time-distance plot of timetable and observed Oyster exits for westbound travel on the North London Line on 3 April, 2008 . . . 145
8-3 Distributions of EJT in AM Peak periods . . . 147
8-4 Total EJT, by line and time period . . . 148
8-5 Mean EJT, by line and time period . . . 148
8-6 Daily Mean EJT . . . 150
8-7 Total EJT on the NLL, by time period and direction . . . 150
8-8 Mean EJT on the NLL, by time period and direction . . . 151
8-9 Total EJT by scheduled service, westbound . . . 152
8-10 Mean EJT by scheduled service, westbound . . . 152
8-11 EJT and PPM, by line . . . 153
8-12 Mean EJT vs PPM, for NLL . . . 154
9-1 London Overground Spring 2008 AM Peak service patterns and frequencies . 159 9-2 North London Line Spring 2008 AM Peak timetable . . . 159
9-3 NLL AM Peak load profile . . . 161
9-4 AM Peak passenger incidence on NLL and GOB . . . 162
9-5 London Overground “3 + 3” service patterns and frequencies . . . 168
9-6 North London Line “3 + 3” timetable . . . 168
9-7 Total EJT by scheduled service, westbound, after “3 + 3” implementation . 173 C-1 Schematic map of TfL rail services . . . 194
List of Tables
2-1 Size and patronage of the public transport networks in London . . . 22 2-2 Primary London Overground service patterns . . . 25 3-1 Current and proposed data collection strategies for the London Overground . 34 4-1 Loadweigh calibration results . . . 47 5-1 Labels and weights for identification of alternative paths . . . 71 5-2 Aggregate ratio of assigned Oyster flow to counted flow, by line . . . 80 5-3 Summary statistics for London Overground estimated AM Peak OD matrix . 82 5-4 Selected OD flows with large estimated values and large relative and/or
ab-solute expansions . . . 82 5-5 Comparison of estimated and counted boardings and alightings . . . 85 5-6 Line and line segment level validation on counted AM Peak boardings for
RailPlan (2008) and Oyster-based OD estimates . . . 86 5-7 Average values of validation measures for OD estimation under simulated
loadweigh error . . . 88 9-1 Segment level NLL AM Peak origin-destination matrix . . . 160 9-2 NLL and WLL service under the Spring 2008 and the “3+3” tactical plans . 167 9-3 Volumes of Oyster data in evaluation study periods . . . 171 9-4 PPM and passenger journey time results and comparisons for “3 + 3”
imple-mentation . . . 171 A-1 London Overground stations . . . 189 B-1 London Overground lines and line segments . . . 191
Chapter 1
Introduction
This thesis develops and applies methods for using automatic data to characterize urban railway passenger demand and service quality, primarily for the purposes of supporting railway managers in the process of tactical planning. In the context of this thesis, tactical planning1 is taken to mean the set of transport-specific analyses and decisions required to manage and improve a railway with time horizons measured in weeks, months, or up to a year and little or no capital investment requirements.
This thesis proceeds in three principle endeavors. First, it develops and applies methods to characterize passenger demand spatially, temporally, and behaviorally. Second, it develops and applies a method to characterize service quality in terms of the difference between actual passenger journey times and journey times implied by the published timetable. Finally, it documents how a tactical planning intervention was influenced by the application of these methods, and evaluates the outcomes of this intervention. The broad goal of this thesis is to demonstrate the potential positive impacts of applying automatic data to the management and tactical planning of a modern urban railway.
The automatic data central to this thesis are (i) disaggregate passenger journey transac-tions from an entry- and exit-controlled automatic fare collection (AFC) system, (ii) payload weight measurements from sensors in train suspension systems, and (iii) aggregate passenger volumes from electronic station gatelines. In some cases, a single type of data is sufficient to derive the desired results. More often than not, it is necessary to combine multiple types of automatic data with each other and with reference data such as network representations and public timetables.
The research presented in this thesis has been developed commensurate with the analyti-cal needs of the managers of the rapidly growing, largely circumferential London Overground network in London, England. The methods developed in this thesis are each applied to data from this railway, both as a test of the method and for the sake of analyzing the railway and its passengers per se. This thesis includes a case study which demonstrates the use of these methods to support and evaluate a tactical planning effort on the core portion of the Overground network. While the work in this thesis is motivated primarily by problems facing the managers and passengers of the Overground, the methods it develops should generalize well to other contexts where similar automatic data are available.
Section 1.1 of this chapter describes selected aspects of railway management, including tactical planning, and the relevance of automatic data thereto. Section 1.2 describes the motivations for this thesis, and Section 1.3 describes its specific objectives. Section 1.4 gives an overview of the approach for the research described in this thesis. Section 1.5 describes the organization of the balance of this document.
1.1
Railway Management, Tactical Planning, and
Au-tomatic Data
Railways can be complex and multi-faceted organizations, with certain management func-tions similar to any large enterprise. The aspect of railway management with which this thesis is primarily concerned is tactical planning, as defined in the introduction to this chap-ter. The decision processes that make up tactical planning include the following, as per Wilson (2008), and described in detail by Ceder (2007) and Vuchic (2005). In this type of planning, demand levels are often considered to be constant.
• Network Design – route design over a fixed infrastructure network.
• Frequency Setting – determination of service frequencies for each route, for different service periods (e.g. by time of day and day of week).
• Timetable Development – creation of a specific timetable, including running times, to provide a certain frequency of service on a set of routes.
• Vehicle Scheduling – scheduling of vehicles to cover all trips in the timetable. • Crew Scheduling – scheduling of crews to staff all vehicles.
These decisions are often but not always described and implemented hierarchically, as shown in Figure 1-1.
At the top of the hierarchy, starting with network design, decisions tend to be infrequent, dominated by service considerations, and driven by judgment and manual analysis. Moving down the hierarchy, towards crew scheduling, decisions are more frequent, dominated by cost concerns, and can be computer driven by automatic tools such as optimization-based scheduling software. Tactical planning thus encompasses numerous types of analyses and decisions, only a few of which are treated explicitly in this work, more of which can benefit from the methods developed here, and many of which could benefit from the use of automatic data in general.
The decisions made on a day-to-day real-time basis to implement a given tactical plan can be described as service control. Studied by Carrel (2009) for high frequency urban railway services, these decisions include the assignment of physical vehicles to vehicle schedules, the assignment of drivers to vehicles, and various types of modifications to these schedules and to the timetable to account for disruptions and delays. Froloff et al. (1989) study and describe this topic for urban bus, rather than railway, services.
Decisions made with much longer time horizons or demanding substantial capital invest-ment can be referred to as strategic planning. This type of planning is more akin to overall
Network Design Frequency Setting Timetable Development Vehicle Scheduling Crew Scheduling Cost Considerations Dominate Frequent Decisions Computer-Based Analysis Dominates Infrequent Decisions Service Considerations Dominate Judgement & Manual Analysis Dominate
Adopted from Wilson (2008)
Figure 1-1: Conceptual diagram of tactical planning hierarchy.
transport planning, as described by Meyer and Miller (2001). It typically considers substan-tial changes to land use, economic development, and overall levels of demand as well as shifts of demand between different transport modes (e.g. public vs. private transport).
Information Technologies and Automatic Data
At a major urban railway by which the author has been employed, staff from the lowest to the highest levels refer to the operation of the railway as “making service.” This choice of words attests to the fundamental nature of railway operation as an industrial production process. Like other service and manufacturing production processes, railways are heavily dependent on technology. For example, the capacity of a railway is largely determined by the design of its propulsion and signaling systems (Kittelson & Associates, Inc et al., 2003b). In railways, as in other technology-driven industries, information technology (IT) has played an increasingly larger role over time. Traditionally, railways have invested heavily in IT systems for core production and real-time management functions such as signaling, dispatching, vehicle operation, and service control (Vuchic, 2007), as well as key auxiliary functions such as fare collection (Multisystems, Inc et al., 2003) and passenger information systems (Multisystems, 2003). By their very nature, these IT systems serve to automatically create, transmit, manipulate, display, and store electronic data. This thesis is not about the impact of these kinds of systems per se on railway operations. Rather, this thesis is about how the data produced and stored by these various IT systems can and should be used in analytical management functions, specifically tactical planning. It is hoped that the methods developed in this thesis find application in other contexts as well.
1.2
Motivation
Most broadly, this thesis is motivated by the hypothesis that the managers of railways and other public transport services have much to gain from the use of automatic data sources for
tactical planning. These data sources represent a significant and often unused analytical asset that can be highly leveraged to help improve service and decrease costs in many different contexts.
On a more narrow level, this work is motivated by a need in the railway industry for methods to make more effective analytical use of available automatic data to understand passenger demand and service quality. In that sense, it is motivated by needs of managers of railways in London and around the world facing similar tactical planning challenges as the managers of the London Overground. One such need is to better understand and measure passenger behavior and service quality, and to understand how specific tactical planning interventions affect certain aspects of the passenger experience.
On the most narrow level, the work in this thesis is motivated by the immediate and ongoing analytical needs of the mangers of the Overground. Foremost among their needs are the ability to measure passenger loads on individual scheduled services, to estimate total passenger boardings at individual stations, and to understand passenger travel patterns at the level of origin-destination (OD) flows. Currently, these needs are met primarily through manual data collection efforts, and so are impossible to satisfy cost-effectively at desired frequencies or sample sizes. An additional contemporaneous need of the Overground’s managers is to understand the overall impact on passengers of the recent tactical planning exercise on the core portion of the Overground network.
1.3
Objectives
The most broad-based objective of this thesis is to investigate the use of automatic data in the tactical planning of urban railways. This should be accomplished by demonstrating that the use of automatic data through application of the methods developed here in fact contributed to measurable improvement in the service quality of the London Overground.
A more specific objective is to provide to the Overground’s managers insights into pas-senger demand and service quality that are relevant to tactical planning but are inaccessible without automatic data. In other words, to develop methods that take advantage of the rich-ness of available automatic data to achieve the following previously unavailable analytical results.
• Understand the relationship between the published timetable and passenger arrival behavior at stations.
• Measure railway service quality as experienced by passengers in terms of the difference between actual journey times and journey times implied by the published timetable. • Document the recent tactical planning exercise on the core portion of the Overground
network, including the application of the above results to this process.
• Evaluate the outcomes of the resulting tactical planning intervention. This evaluation should be primarily from the perspective of passengers, but should also consider the experience and process of operators and managers.
An additional objective of this thesis is to develop a prototype of a data collection scheme with associated methods to meet the immediate and ongoing analytical and tactical planning needs of the mangers of the Overground. This scheme should maximize the use of automatic data and minimize cost, primarily through minimizing the need for manually collected data. It should improve the quality, breadth, and timeliness of its outputs, with the goal of sup-porting continued improvement in Overground services through improved tactical planning. The specific objectives are as follows.
• Understand the error associated with train payload weighing systems, and calibrate them for use in directly measuring passenger loads on trains.
• Develop and test a method to estimate station-to-station origin destination flows on the Overground at the time-period level, and use this result to estimate total boardings at the station level.
1.4
Research Approach
The overall approach to this research is pragmatic and applied. Since the goal is to address certain issues faced by the managers of urban railways, this thesis draws on models and techniques from existing literature whenever possible and proposes new methods only when necessary. Mathematical models and statistical techniques, when necessary, are selected to be as simple as possible, but no simpler.
To achieve the stated objectives, the research in this thesis will do the following.
• Calibrate loadweigh systems using a linear regression of a sample of loadweigh measure-ments from the London Overground against paired manual on-board passenger counts. Use the results of this regression to understand the error associated with loadweigh data.
• Estimate station-to-station passenger demand for the Overground in the AM Peak period from multiple sources of data using network and mathematical models. The data sources used are aggregate Oyster journey data, automatic gateline entry counts, and a complete set of manual on-board passenger counts (standing in for loadweigh data). Test the sensitivity of this estimate to randomness in the on-board counts when estimated from loadweigh data.
• Assign individual Overground passenger journeys with specific scheduled services in the published timetable. This assignment depends on network models and algorithms applied to each Oyster journey and its associated origin, destination, and time of entry time into the system.
• Using that assignment, analyze passenger arrival behavior at stations by comparing the entry times of passenger journeys with respective scheduled departure times. • Also using that assignment, measure service quality in terms of the difference between
passenger journey times from the published timetable. Aggregate these values along a variety of dimensions to assess service quality on the Overground.
• Document the recent tactical planning exercise on the North London Line of the Over-ground network, including its use of these and other results.
• Evaluate the outcomes of implementing the new tactical plan resulting from this exer-cise, primarily in terms of its effects on passengers.
• Use this case study as means to assess the applicability of the methods developed in this thesis for improved tactical planning using automatic data.
1.5
Thesis Organization
This thesis is organized into 10 chapters, including this one. Chapter 2 provides background information on the London Overground and the broader network of public transport ser-vices in London, England. Chapter 3 describes the various data sources available to the Overground, automatic or otherwise, how they are currently used by the Overground, and how they could be used. Chapter 4 develops and applies a method for calibrating train payload weighing systems to measure passenger loads. Chapter 5 develops and applies a method, tailored to the circumstances of the Overground, to estimate time period level origin-destination matrices from multiple data sources. Chapter 6 develops and applies a method to analyze passenger arrival behavior at stations. Chapter 7 develops and justifies a unified method to use actual passenger journey times to measure service quality relative to published timetables. Chapter 8 applies that method to the Overground, validates it, and compares it to existing performance measurements. Chapter 9 presents a case study on the use of these methods to inform and evaluate a recent tactical planning exercise on the Overground. Chapter 10 offers some final remarks, including conclusions, recommendations, and areas for future research.
This thesis covers a range of topics but is intended, to a certain degree, to be consumable in a piecemeal fashion. To that end, it groups literature review, methodologies, and results topically into single chapters or consecutive sets of chapters. This applies most directly to Chapter 4, Chapter 5, Chapter 6, and the combination of Chapters 7 through 9.
Chapter 2
Public Transport in London
This chapter provides a broad background of the city of London and its public transport network, including the London Overground. Section 2.1 gives a brief introduction to the city of London. Section 2.2 describes some of the key elements of London’s public transport network. Section 2.3 describes the fare structure and ticketing systems of that network. Section 2.4 describes the Overground network from a transport perspective. Section 2.5 describes the institutional structure of the Overground. Finally, Section 2.6 describes some of the key elements of the Overground’s investment program.
2.1
London and the Greater London Authority
London, a city of approximately 7.5 million inhabitants covering 1,572 square kilometers, is located in the southeast of the United Kingdom, of which it is the capital (Government Offices, 2010). The Greater London Authority (GLA), created by a 1999 act of the British parliament, governs London at a regional and strategic level. The primary executive of the GLA is the popularly elected Mayor of London (Greater London Authority, 2010a). The Mayor has wide powers over the city’s transportation agency, Transport for London (TfL), including setting its strategy and budget and appointing its board. TfL manages most facets of the transport system in London, including roads, the congestion charge, and local public transport (Greater London Authority, 2010b). It has an ambitious investment program of over £35 billion from 2009 through 2018 (Transport for London, 2009c).
2.2
The Public Transport Network
London has a world class public transport system, serving an estimated 12 million passenger “journey stages” on an average in 2007, representing a growth of almost 60% since 1991 (Transport for London, 2009f). Table 2-1 shows the size (in stops or stations) and annual ridership of the largest components of this system, described in further detail in the following paragraphs.
London’s more than 8,000 local buses ply a network serving almost 19,000 stops on over 700 routes, carrying an estimated 2 billion yearly passengers (Transport for London, 2009d). The London Underground (LU), a world-famous metro system with routes going back 150
Number of Approximate Annual
Network Stops or Stations Ridership (millions)
London Buses 19,000 2,000
London Underground (LU) 402 1,000
Docklands Light Railway (DLR) 40 70
London Overground (LO) 56 33
National Rail (NR) in London 318 883
Table 2-1: Size and patronage of the public transport networks in London
years, serves an estimated billion passengers annually on a 402 kilometer network of 270 stations on 11 lines (Transport for London, 2010c). The Docklands Light Railway (DLR), which opened in 1987, serves an estimated 70 million yearly passengers on a 40-station network in parts of East London and the newer Canary Wharf financial district (Transport for London, 2009b). The London Overground, an above-ground urban railway re-christened in 2007, serves an estimated 33.4 million passengers annually over a largely circumferential 107 kilometer network of 56 stations on four lines (Smales, 2009). It is the focus of the research in this thesis and will be described in further detail in the following sections.
The United Kingdom’s system of regional and inter-city railways, referred to as National Rail (NR), serves London’s commuters and visitors at 318 stations within Greater London (Office of Rail Regulation, 2009) and connects the capital with the rest of the country. The National Rail network serves an estimated 833 million passengers annually in London and the southeast of England, and an estimated 1.2 billion passengers across the entire country (Office of Rail Regulation, 2008). National Rail services are operated by twenty-nine regional Train Operating Companies (TOCs) across the entire country, most of which serve London either in a commuter or long distance capacity (National Rail, 2010). Each TOC operates according to a competitively bid franchise agreement, let by the national Department for Transport (DfT). This is of particular relevance to this thesis because of the Overground’s unique relationship, described in the following sections, to both TfL and the National Rail system.
Broadly speaking, London’s public transport is very well integrated. Interchanges be-tween the different rail services are available at more or less all possible opportunities (Trans-port for London, 2010e), and most if not all bus routes connect to the rail network at one or more points.
TfL is responsible for all the services described in this section other than those operated by National Rail TOCs. Only the London Underground is operated directly by TfL employees. All other bus and railway services are provided by competitively bid operational concessions let by TfL. In all of these concessions, TfL holds all of the revenue risk in some concessions and almost all of the revenue risk in others. TfL itself is organized into modal units and a central corporate finance and planning group. The largest modal units are eponymous London Underground, Surface, managing roads and Buses, and London Rail, which manages TfL’s other rail services (including the Overground and the DLR) as well as acting as TfL’s liaison to the National Rail network and the TOCs. Figure 2-1 provides a high level organization chart illustrating these relationships for providing public transport service (this chart does not describe the ownership and responsibility for infrastructure).
Department for Transport (DfT)
Mayor of London
TOC TOC TOC
National Government Transport for London (TfL) London Buses National Rail
Train Operating Companies (TOCs) … London Rail London Underground … Bus Concessions LOROL DLR Concession Ownership/Subsidiary Relationship Contract/Concession Relationship
Figure 2-1: High level institutional structure for public transport service provision in London
2.3
Public Transport Fares and Ticketing
The fare structure for rail services in London is integrated, with the primary exception that neither transfers between buses nor between bus and rail are free for passengers lacking unlimited-use passes. Rail travel in London, be it by TfL or National Rail services, is generally priced on a zonal basis, where the zones are oriented concentrically around Central London (see the map in Appendix C). The price of a journey depends not only on the starting and ending zones, but also on which zones that journey has passed through – trips through lower zones (i.e. through more central parts of London) cost more. Rail fares also have a temporal component, with a premium charged for travel during peak commuting hours. Interchanges between rail services are free in some (e.g. between London Underground lines), but not all cases (e.g. between some National Rail and Underground services). Bus travel is priced on a per-boarding basis, with no discount for interchanging between buses or between bus and rail (Transport for London, 2010b).
Unlimited-use passes, called travelcards or season tickets, are also available for different zonal combinations (e.g. zones 1-2, 1-3, 2-4, etc) and different lengths of time (e.g. one day, seven days, 30 days, one year). Travelcards cover all public transport travel – all TfL and National Rail services – within the selected zones. The price of a travelcard of course
depends on the zonal and temporal coverage, with the potential discount offered to the purchaser increasing with the temporal span of the ticket (Transport for London, 2010a). London’s public transport fare structure includes a host of other discount schemes, including bus-only passes, concessions for students and the elderly, and point-to-point season tickets on National Rail.
Public transport fares in London are clearly complex, but the application of ticketing technologies has progressively simplified the details that passengers must understand and choices they must make. In particular, the introduction and evolution of the Oyster smart-card ticketing system has made certain aspects of public transport ticketing in London much more efficient for passengers and for operators. A passenger can add monetary value to his or her Oyster card in bulk and then simply “Pay As You Go” (PAYG) by validating the card when entering and exiting the transport network (Transport for London, 2009e). The Oyster system deducts the correct amount of money from the passenger’s card for each jour-ney, including in such complicated cases as “Out-of-Station Interchanges” (OSIs) when the journey requires exiting and re-entering the transport network to transfer between services at certain nearby but unconnected stations. This saves passengers without travelcards the effort of having to purchase individual tickets for each journey, and saves operators the effort of having to sell them. To incentivize the use of Oyster cards, TfL has imposed a significant price penalty for the purchase of single tickets (Hong, 2002).
Oyster cards also support the purchase and use of travelcards, which TfL no longer offers on traditional magnetic-stripe media. TfL no longer offers single-day travelcards either, instead offering Oyster PAYG users daily “price capping” or “best value.” Under this scheme, the Oyster system calculates the price of the single-day travelcard or pass that would have been necessary to accommodate all of the user’s rail and bus travel on that day, and stops deducting from their Oyster card’s balance once that amount has been reached (Transport for London, 2009e).
Traditionally, neither PAYG nor daily capping were available for most of the National Rail network. In January, 2010, this changed with the negotiation and implementation of the Oyster eXtension to National Rail (OXNR) project, which extended the Oyster system to almost all National Rail stations within Greater London (Transport for London, 2010b). However, the various National Rail TOCs do not generally retail Oyster products (neither cards nor PAYG value nor travelcards) at their stations, so many National Rail passengers in London still use magnetic-stripe tickets, chiefly travelcards, to pay for their journeys (Chan, 2007).
Since its introduction in 2003, the Oyster system has grown to become the dominant fare media for TfL services, processing over 10 million transactions daily. Over 6 million cards are in regular use, and over 80% of all bus and London Underground journeys were made using Oyster in 2009 (Transport for London, 2009e). That said, there are circumstances where Oyster has significantly less penetration on the TfL network. This is most often the case at places and times where large volumes of National Rail commuters or visitors interchange to or from TfL services, for example at large intermodal facilities (e.g. Victoria station) during peak commuting hours (Chan, 2007). This must be considered when using the Oyster system as a source of data on passenger journeys.
2.4
The London Overground Network
Figure 2-2 shows a map of the London Overground network (with other railways) as of Jan-uary, 2009. A schematic map, with detailed interchange information is shown in Appendix C. The Overground network is for the most part circumferential, primarily orbiting London to the North and West, with only a single station (Euston) in fare zone 1 and the majority of stations in zones 2 and 3. The Overground is very much part of the overall integrated network of TfL and National Rail services, with 19 of its stations offering interchanges to London Underground or DLR services and 13 of its stations offering interchanges to National Rail (24 stations offer at least one interchange). Key Overground stations, such as Stratford, Clapham Junction, and Euston, are major intermodal terminals or interchange points. In 2010, the Overground is running 407 scheduled weekday trips with 27 units of rolling stock (i.e. trains) (Brimbacombe, 2010).
Services on the Overground are for the most part divided into four different lines (i.e. service patterns) as described in Table 2-2. The core of this network is the North London Line (NLL) which runs 28 kilometers between Stratford in the northeast of London and Richmond in the southwest, connecting to every other Overground service and numerous other TfL and National Rail services along the way. It is by far the busiest Overground line, with the most frequent service and an estimated 58% of all Overground boardings (Smales, 2010). The NLL runs four (end-to-end) trains per hour (tph) over most of the day, with some seg-ments receiving six tph during the peak periods. Of the twenty-three stations on the NLL, seventeen are served only by the Overground.
The other Overground lines run at lower frequencies of three tph during the peak periods and two to three tph during other periods. In the case of the Gospel Oak to Barking (GOB) line, which is the only service available at nine of its twelve stations, these lower frequencies are the result of relatively low passenger demand. The other two Overground lines run at these low frequencies because of competition from other services. The five-station West London Line (WLL) shares all but one five-station (Willesden Junction, its northern Terminus) with another National Rail TOC. The much longer nineteen-station Watford DC Line runs interavailably1 for ten consecutive stations in the middle of its route with the
London Underground’s Bakerloo line, and National Rail express services run much more quickly from some of its northernmost stations to its southern Central London terminus (Euston). During peak periods, select Overground services run special patterns described in detail in Chapter 9.
Service Pattern (Line) Code Primary Terminals Frequency
(Peak tph)
North London Line NLL Stratford ⇔ Richmond 4-6
Gospel Oak to Barking Line GOB Gospel Oak ⇔ Barking 3
Watford DC Line WAT Watford Junction ⇔ London Euston 3
West London Line WLL Clapham Junction ⇔ Willesden Junction 2-3 Table 2-2: Primary London Overground service patterns
1“Interavailability” describes the situation where two (or more) services are available on the same platform
Ov erground lines are denoted in orange (dashes indicate lines in planning or under construction), Underground (an d DLR) in red, and National Rail in blue Figure 2-2: Map of the London Ov erground net w ork, with other rail services
On November 11, 2007, overall management and revenue responsibility for this set of services was transferred to TfL from the Silverlink TOC which held the prior National Rail franchise. At that time, the network was re-branded as the Overground and became fully Oyster-enabled. TfL’s goals in absorbing the Overground were to improve service standards (including station safety and staffing) and to deliver the investments and expansions de-scribed in Section 2.6 (Transport for London, 2007a). TfL contracted the operation of the Overground to a private concessionaire, creating the fairly unique institutional structure described in the following section.
2.5
Institutional Structures
London Rail, also referred to legally as Rail for London (RfL), delivers London Overground services through a concession contract with the private operator London Overground Rail Operations Limited (LOROL). London Rail plays other non-operational roles in the man-agement of the Overground network, including
• planning and specifying service levels, including frequencies and train lengths, • planning and funding major investments (i.e. strategic planning),
• delivering those investments through contracts with infrastructure and rolling stock providers,
• monitoring and forecasting revenues and demand,
• working with LOROL to respond to changing conditions on the network, • and communicating with the riding public and other stakeholders.
In this sense, tactical planning for the Overground is a shared responsibility between London Rail and LOROL.
LOROL is a joint venture between two world-class private (but largely state-owned) railway operators – MTR Corporation of Hong Kong and Deutsche Bahn AG of Germany (LOROL, 2010). Among LOROL’s contracted responsibilities are to
• develop public and working timetables to meet certain service level commitments, • hire and train station staff, train crews, and service controllers,
• make and manage train and station service on a daily basis, • conduct light maintenance on stations and vehicles,
• gather information on passenger demand,
(Rail for London Limited and MTR Laing Metro Limited, 2007).
Note that LOROL is not responsible for maintaining and operating the infrastructure (i.e. tracks, switches, and signals) on which it runs. This is because the Overground operates on infrastructure owned, maintained, and operated by Network Rail, the public benefit cor-poration responsible for the National Rail network infrastructure. LOROL operates within a well defined institutional, financial, and political framework that structures the relationships between the infrastructure owner (i.e. Network Rail), operators (i.e. TOCs), and sponsors (i.e. DfT and TfL).
An in-depth discussion of this framework is beyond the scope of this thesis. It is sufficient to say that the institutional structure described here places the Overground in a unique context in London. On the one hand it is the only National Rail franchise let by other than DfT and with essentially no revenue stake for the franchisee. On the other hand, it is the only TfL service that is run by a private operator on infrastructure owned neither by TfL nor by the operator. One implication of this arrangement, further discussed in Chapter 8, is that the performance and incentive regime for the Overground is rooted in the regime used across the National Rail network.
2.6
Investment and Expansion
The London Overground network is currently the subject of over £1.5 billion of investment in extensions, infrastructure upgrades, and new rolling stock. As a result, it is set to grow significantly over the next several years in terms of network size, service density, and pas-senger demand. A longer-term goal of these investments is to support access to Stratford, the site of the 2012 Summer Olympic Games (Transport for London, 2007b, 2009c). Among the most significant investments in the Overground network are:
East London Line Extension (ELLX) – Opening in stages starting in the spring of 2010, this project will rehabilitate and extend what was the London Underground East London Line and add it to the Overground network. Shown in Figure 2-2, the old East London Line is being extended to the north and to the south, and will enter service with 12 tph on the trunk portion. North of Shoreditch High Street station, new infrastructure will bring rail service for the first time to some parts of inner East Lon-don. South of New Cross Gate station, a connection to the National Rail network will improve access from South London to the TfL network and to parts of East London. Some service on this line will eventually terminate at Highbury & Islington and connect directly to the North London Line. This project is projected to serve an estimated 33.2 million passengers in 2011 (AECOM, 2006), effectively doubling Overground ridership. North London Railway Infrastructure Package (NLRIP) – To be completed in ad-vance of the 2012 Olympics, this project will upgrade track, switches, and signals, primarily on the core portion of the North London Line between Stratford and Willes-den Junction. These are set to support frequencies of up to 12 tph on the North London Line.
East London Line Phase 2b – Through a number of small connections and reconfigura-tions, this project will connect the Overground between Crystal Palace (on the ELL)
to Clapham Junction (on the WLL) through South London. Set to open in 2012, it will complete the Overground’s orbital route structure.
New Rolling Stock – By 2012, the entire planned Overground fleet of 216 rail cars, in three-car and four-car trains, will be new Class 378 vehicles from Bombardier Trans-portation. This fleet has wider doors and longitudinal seating to improve the capacity and performance under heavy demand, and passenger amenities such as air condition-ing and improved passenger information systems. An important feature of this fleet in the context of this thesis is that its computerized braking systems will measure and report train payload weights for the sake of estimating passenger loads.
This Overground investment program is just one part of the much larger and very ambi-tious TfL investment program, which includes major upgrades to the London Underground and DLR as well as the new £16 billion Crossrail project (Transport for London, 2009c).
Chapter 3
Data Needs and Sources
This chapter proposes a new approach to data collection and demand estimation for the London Overground network. The new approach is designed to minimize cost and maximize the use of automatic data sources while satisfying the various reporting and analytical re-quirements of the network’s public owner and private operator. It is designed to improve the quality, breadth, and timeliness of its outputs, with the goal of supporting continued improvement in Overground services through improved tactical planning. Broadly speaking, the goal of such a strategy is to change data collection from an infrequent, expensive, manual process to a frequent, cost-effective, automatic one.
Section 3.1 describes the immediate data needs of the managers and planners of the Overground and how those needs are currently met. Section 3.2 outlines an approach to meet these specific needs using a range of automatic data sources. Section 3.3 describes in detail each data source, with respective limitations, that will be used to support the proposed approach and other methods and analyses developed later in this thesis.
3.1
Data Needs
While TfL’s and LOROL’s interests are generally aligned, they have different analytical data needs as a consequence of their different responsibilities. The primary quantities of interest to TfL and/or LOROL analysts and tactical planners are the following (Smales, 2009; Bratton, 2009).
• Average loads on individual scheduled services (i.e. timetabled trips) between all con-secutive stations.
• Average total boardings, by station, at the time period (e.g. AM Peak) level.
• Average origin-destination flows between all pairs of Overground stations at the time period level.
TfL’s concession contract with the Overground’s private operator requires twice-yearly passenger counts (Rail for London Limited and MTR Laing Metro Limited, 2007, Schedule 1.5). To date, these counts have been designed to directly measure boardings, alightings, and loads at each station once (per counting period) for each scheduled service. They indicate
utilization rates and capacity issues on Overground services, of interest to both TfL and LOROL. However, because of the small sample size, these counts are likely not statistically sound.
Passenger counts do not directly indicate demand at the individual origin-destination (OD) flow level, nor do they describe how passengers use the Overground in conjunction with other modes (e.g. the London Underground). Such information is primarily of interest to TfL, and can be derived from OD flow matrices. Currently, the only OD matrix available to Overground analysts and tactical planners comes from the RailPlan strategic model, which in turns depends on the results of LTDS, London’s regional transport model, which uses household surveys and census data as inputs . It is available only for the AM Peak, is out of date and is based on very small sample surveys (Warner, 2010). As a result, it may not accurately reproduce current demand patterns at the OD flow or station (i.e. boarding or alighting) level.
Broadly speaking, Overground management (Bratton, 2009; Smales, 2009) have expressed the need for a strategy that provides them with the same analytical quantities with which they are used to working, but does so in a cheaper and more timely manner than is currently available. The next section proposes a means to accomplish this, primarily through the adoption and combination of automatic data sources.
3.2
A Synthetic Approach for the London Overground
In general, data from automatic systems are cheap and plentiful but do not capture complete information from every passenger. Manual counts and surveys can fill some of the gaps left by automatic systems, but are expensive to gather and therefore often insufficiently sampled. Any source, taken alone, has some inherent ambiguity. This chapter, along with Chapters 4 and 5, seek to illuminate the limitations of each source and design the most effective strategy to use them all together. This following section proposes such a strategy that uses automatic data to meet the London Overground’s analytical requirements.
Several sources of automatically collected data on passenger quantities and behavior, each with its own limitations, are readily available but as of yet largely unused in analysis and management of the Overground. Electronic transactions from the Oyster smartcard ticketing system describe individual journeys on the TfL rail network, but only a some fraction of all journeys. Ticket gatelines, where present, automatically provide aggregate counts of station entries and exits, but do not distinguish between passengers of different services at a given station. With the delivery of new rolling stock, each Overground train will automatically weigh and electronically report its passenger payload over the length of each trip. It is hoped that these “loadweigh” systems on new rolling stock can provide a cheaper and more statistically sound alternative to the manual on-board counts, but they require calibration and will not indicate station boardings and alightings nor passenger origins and destinations. None of these electronic data sources, taken alone, tells the complete story of how pas-sengers use the Overground. Used in conjunction, what they may lack in completeness they may make up for in quantity, variety, and cost. One objective of this thesis is to develop ways to combine the various automatic data sources, and to target manual data collection resources for maximum cost-effectiveness, to meet the needs of Overground managers.
The following data sources, are available for the development of the proposed approach. • 100% samples of Oyster journey data for selected blocks of time. As a function of London’s fare policy for rail journeys, transactions from its smartcard ticketing system record the stations and times of entry and exit for each journey. As mentioned, this data source does not cover journeys made using other fare payment methods.
• Aggregate gateline counts of entries and exits at stations with Overground services. Gatelines automatically record the total entries and exits over each fifteen-minute time interval, including passengers using non-Oyster fare media.
• Loadweigh measurements from new rolling stock, which will automatically sense and report the weight of the payload of each rail car. These weight measurements can be transformed into passenger counts through calibrated models relating passenger counts and weights.
• A complete set of manual passenger counts conducted in the Spring of 2009, cov-ering all weekday services on the entire Overground network.
• A network representation of the London Underground (LU), London Overground (LO), Docklands Light Railway (DLR), and selected National Rail (NR) services. The particular network model to be used is developed by London Underground as part of their Rolling Origin and Destination Survey (RODS).
This thesis proposes to use the above automatic data sources to meet the immediate needs of the Overground’s managers through the following.
• Estimate passenger loads on trains directly from loadweigh data systems. This requires calibration of the loadweigh systems to understand the associated measurement error, as discussed in Chapter 4.
• Use a mathematical process to estimate origin-destination flows by combining those passenger loads with automatic gateline entry/exit counts, representative Oyster jour-ney data, and selected strategic manual counts. This requires a significant modeling effort, as discussed in Chapter 5.
• Using the models developed for OD estimation, assign the estimated OD matrix to the Overground network to determine the total number of boardings at each station. This is also discussed in Chapter 5.
• Estimate the total number of trips on the Overground (where a trip can include multiple boardings) as the sum of the OD matrix. Note that the current strategy does not provide estimates of this quantity.
Current Proposed
Analytical Data Temporal Statistical Data Termporal Statistical
Quantity Source Aggregation Basis Source Aggregation Basis
Train Loads Manual Counts
Train Trip 1 Day Loadweigh Train Trip Weeks/
Months
OD Matrix LTDS/
Railplan
AM Peak
Only
1 Day Oyster & Loadweigh & Gatelines Time Period Weeks/ Months Boardings & Alightings Manual Counts
Train Trip 1 Day OD Matrix Time
Period
Weeks/ Months Total
Ridership
N/A N/A N/A OD Matrix Time
Period
Weeks/ Months Table 3-1: Current and proposed data collection strategies for the London Overground
3.3
Data Sources
The balance of this chapter describes the various data sources upon which the proposed approach and other aspects of this thesis depend, including known issues for each source that require investigation.
3.3.1
The Oyster Smartcard Ticketing System
As discussed in Chapter 2, the structure of London’s fare policy and technologies requires most Oyster users to validate their cards upon all entries and exits to the system. The centralized computer systems that support the Oyster system record and archive these entry and exit transactions in an easily accessible modern database. As a result, disaggregate Oyster journey data are cheap to gather in large volumes, and provide a prime source of data on individual passenger journeys and aggregate OD flows.
Oyster transactions are stored in the Oyster “Central System” across a collection of database tables – one for rail entries, one for rail exits, one for bus boardings, etc. A specialized query has been designed to extract the necessary data from these tables to support research purposes such as that described in this thesis. This query links data from these tables with each other and with reference tables to produce a single table describing all journeys recorded in the Oyster system (Gaitskell, 2008). Some fields of this table are populated differently for bus and for rail journeys. For rail journeys, the information provided includes:
• The Oyster card identifier (“card ID”), uniquely identifying each Oyster card in the database, anonymized to protect passenger privacy. It is typically assumed in analyzing Oyster data that each card ID represents a unique passenger.
• The station and time of first entry into the system. • The station and time of last exit from the system.
• The fare type of the journey (i.e. single fare, unlimited use, or a mix between the two). • The fare paid.
• The innermost and outermost fare zones for which the journey was charged.
These data provide an extremely rich corpus with which to study many aspects of pas-senger demand, behavior, and experience on London’s public transport network. However, Oyster data do not provide a complete picture for a number of reasons.
• Not everyone uses Oyster. The penetration rate across all TfL services is estimated to be approximately 80% (Transport for London, 2009e), but varies in space and in time across the TfL network (Chan, 2007).
• Some stations, including many of those served by the Overground, are ungated. Pas-sengers using these stations in unlimited-use fare categories (e.g. weekly and monthly travelcard users) are not required to validate their Oyster cards at ungated stations. • Oyster data describe only the first and last station used on a given trip. TfL’s rail
network is integrated and complex, with many journeys involving free interchanges, many stations served by numerous services, and multiple possible routings between station pairs. Many Oyster records are inherently ambiguous with regard to whether the Overground was in fact used at all, depending on the available routes between the origin and destination stations.
• The timestamps of all Oyster transactions are stored in the Central System in a trun-cated form – they indicate the time of day in minutes but not in seconds. Consequently, the times of passenger entry and exit available for research purposes are less precise than would be desired.
Nevertheless, as discussed in Chapter 5, Oyster data will play an important role in estimation of OD matrices for the Overground. The methods for estimating OD matrices that will be considered generally depend on some prior estimate of the OD matrix (also called a “seed matrix”) to produce good results. The Oyster system will provide that estimate. Oyster data will also be used to analyze passenger station arrival behavior in Chapter 6 and passenger journey times in Chapters 8 and 9.
3.3.2
“Loadweigh” Train Payload Weighing Systems
The term “loadweigh” refers to electronic systems that estimate train payloads from mea-surements of air pressure in suspension systems (Interfleet Technology, 2004). All new Over-ground rolling stock are equipped with loadweigh systems for the explicit purpose of esti-mating passenger loads. Loadweigh data, although not yet tested on the Overground, are expected to allow estimation of actual loads on trains with reasonable accuracy, however saying nothing about boardings and alightings at each station. Experience with these sys-tems at other Train Operating Companies is positive (Southern Railway LTD, 2009), but they have not tried to use these data in conjunction with other sources such as Oyster.
Loadweigh systems measure the weight of a train’s contents, and thus report their mea-surements in units of mass (which of course is directly proportional to weight) (Interfleet Technology, 2004). As a result of variability in passenger weights and possible measurement error in the loadweigh system itself, there is expected to be some error associated with the estimates of passenger loads derived from loadweigh data. Chapter 4 will explore this issue further.
3.3.3
Station Gatelines
Entry and exit counts from station gatelines are typically used by the London Underground to scale up the results of manual origin-destination surveys (Maunder, 2003) or Oyster-based seed matrices (Wilson et al., 2008). In the Overground case, a large portion of traffic starts or ends at stations shared by multiple rail providers, so gateline data are ambiguous with respect to whether a given passenger used the Overground at all. Eleven stations (out of 56) are both fully gated and exclusive to the Overground. For the AM Peak period in the Spring of 2009, these eleven stations admitted an estimated 8,600 passengers out of the estimated 39,000 total Overground boardings (22%). Another 21 stations are gated but provide access to other London Underground or National Rail services.
3.3.4
Manual Passenger Counts
Under the current manual counting scheme, the boarding, alighting, and on-train load are sampled at most once for each scheduled service at each station. This presents the obvious statistical issue of assuming there is no day-to-day variation in demand which, lacking any other data, is remedied only at unreasonable cost. Nevertheless, these manual counts should be of use in testing and validating OD estimation methodologies, especially in the absence of complete loadweigh data.
Overground management expects to continue manual counts on non loadweigh-enabled portions of the network until new rolling stock is delivered. However, the concession contract allows LOROL to substitute loadweigh estimates for manual counts as loadweigh becomes available. This, combined with recent cost reduction initiatives at TfL, severely limits the ability of TfL to sponsor additional manual counts in the future (Smales, 2010).
3.3.5
Network Representations
TfL maintains (at least) two detailed representations of London’s public transportation net-work. Corporate and strategic planning groups developed and use the RailPlan model, which represents all bus and rail modes in London, for long-term investment planning. RailPlan is implemented inside the proprietary EMME/2 transportation planning software package, and is regularly updated and modified by staff across TfL for various planning tasks.
The Strategy and Service Development group at London Underground has developed a rail-only model, focused on its own network but including competitive services, for use in its Rolling Origin and Destination Survey (RODS is in fact a combined OD estimation and network assignment model). It is implemented as a suite of custom in-house software tools
and represents the transport network as a set of easy-to-share flat files. The RODS model and data are well explained in internal TfL documentation (Maunder, 2003).
The network representation from the RODS model will be used in this work because of its open and easy-to-share nature, and because it was designed and implemented with OD estimation in mind. It was not, at the outset, sufficiently detailed with respect to the Overground, but the additional detail was straightforward to add. Most of the necessary updates were to
• distinguish Overground services from other National Rail services at certain stations, • reflect current Overground service patterns and frequencies,
• and explicitly represent entries, ticket halls, and exits at Overground stations lacking those features in the model.
3.3.6
Additional Data Sources
Train Control Systems – Modern train signaling, supervision, and control systems record extensive data indicating actual railway operations. Many systems, including the Na-tional Rail network used by the Overground, record the movements of every train on the network. The use of this type of data to support operating strategies and tactical planning has been researched extensively, for example by Rahbee (1999, 2006), Vesco-vacci (2001), Lee (2002), and Carrel (2009). This thesis does not deal with this type of data directly, but uses performance data and cites other analyses of Overground operations both derived from these type of data.
National Rail Performance Monitoring Systems The National Rail network has an elaborate performance monitoring and delay attribution framework in place. Its TRUST system uses data from signal and control systems to monitor and record all train move-ments (Office of Rail Regulation, 2010). These records are used to calculate the Public Performance Measure (PPM), a measure of train on-time performance at terminals (Office of Rail Regulation, 2008). A complex delay attribution methodology, requiring substantial manual inputs, is used to allocate delays to responsible parties (TOCs, Network Rail, etc) for the sake of performance monitoring and financial remuneration (Network Rail, 2009). Chapters 8 and 9 use some of these outputs to evaluate the pro-posed measures of service quality and the outcome of the tactical planning intervention on the North London Line.
The London Travel Demand Survey The London Travel Demand Survey (LTDS) is a London-wide household travel survey updated on a rolling basis over time. This sur-vey, along with census data and other sources, underpins an area-wide transportation planning model (also called LTDS). One output of that model is an estimate of pub-lic transport travel in London on a zone-to-zone basis (zones in this case are traffic analysis zones, rather than fare zones).
Railplan Regional Public Transport Model The LTDS estimates of public transport travel become inputs into the RailPlan regional public transport assignment model.