Bidirectional switch of the valence associated
with a hippocampal contextual memory engram
The MIT Faculty has made this article openly available.
Please share
how this access benefits you. Your story matters.
Citation
Redondo, Roger L., Joshua Kim, Autumn L. Arons, Steve Ramirez,
Xu Liu, and Susumu Tonegawa. “Bidirectional Switch of the Valence
Associated with a Hippocampal Contextual Memory Engram.”
Nature 513, no. 7518 (August 27, 2014): 426–430.
As Published
http://dx.doi.org/10.1038/nature13725
Publisher
Nature Publishing Group
Version
Author's final manuscript
Citable link
http://hdl.handle.net/1721.1/96823
Terms of Use
Creative Commons Attribution-Noncommercial-Share Alike
Bidirectional switch of the valence associated with a
hippocampal contextual memory engram
Roger L Redondo1,2,*, Joshua Kim1,*, Autumn L Arons1,2, Steve Ramirez1, Xu Liu1,2, and
Susumu Tonegawa1,2,**
1RIKEN-MIT Center for Neural Circuit Genetics at the Picower Institute for Learning and Memory,
Department of Biology and Department of Brain and Cognitive Sciences, Massachusetts Institute of Technology, Cambridge, MA 02139, U.S.A.
2Howard Hughes Medical Institute, Massachusetts Institute of Technology, Cambridge, MA
02139, U.S.A.
Abstract
The valence of memories is malleable because of their intrinsic reconstructive property1. This property of memory has been used clinically to treat maladaptive behaviours2. However, the neuronal mechanisms and brain circuits that enable the switching of the valence of memories remain largely unknown. Here, we investigated these mechanisms by applying the recently developed memory engram cell-labelling and -manipulation technique 3,4. We labelled, with Channelrhodopsin-2 (ChR2), a population of cells in either the dorsal dentate gyrus (DG) of the hippocampus or the basolateral complex of the amygdala (BLA) that were specifically activated during contextual fear or reward conditioning. Both groups of fear-conditioned mice displayed aversive light-dependent responses in an optogenetic place avoidance test, whereas both DG- and BLA-labelled mice that underwent reward conditioning exhibited an appetitive response in an optogenetic place preference test. Next, in an attempt to reverse the valence of memory within a subject, mice whose DG or BLA engram had initially been labelled by contextual fear or reward conditioning were subjected to a second conditioning of the opposite valence while their original DG or BLA engram was reactivated by blue light. Subsequent optogenetic place avoidance and preference tests revealed that while the DG-engram group displayed a response indicating a switch of the memory valence, the BLA-engram group did not. This switch was also evident at the cellular level by a change in functional connectivity between DG engram-bearing cells and BLA engram-bearing cells. Thus, we found that in the DG, the neurons carrying the memory engram of a given neutral context have plasticity such that the valence of a conditioned response evoked by their reactivation can be reversed by re-associating this contextual memory engram with a new US
**To whom correspondence should be addressed: tonegawa@mit.edu.
*These authors contributed equally to this work.
Author Contributions R.L.R., J.K., and S.T. contributed to the study design. R.L.R., J.K., S.R., contributed to the data collection.
X.L. cloned all constructs. R.L.R., J.K., A.L.A. conducted the surgeries. R.L.R., J.K. conducted the behavior experiments. R.L.R. conducted the functional connectivity experiments. J.K. conducted the reversal experiments. R.L.R. contributed to the setup of the behavioral and optogenetic apparatus and programmed the behavioral software to run the experiments. R.L.R., J.K., and S.T. wrote the
NIH Public Access
Author Manuscript
Nature. Author manuscript; available in PMC 2015 March 18.
Published in final edited form as:
Nature. 2014 September 18; 513(7518): 426–430. doi:10.1038/nature13725.
NIH-PA Author Manuscript
NIH-PA Author Manuscript
of an opposite valence. Our present work provides new insight into the functional neural circuit underlying the malleability of emotional memory.
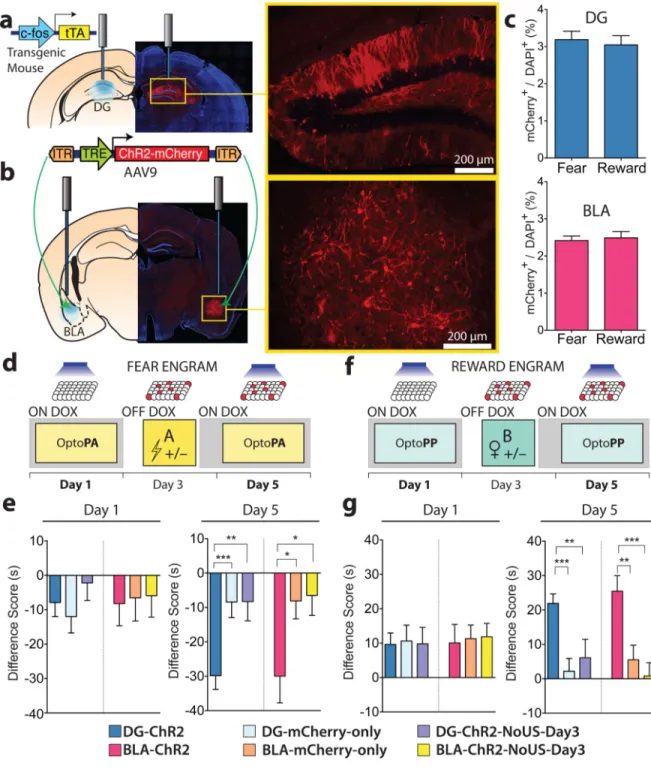
While the amygdala can encode both negative and positive valence5–10, the DG encodes contextual information3,11,12, and it is unknown whether the DG drives expression of memories irrespective of the valence of the US. Therefore, we investigated the roles of DG and BLA engrams in determining the valence of contextual memories and its possible switch. We targeted engram-bearing cells by infecting DG and BLA neurons of c-fos-tTA male mice with AAV9 virus expressing, under the TRE promoter, ChR2 and mCherry fusion protein ChR2 and BLA-ChR2 mice, respectively) or mCherry-only (DG-mCherry-only and BLA-(DG-mCherry-only mice, respectively) (Fig. 1a, b, Methods). This method restricts the expression of ChR2 to neurons in which the immediate early gene (IEG)
c-fos is activated during the encoding of a memory in the absence of the antibiotic
doxycycline (Dox) in the diet3,13. A similar proportion of neurons expressed ChR2 after encoding a fear memory (footshock) or a reward memory (interaction with a female mouse in the home cage) (Fig. 1c). To test the capability of the ChR2-labelled neurons to drive an aversive or appetitive response, we developed two real-time optogenetic place memory tests: the Optogenetic Place Avoidance (OptoPA) test for assessing aversive behaviour and Optogenetic Place Preference (OptoPP) test for assessing appetitive behaviour (see Methods and the characterization of these tests in Extended Fig. 1).
On day 1 of the protocol, the mice underwent a habituation session while on Dox in the OptoPA or OptoPP test (Fig. 1d, f). During habituation, light activation had similar effects on both the ChR2-expressing mice and the mCherry-only controls (Fig. 1e, g) and was not sufficient to produce a change in preference (Extended Fig. 2). On day 3, off Dox, mice habituated to the OptoPA test were fear conditioned in Context A (fear memory group) while the mice habituated to the OptoPP test were reward conditioned, by spending 2 hours in Context B with one female mouse (reward memory group). As a negative control, groups of DG-ChR2 or BLA-ChR2 mice did not receive the US (footshock in Context A or female exposure in Context B) on day 3 (DG-ChR2-NoUS-Day3 or BLA-ChR2-NoUS-Day3 mice). At the end of day 3, all animals were returned to a Dox diet, closing the time-window for labelling for the remainder of the experiment. On day 5, both DG-ChR2 and BLA-ChR2 mice of the fear memory group exhibited greater aversive responses in the OptoPA test than the corresponding mCherry-only and ChR2-NoUS-Day3 mice (Fig. 1e). Both DG-ChR2 and BLA-ChR2 mice of the reward memory group showed greater appetitive response than corresponding mCherry-only mice (Fig. 1g), DG-ChR2-NoUS-Day3 mice, or BLA-ChR2-NoUS-Day3 mice in the OptoPP test (Fig. 1g). Therefore, the US is necessary on day 3 for the engram neurons to drive the appropriate response on day 5 tests.
To investigate whether the valence of the memory associated with the DG or BLA engram can be reversed, we conducted within-subject longitudinal experiments. For this purpose, both the fear and reward memory groups were returned to a Dox diet immediately after day 3 conditioning, preventing the expression of ChR2 by other neurons that may upregulate
c-fos promoter-driven ChR2 after day 3. In a ‘Fear-to-Reward’ experiment (Fig. 2a, b), the
fear memory group was subjected to an OptoPA test on day 5, and as expected, DG-ChR2
NIH-PA Author Manuscript
NIH-PA Author Manuscript
and BLA-ChR2 mice exhibited aversive responses that were greater than DG-mCherry-only mice and BLA-mCherry-only mice, respectively (Fig. 2b). On day 7, these mice received light stimulation while interacting with 2 female mice in their home cage. This procedure on day 7 is hereafter referred to as “induction”. Another batch of DG-ChR2 mice received light stimulation but no female mice (DG-ChR2-NoUS-Day7 mice). On day 9, the OptoPP test was used in the Fear-to-Reward experiment to test whether the neurons activated by the light stimulation during the induction procedure could now drive an appetitive response. The DG-ChR2 mice showed a greater appetitive response than the DG-mCherry-only or DG- DG-ChR2-NoUS-Day7 mice (Fig. 2b). Light reactivation of the original fear memory engram-bearing cells labelled in the BLA (BLA-ChR2 mice) also failed to exhibit an appetitive response in the day 9 OptoPP test. The DG-ChR2 mice displayed lower aversive responses on day 9 than the day 5 test while the DG-ChR2-NoUS-Day7 mice and the BLA-ChR2 mice showed similar aversive responses on day 5 and day 9 (Fig. 2c), indicating that the DG-ChR2 mice not only acquired reward memory by the induction procedure but also lost much of the fear memory acquired previously. In contrast, BLA-ChR2 mice neither acquired a reward memory nor lost the fear memory.
In the Reward-to-Fear experiment (Fig. 2d, e), DG-ChR2 and BLA-ChR2 mice as well as the DG-ChR2-NoUS-Day7 mice displayed greater appetitive responses in the OptoPP test on day 5 than corresponding mCherry-only mice (Fig. 2e). On day 7, these mice received light stimulation either while being subjected to fear conditioning in Context A (DG-ChR2 and BLA-ChR2 mice) or while exploring Context A without footshocks (DG-ChR2-NoUS-Day7 mice). DG-ChR2 mice, but not DG-ChR2-NoUS-(DG-ChR2-NoUS-Day7 mice displayed a greater aversive response in the day 9 OptoPP test than DG-mCherry-only mice (Fig. 2e). Among several groups of mice, only in the DG-ChR2 mice the same neuronal ensemble whose reactivation led to an appetitive response during the OptoPP test on day 5 produced an aversive response on day 9. For the Reward-to-Fear experiment, we introduced another protocol for DG-ChR2 and BLA-ChR2 mice consisting of OptoPP tests on day 5 and day 9. The DG-ChR2 mice displayed lower appetitive responses on day 9 than the day 5 OptoPP test while the DG-ChR2-NoUS-Day7 mice and the BLA-ChR2 mice showed similar appetitive responses on day 5 and day 9 (Fig. 2f), mirroring the results obtained by the Fear-to-Reward experiment described above (Fig. 2c).
We next investigated the effect of our manipulations at the cellular level (Fig. 3a, b; see Methods for the details of the experimental design). The proportions of cells (mCherry+/ DAPI+) (Fig. 3c, d) labelled on day 1 as well as the proportion of cells activated on day 5 (GFP+/DAPI+)(Fig. 3e, f) were similar across experimental groups in both the DG and BLA. The proportion of DG engram cells labelled on day 1 that were light-reactivated on day 5 (GFP+mCherry+/mCherry+) was similar in all groups (Fig. 3g) and above chance (Fig. 3h). In the Light−,US+ and the Light+,US− groups, the proportion of BLA engram cells labelled on day 1 that were reactivated on day 5 (GFP+mCherry+/mCherry+) by artificial reactivation of DG engram cells were similar (Fig. 3i, k) and significantly greater than chance (Fig. 3j). In the Light+,US+ group, this proportion, though greater than chance overlap (Fig. 3j), was significantly lower compared to the Light−,US+ and the Light+,US− groups (Fig. 3i, k). This suggests that the induction procedure decreased the ability of the DG engram to activate the BLA engram, indicating a change in their functional connectivity14,15.
NIH-PA Author Manuscript
NIH-PA Author Manuscript
Using the Reward-to-Fear scheme, we next investigated the effect of the light reactivation of a previously labelled (i.e. day 3) reward memory engram on subsequent encoding of a fear memory (i.e. day 7) and whether this procedure affects the recall of the fear memory by natural cues (day 11) (Fig. 4a). On day 7, during induction, DG-ChR2 and BLA-ChR2 mice displayed significantly lower freezing than DG-mCherry-only and BLA-mCherry-only mice, respectively. In addition, DG-ChR2 and BLA-ChR2 mice displayed significantly lower freezing compared to DG-ChR2-NoUS-Day3 and BLA-Ch2-NoUS-Day3 mice, respectively on day 7 and day 11 (Fig. 4b), indicating that the reduced encoding and recall of the fear memory in DG-ChR2 and BLA-ChR2 depends on the rewarding experience on day 3. Finally, we studied the integrity of the originally acquired memory after the induction of a memory of the opposite valence. For this purpose, in the Fear-to-Reward scheme, we investigated the effect of the reward memory induction on day 7 on the original fear memory by testing the freezing response to the original context on day 11 (Fig. 4c). DG-ChR2 mice, but not DG-mCherry-only and DG-ChR2-NoUS-Day7 mice, showed a significant reduction in their freezing response even though these mice were never re-exposed to the original context between encoding of the original fear memory on day 3 and testing on day 11 (Fig. 4d). In contrast, BLA-ChR2, but not BLA-mCherry-only mice, showed elevated freezing during the day 11 test session compared to the encoding session on day 3, consistent with earlier observations that BLA engram reactivation leads to the sensitization of fear responses16,17.
During the Context A test on day 11, DG-ChR2 mice spent more time sniffing18,19 (corrected for freezing periods) (see Methods) than any other groups of mice (Fig. 4e), suggesting that our reward memory induction procedure increased the positive memory valence associated with the test context (i.e. Context A) on day 11.
Here, we have shown that both the DG and BLA neurons activated during context-specific fear or reward conditioning can drive aversive and appetitive responses, respectively upon optogenetic reactivation of these cells two days after training. This confirms our previous finding that these neurons have undergone enduring changes as a consequence of memory training, validating their engram-bearing nature. We have also shown that artificially reactivating contextual fear-labelled neurons in the DG, but not in the BLA, during a subsequent reward conditioning was sufficient to reverse the dominant valence associated with the memory. Reciprocally, artificially reactivating contextual reward-labelled neurons in the DG, but not in the BLA, during a subsequent contextual fear conditioning was sufficient to reverse the dominant valence associated with the original memory (Fig. 2). We conclude that the valence associated with the hippocampal memory engram is
bi-directionally reversible. In contrast, the inability of the BLA engram to reverse the valence of the memory suggests that individual BLA cells are hardwired to drive either fear or reward memories rather than both.
The reversal of the dominant valence associated with the DG memory engram was also demonstrated at the cellular level. The hippocampal output has been shown to be sufficient to induce synaptic plasticity in the amygdala20, and post-training inactivation of the dorsal hippocampus prevents context-dependent neuronal activity in the amygdala21. In addition, studies have shown that the BLA can drive both aversive22 and appetitive23 responses. We
NIH-PA Author Manuscript
NIH-PA Author Manuscript
thus predicted that driving the DG engram associated with a particular valence would result in firing of the corresponding BLA engram-bearing cells active during encoding—a hypothesis that was supported by the data in Fig. 3 (Light−, US+). We hypothesized that optogenetic reactivation of the DG engram-bearing cells during the presentation of a US with a valence opposite to the original one would strengthen the connectivity, albeit indirectly, of these DG cells with a new subset of BLA neurons while weakening the connections established during the original learning. This hypothesis is supported by the finding that the overlap of BLA neurons activated by stimulation of the DG engram-bearing cells was reduced after induction compared to the overlap observed in no induction controls (Fig. 3i, k). The observation that the levels of c-fos activation were similar across groups suggests that a new population of BLA neurons was functionally recruited in the Light+US+
group.
By applying optogenetic manipulations to two interacting brain areas, our study provides a new type of neural circuit analysis that elucidates functional relationships between brain areas with respect to the expression of memories. Previously, others have shown that neurons that artificially upregulate CREB24 and express TRPV116 in the BLA can be
associated with fear. Also, randomly labelled populations of neurons in the piriform cortex can drive opposing behaviours after their stimulation is paired with a US of positive or negative valence25. Here, because our engram labelling technology allows for the targeting
of neurons that were activated during natural memory encoding to express ChR2, we were able to label a specific memory trace and monitor the behavioural response elicited by natural cues (Fig. 4a, b). Our present study provides a new insight into the functional neural circuit underlying the malleability of emotional memory by highlighting the importance of the plasticity in the hippocampal-amygdala connections.
Methods
SubjectsThe c-fos-tTA mice were generated from the TetTag mice (Jackson Labs stock # 008344) bred with C57BL/6J mice13. c-fos-tTA mice carry the c-fos-tTA transgene in addition to a transgene consisting of a c-fos promoter driving the expression of nuclear-localized EGFP. Mice were socially housed from the time of weaning until surgery and raised on a 40mg/kg doxycycline (Dox) diet. Male mice 5–10 weeks old underwent stereotaxic surgery and were subsequently single-housed. All procedures relating to mouse care and treatment were carried out in abidance to protocols and guidelines approved by the Massachusetts Institute of Technology (MIT) Committee on Animal Care (CAC) and National Institutes of Health (NIH) guidelines.
Viral Constructs
The pAAV-TRE-ChR2-mCherry and pAAV-TRE-mCherry plasmid was constructed as previously described4. AAV9 viruses containing these constructs were packaged by the
Gene Therapy Center and Vector Core at the University of Massachusetts Medical School. Viral titers of 8 × 10¹² GC/ml for AAV9-TRE-ChR2-mCherry and 1.4 × 10¹³ GC/ml for
AAV9-TRE-mCherry were used in viral injections as previously reported4.
NIH-PA Author Manuscript
NIH-PA Author Manuscript
Surgical Procedures
Mice underwent surgical procedures anaesthetized under isoflourane. Under stereotaxic guidance, virus was injected using a glass micropipette attached to a 1 µl Hamilton microsyringe (701LT; Hamilton) through a microelectrode holder (MPH6S; WPI) filled with mineral oil. Once the target site was reached, the needle was held in place for 5 minutes prior to the injection of 200 nl of virus at a rate of 70 nl/min. After the full titer of virus was injected, the needle was held in place for an additional 5 minutes prior to withdrawal. Dentate gyrus stereotaxic coordinates were –2.0 mm anteroposterior (AP), ±1.3 mm mediolateral (ML), –2.0 mm dorsoventral (DV), and basolateral amygdala coordinates –1.4 mm AP, ±3.2 mm ML, –4.8 mm DV26. After withdrawal of the needle, a Doric patchcord optical fibre (Doric Lenses) was lowered 0.15 mm above the site of injection. For implants targeting the Dentate Gyrus of the hippocampus, Doric implants
TFC_200/240-0.22_2.4mm_TF2.6_FLT were used. For implants targeting the BLA, Doric implants MFC_200/240-0.22_5.5mm_Z1.25_FLT were used. A screw was placed into the skull anterior to the site of injection. A layer of adhesive cement (C&B Metabond) was applied around the optical fibre. Once the adhesive cement cured, a protect cap, made from a 1.5 ml black Eppendorf tube, was placed around the adhesive cement. The cap was secured to the optical fibre implant by dental cement (Teets cold cure; A-M Systems). Mice were given 1.5 mg/kg Metacam as analgesic and remained on a heating pad until recovery from anaesthesia. Mice were allowed to recover for at least 1 week before all subsequent
experiments. Viral injection sites were verified at the end of the experiments (Extended Fig. 3). Twenty-two out of 319 animals were excluded due to low expression in the target areas. Engram Labelling
Prior to conditioning, subjects were given food without Doxycycline for 2 days. During fear conditioning, subjects were placed in a shock chamber (30 × 35 × 32 cm) scented with 0.25% benzaldehyde in 70% ethanol for 500 s. (Ctx A). Foot shocks (0.75 mA, 2 s duration) were administered at the198 s, 278 s, 358 s, and 438 s time points. For reward conditioning, each subject was exposed to a single female mouse for 2 h in their home cage in a room separate from the housing room (Ctx B). Immediately after, in both fear and reward conditioning, subjects returned to a Dox (40 mg/kg) diet.
Optogenetic Induction
In optogenetic fear induction, subjects were placed in a shock chamber (30 × 35 × 32 cm) scented with 0.25% benzaldehyde in 70% ethanol with light stimulation (20 Hz, 15 ms) for 500 s (Ctx A). Foot shocks (0.75 mA, 2 s duration) were administered at the 198 s, 278 s, 358 s, and 438 s time points. During optogenetic reward induction, in a separate room from the housing room, home cages were placed inside of a 4-sided (31 × 25 × 30 cm) box and cage tops were removed (Ctx B). Light stimulation (20 Hz, 15 ms pulses) was applied while exposing each subject to two female mice for 12 min.
Optogenetic Conditioned Place Aversion (OptoPA) and Preference (OptoPP) Tests The testing chamber consisted of a custom-built rectangular box (70 × 25 × 30 cm) with white floors and distinct wall cues placed on each end of the chamber. A video camera
NIH-PA Author Manuscript
NIH-PA Author Manuscript
resides above the testing chamber where the locations of the subjects were tracked and recorded using Noldus EthoVision XT video tracking software. Two zones on either end of the box A (30 × 30 cm) as well as a neutral zone in the center of the box (10 cm) were denoted as part of the Arena settings. In the OptoCPA and OptoCPP tests, subjects freely explored the testing chamber for 12 minutes. A baseline (BSL) phase lasting 3 min was followed by an ON phase (3 min), an OFF phase (3 min) and another ON phase (3 min). The target zone of light stimulation was determined by the zone of greater preference during the 0–3 min baseline (BSL) epoch in the OptoPA test and the least preferred side for the OptoPP test. Only during the ON phases, when the mouse entered the target zone, a TTL signal from the EthoVision software via a Noldus USB-IO Box triggered a stimulus generator
(STG-4008, Multichannel Systems). The signal from the stimulus generator drove the lasers (OptoEngine) to produce light (473 nm) in 15 ms pulses delivered at 20 Hz. Laser output was tested at the beginning of every experiment to ensure that at least 10 mW of power was delivered at the end of the optic fibre pathcord (Doric lenses).
As criteria for inclusion in the behavioural studies, during the BSL phases (0 – 3 min) mice that spent more than 90% of the time in one single zone were excluded. 6 out of 376 subjects were excluded from the study. Additionally, mice that spent 100% of the time in one zone in any 3 min phase of the test were also excluded 8 out of 376 subjects.
To characterize the responses to unconditioned stimuli in our setup and protocols, a series of experiments were conducted with wild type mice. In the shock place avoidance test, mice were allowed to freely explore the testing chamber (70 × 25 × 30 cm) during the 0–3 min BSL epoch, the target zone was determined. During the 3–6 min and 9–12 min epochs (ON phases), foot shocks (0.15 mA, 2 s duration every 5 s) were administered when the mice entered the target zone and every 5 seconds for as long as they remained in the target zone (WT-Shock mice) or no foot shocks were administered (WT-No-Shock mice). (Extended Fig. 1a,b). In the Female place preference test, mice were allowed to freely explore the testing chamber during the 0–3 min BSL epoch, the target zone was determined. During the 3–6 min and 9–12 min epoch (ON phases), a corral (upside-down pencil holder) containing a female was placed in the target zone while an empty corral was placed in the opposite side of the apparatus (WT-Female mice) or two empty corrals were place on both ends of the apparatus (WT-No Female mice) (Extended Fig. 1e,f).
As often seen in biased protocols27, ceiling effects prevent preference from being detected in avoidance tests (OptoPA) and floor effects prevent avoidance performance in preference tests (OptoPP). OptoPA and OptoPP could only detect avoidance or preference,
respectively, or their absence.
From test to test, in between days, mice chose a preferred side independently of their performance on previous days (Extended Table 1).
Daily Behavioural Protocols (Figures 1, 2 and 4)
Fear to Reward and Reward to Fear Experiments. Subjects underwent behavioural testing at least 1 week post-surgery. Experimental group (i.e. ChR2, mCherry-only, ChR2-NoUS) was pseudo-randomly assigned and mice grouped into cohorts (n of 8 to 12) with surgery-type
NIH-PA Author Manuscript
NIH-PA Author Manuscript
determining the group assignment (DG or BLA). Two days prior to the start of testing, animals were handled and habituated to experimenters. Day 1, subjects were habituated to the OptoPA or OptoPP test, then immediately placed off Dox. Day 3, subjects were exposed to a shock (context B) or female (context A), then immediately placed on a Dox diet. Day 5 subjects were tested in the OptoPA or OPP test. For experiments described in Figure 2, on Day 7, subjects underwent optogenetic induction. Day 9, subjects underwent the OptoPP or OptoPA test, the test opposite to that of the initial test on Day 5. For the Fear-to-Reward experiment, we introduced another protocol for DG-ChR2, DG-ChR2-NoUS-Day7 and BLA-ChR2 mice consisting of OptoPA tests on day 5 and also on day 9. For the Reward-to-Fear experiment, we introduced another protocol for DG-ChR2, DG-ChR2-NoUS-Day7 and BLA-ChR2 mice consisting of OptoPP tests on day 5 and also on day 9. For experiments described in Figure 4, on Day 11, subjects of both behavioural paradigms (OptoPA to OptoPP and OptoPP to OptoPA), were re-exposed to the fear conditioning box (context B). DG to BLA functional connectivity experiment (Figure 3)
Animals were injected with TRE-ChR2-mCherry virus in both the BLA and the DG, and implanted with optic fibres only above the DG (Fig. 3a). While off Dox on day 1, mice experienced footshocks or a female, which labelled the active cells in both the DG and the BLA (Fig. 3b). On day 3, while back on Dox, the mice experienced either an event of the opposite valence without engram reactivation (Light−,US+), induction (Light+,US+), or received optogenetic stimulation but no US delivery (Light+,US−). On day 5, all the mice were placed in novel context (Context C) and light was delivered for 12 minutes. Ninety minutes later, the mice were perfused and brain sections were collected for
immunohistochemistry against mCherry to visualize the engram-bearing cells labelled on day 1 and against GFP derived from a c-fos-shGFP transgene3, which we use as a surrogate for endogenous c-fos to reveal cells that have been active recently4. At least one week after surgery, animals were randomly assigned to 3 groups according to the manipulation carried out on day 3: Light–US+, Light+US+, and Light+US–. On day 1, cells were labelled as explained above (engram labelling). On day 3, the Light+US+ group experienced induction protocols as those explained above (Optogenetic induction). Light–US+ mice went through induction protocols without light stimulation. The power supply for the lasers were on to produce noise at the same level as the Light+US+ group, but the light delivery from the laser was switched off. Light+US– mice received light stimulation while running induction protocols that did not include the presence of females or the delivery of foot shocks. On day 5, all mice were placed in a third, new neutral context (Ctx C) and received light (20 Hz, 15 ms pulse width, 473 nm, 10–25 mW) into the DG for 12 minutes. Ninety minutes later, their brains were perfused and extracted for immunohistochemical analysis.
Immunohistochemistry
Mice were euthanised by Avertin overdose and perfused with 4% paraformaldehyde. Brains were removed and placed in 4% paraformaldehyde for 24 h then stored in PBS at 4°C prior to sectioning. 50 µm coronal sections were obtained using a vibratome and stored at −20°C. At the time of staining, sections underwent three 10-minute PBS-T (PBS+ 0.2% Triton X-100) washes then incubated in blocking buffer (5% normal goat serum) for 1 h. Primary antibodies were applied overnight at 4°C: chicken anti-GFP from Invitrogen A10262
NIH-PA Author Manuscript
NIH-PA Author Manuscript
(1:1000 dilution) and rabbit anti-RFP from Rockland Immunochemicals
600-401-379(1:2000 dilution). Sections underwent three 10-minute washes in PBS-T then were incubated with secondary antibody solution (goat anti-chicken conjugated with Alexa Fluor 488 Invitrogen A11039 (1:200 dilution) and goat anti-rabbit conjugated with Alexa Fluor 568 Invitrogen A11011 (1:500 dilution)) for 2 hours. Sections underwent another three 10 minute washes prior to coverslip mounting using VECTASHIELD with DAPI.
Imaging and Cell Counting
Images for cell counting were captured with VS-120 (Olympus) at 20 × and imported into cellSens Dimension software (Olympus). A region of interest (ROI) was defined manually following anatomical landmarks. Neurons stained against mCherry (red) as well as those with an overlap in red and green signal were counted manually. Cells stained against GFP (green) and DAPI (blue) were counted automatically by the cellSens software after manual adjustment of detection thresholds.
All counting was performed blind as to the group and condition that the specimen belonged to. For BLA DAPI counts, thresholds were set up so as to only count large DAPI nuclei to exclude non-neuronal small nuclei as described previously13.
For Figure 3 h, j, chance overlap is calculated as mCherry+ / DAPI × GFP+ / DAPI. Overlaps over chance were calculated as GFP+ mCherry+ / DAPI divided by Chance overlap.
The representative overlap images presented in Figure 3 were obtained in a confocal microscope (Zeiss AxioImager M2).
Behavioural Scoring
In the OptoPA and OptoPP tests, automated tracking by Noldus EthoVision was used to track the position of the mice. Raw data was extracted and analysed with Microsoft Excel and GraphPad Prism version 6.00 for Mac OS X, GraphPad Software, La Jolla California USA. The Difference Scores (DS) reported in the main figures were obtained by subtracting the time spent in the target zone during the BSL phase from the average time spent in the target zone during the two ON phases. Negative DS denote that the preference for the target zone during ON phases is lower than the preference during the BSL phase while positive DS denote that the preference for the target zone during ON phases is higher than the preference during the BSL phase.
In the Reward-to-Fear experiment, during the optogenetic induction protocol, where the optic fibre interfered with automated scoring, blinded manual scoring was used to score freezing levels. In the Fear-to-Reward experiment, freezing scores were assessed via the automated scoring on using the Med Associates Inc. Video Fear Conditioning software. Sniffing scores28 were also assessed blindly through manual scoring using JWatcher (c). Statistical analysis
GraphPad Prism version 6.00 for Mac OS X, GraphPad Software, La Jolla California USA was used for statistical analysis. Statistical significance was assessed by two-tailed unpaired
NIH-PA Author Manuscript
NIH-PA Author Manuscript
Student’s t-tests, one-way ANOVA, or two-way repeated-measures ANOVA where appropriate. Significant main effects or interactions were followed up with multiple comparison testing with the use of Holm–Sidak’s correction where specified in the legends. Significance levels were set to P = 0.05. Significance for multiple comparisons: * P < 0.05; ** P < 0.01; *** P < 0.001. Sample sizes were chosen on the basis of previous studies. Data met assumptions of statistical tests, and variance was similar between groups for all metrics measured except for one difference score comparison (Fig 2b BLA OptoPA to OptoPP), freezing data (Fig 4b day 5), and sniffing data (Fig. 4e) (Brown-Forsythe test).
NIH-PA Author Manuscript
NIH-PA Author Manuscript
Extended Data
Extended Figure 1. Light-induced avoidance and preference tests
a–b, Shock Place Avoidance test. a, After the 0–3min Baseline (BSL), the most preferred zone was established as the target zone. WT-Shock mice (n = 11) received foot shocks (0.15 mA DC, 2s duration every 5s) when entering the target zone during the ON phases (3–6 and 9–12 min). No shocks were delivered during the OFF phase (6–9 min). WT-No-Shock mice (n = 24) received no shocks. b, The difference score was lower in the WT-Shock mice
NIH-PA Author Manuscript
NIH-PA Author Manuscript
compared to WT-No-Shock (t41 = 3.76, P < 0.001). c–d, Optogenetic Place Avoidance
(OptoPA) test. c, Mice were allowed to explore the arena during BSL and the preferred side determined as the target zone. Light stimulation (20 Hz, 15 ms pulse width, 473 nm, >10 mW) was applied when the mice entered the target zone during the ON phases. Light stimulation was not delivered during the OFF phase. d, The difference score was lower in the DG-ChR2 mice (n = 48) compared to DG-mCherry-only mice (n = 39) (t85 = 3.55, P <
0.001). e–f, Female Place Preference test. e, After the 0–3min baseline (BSL), the less preferred zone was established as the target zone. During the ON phases (3–6 and 9–12 min), a corral containing a female was placed in the less preferred zone (target zone) and an empty corral was placed on the opposite side. Corrals, and the female, were removed during the OFF phase. f, Mice (n = 24) increased the time spent in the target zone compared to mice presented with two empty receptacles (n = 8) (t30 = 2.81, P < 0.01). g–h, Optogenetic Place
Preference (OptoPP) test. g, Reward-labelled mice were allowed to explore the arena during BSL and the less preferred zone designated as the target zone. Light stimulation (20 Hz, 15 ms pulse width, 473 nm, >10 mW) was applied while the subject was in the target zone of the chamber at the 3–6 min and 9–12 min epochs (ON phase). h, , The difference score was increased in the DG-ChR2 mice (n = 54) compared to DG-mCherry-only mice (n = 31) (t88
= 4.361, P < 0.001). a,c,e,g (right panel), Representative tracks for experimental animals. Dots mark the position of the animal every 5 video frames and accumulate where the mice spend more time.
NIH-PA Author Manuscript
NIH-PA Author Manuscript
Extended Figure 2. Light stimulation in the OptoPA and OptoPP Tests has no effect during habituation
a, Day 1 OptoPA Habituation. There are no within group differences in the average duration spent in the target zone during the average of the BSL and OFF phases (OFF) and the averages of the two light on phases (ON) during day 1 habituation in the OptoPA test, even though there is an overall difference between the two types of phases (F1,173 = 6.46, P <
0.05, 6 n.s. multiple comparisons. DG-ChR2 n = 48, DG-mCherry-only n = 39, DG-ChR2-NoUS-Day3 n = 17, BLA-ChR2 n = 32, BLA-mCherry-only n = 27, BLA-ChR2-NoUS-Day3 n = 27). b, Day 1 OptoPP Habituation. There are no within group differences in the average time duration spent in the target zone during the average of the BSL and OFF phases (OFF) and the average of the two light on phases (ON) during day 1 habituation in the OptoPP test, even though there is an overall difference between the two types of phases (F1,195 = 8.06, P < 0.01, 6 n.s. multiple comparisons. DG-ChR2 n = 54, DG-mCherry-only n = 36, DG-ChR2-NoUS-Day3 n = 24, ChR2 n = 35, mCherry-only n = 31, BLA-ChR2-NoUS-Day3 n = 21). c–d, There are no differences between experimental groups and wild type mice tested without light stimulation c, In the OptoPA test, the difference scores (ON-OFF) are similar between experimental groups (same as panel a) and wild type mice (n
NIH-PA Author Manuscript
NIH-PA Author Manuscript
= 33) that did not receive light stimulation (F6,205 = 0.19, n.s.). d, In the OptoPP test, the
difference scores (ON-OFF) are similar between experimental groups (same as panel b) and wild type mice (n = 33) that did not receive light stimulation (F6,227 = 0.21, n.s.).
Extended Figure 3. Fibre positions in DG and BLA
a, Representative example of the fibre location and the expression of the ChR2-mCherry construct in the DG. b, Representative example of the fibre location and the expression of the ChR2-mCherry construct in the BLA.
Extended Table 1
Mice chose a preferred side on day 9 irrespective of their choice of preferred side on day 5 in both Fear-to-Reward and Reward-to-Fear experiments. To determine whether mice switched (Switch) or not (No Switch) their preferred side between tests, the preferred side during the BSL phase on Day 5 tests was compared to the preferred side during the BSL phase on Day 9 tests. Across groups, there is no difference between animals that switched sides between day 5 and 9 and those that did not across groups (χ29 = 3.74, n.s.).
Fear-to-Reward Switch No Switch Total
20 13 33
11 16 27
21 16 37
23 21 44
15 12 27
Reward-to-Fear Switch No Switch Total
29 24 53
NIH-PA Author Manuscript
NIH-PA Author Manuscript
Fear-to-Reward Switch No Switch Total 23 23 46 13 14 27 27 28 55 13 15 28
Acknowledgments
We thank X. Zhou, C. Potter, D. Plana, J. Martin, M. Tsitsiklis, H. Sullivan, W. Yu, and A. Moffa for help with the experiments, K.L. Mulroy, T. Ryan and D. Roy for comments and discussions on the manuscript, and all the members of the Tonegawa lab for their support. This work is supported by NIH grants R01-MH078821, P50-MH58880 to S.T., the NIH Pre-Doctoral Training Grant T32GM007287 to J.K., and the RIKEN Brain Science Institute, the Howard Hughes Medical Institute, and The JPB Foundation.
REFERENCES
1. Pavlov, IP. Conditioned Reflexes: An Investigation of the Physiological Activity of the Cerebral Cortex. Oxford University Press; 1927.
2. Wolpe, J. Psychotherapy by reciprocal inhibition. Stanford University Press; 1958.
3. Liu X, et al. Optogenetic stimulation of a hippocampal engram activates fear memory recall. Nature. 2012; 484:381–385. [PubMed: 22441246]
4. Ramirez S, et al. Creating a false memory in the hippocampus. Science. 2013; 341:387–391. [PubMed: 23888038]
5. Muramoto K, Ono T, Nishijo H, Fukuda M. Rat amygdaloid neuron responses during auditory discrimination. Neuroscience. 1993; 52:621–636. [PubMed: 8450963]
6. Schoenbaum G, Chiba AA, Gallagher M. Neural encoding in orbitofrontal cortex and basolateral amygdala during olfactory discrimination learning. J Neurosci. 1999; 19:1876–1884. [PubMed: 10024371]
7. Paton JJ, Belova MA, Morrison SE, Salzman CD. The primate amygdala represents the positive and negative value of visual stimuli during learning. Nature. 2006; 439:865–870. [PubMed: 16482160] 8. Shabel SJ, Janak PH. Substantial similarity in amygdala neuronal activity during conditioned
appetitive and aversive emotional arousal. Proc Natl Acad Sci U S A. 2009; 106:15031–15036. [PubMed: 19706473]
9. Amano T, Duvarci S, Popa D, Pare D. The fear circuit revisited: contributions of the basal amygdala nuclei to conditioned fear. J Neurosci. 2011; 31:15481–15489. [PubMed: 22031894]
10. Sangha S, Chadick JZ, Janak PH. Safety encoding in the basal amygdala. J Neurosci. 2013; 33:3744–3751. [PubMed: 23447586]
11. Teyler TJ, DiScenna P. The hippocampal memory indexing theory. Behav Neurosci. 1986; 100:147–154. [PubMed: 3008780]
12. Rudy JW, O'Reilly RC. Contextual fear conditioning, conjunctive representations, pattern completion, and the hippocampus. Behav Neurosci. 1999; 113:867–880. [PubMed: 10571471] 13. Reijmers LG, Perkins BL, Matsuo N, Mayford M. Localization of a stable neural correlate of
associative memory. Science. 2007; 317:1230–1233. [PubMed: 17761885]
14. Schiltz CA, Bremer QZ, Landry CF, Kelley AE. Food-associated cues alter forebrain functional connectivity as assessed with immediate early gene and proenkephalin expression. BMC biology. 2007; 5:16. [PubMed: 17462082]
NIH-PA Author Manuscript
NIH-PA Author Manuscript
15. Wheeler AL, et al. Identification of a functional connectome for long-term fear memory in mice. PLoS Comput Biol. 2013; 9:e1002853. [PubMed: 23300432]
16. Kim J, Kwon JT, Kim HS, Josselyn SA, Han JH. Memory recall and modifications by activating neurons with elevated CREB. Nat Neurosci. 2013
17. Huff ML, Miller RL, Deisseroth K, Moorman DE, LaLumiere RT. Posttraining optogenetic manipulations of basolateral amygdala activity modulate consolidation of inhibitory avoidance memory in rats. Proc Natl Acad Sci U S A. 2013; 110:3597–3602. [PubMed: 23401523]
18. Malkesman O, et al. The female urine sniffing test: a novel approach for assessing reward-seeking behavior in rodents. Biol Psychiatry. 2010; 67:864–871. [PubMed: 20034613]
19. Kiyokawa Y, Hiroshima S, Takeuchi Y, Mori Y. Social buffering reduces male rats' behavioral and corticosterone responses to a conditioned stimulus. Hormones and behavior. 2014; 65:114–118. [PubMed: 24361196]
20. Maren S, Fanselow MS. Synaptic plasticity in the basolateral amygdala induced by hippocampal formation stimulation in vivo. J Neurosci. 1995; 15:7548–7564. [PubMed: 7472506]
21. Maren S, Hobin JA. Hippocampal regulation of context-dependent neuronal activity in the lateral amygdala. Learn Mem. 2007; 14:318–324. [PubMed: 17522021]
22. Herry C, et al. Switching on and off fear by distinct neuronal circuits. Nature. 2008; 454:600–606. [PubMed: 18615015]
23. Stuber GD, et al. Excitatory transmission from the amygdala to nucleus accumbens facilitates reward seeking. Nature. 2011; 475:377–380. [PubMed: 21716290]
24. Han JH, et al. Neuronal competition and selection during memory formation. Science. 2007; 316:457–460. [PubMed: 17446403]
25. Choi, Gloria B., et al. Driving Opposing Behaviors with Ensembles of Piriform Neurons. Cell. 2011; 146:1004–1015. [PubMed: 21925321]
26. Franklin, KBJ.; Paxinos, G. The Mouse Brain in Stereotaxic Coordinates. Elsevier/Academic Press; 2008.
27. Calcagnetti DJ, Schechter MD. Nicotine place preference using the biased method of conditioning. Progress in Neuro-Psychopharmacology and Biological Psychiatry. 1994; 18:925–933. [PubMed: 7972862]
28. Blumstein, DT.; Daniel, JC. Quantifying behavior the JWatcher way. Sinauer Associates; 2007.
NIH-PA Author Manuscript
NIH-PA Author Manuscript
Figure 1. Fear and reward engram reactivation, both in the DG and the BLA, drives place avoidance and place preference, respectively
a, b, c-fos tTA mice were injected with AAV9-TRE-ChR2-mCherry or TRE-mCherry and
implanted with optical fibres bilaterally targeting the DG (a) or the BLA (b). c, Similar engram labelling in the DG (t33 = 0.42, n.s.) and BLA (t26 = 0.35, n.s.) after fear (DG n =
16; BLA n = 14) and reward (DG n = 19; BLA n = 14) conditioning d, Fear memory group experimental protocol. e, On Day 1, Difference Scores (Extended Fig. 1) were similar across all DG subgroups (F2,101 = 0.76, n.s.) and across all BLA subgroups (F2,72 = 0.03, n.s.). On
NIH-PA Author Manuscript
NIH-PA Author Manuscript
day 5, Difference Scores were lower in DG-ChR2 (n = 48) and BLA-ChR2 mice (n = 21) compared to corresponding mCherry-only (DG n = 39; BLA n = 27) and DG- or BLA-ChR2-NoUS-Day3 mice (DG n = 17; BLA n = 27) (DG F2,101 = 7.99, P < 0.001; BLA F2,72
= 4.12, P < 0.05). f, Reward memory group experimental protocol. g, On day 1, Difference Scores were similar across all DG subgroups (F2,111 = 0.02, n.s.) and across all BLA
subgroups (F2,83 = 0.04, n.s.). In the day 5 OptoPP test, Difference Scores were greater in
DG-ChR2 (n = 54) and BLA-ChR2 mice (n = 35) compared to corresponding mCherry-only (DG n = 36; BLA n = 31) and DG- or BLA-ChR2-NoUS-Day3 mice (DG n = 24; BLA n = 21) (DG F2,111 = 9.76, P < 0.001; BLA F2,83 = 9.12, P < 0.001). Results show mean ±
s.e.m.
NIH-PA Author Manuscript
NIH-PA Author Manuscript
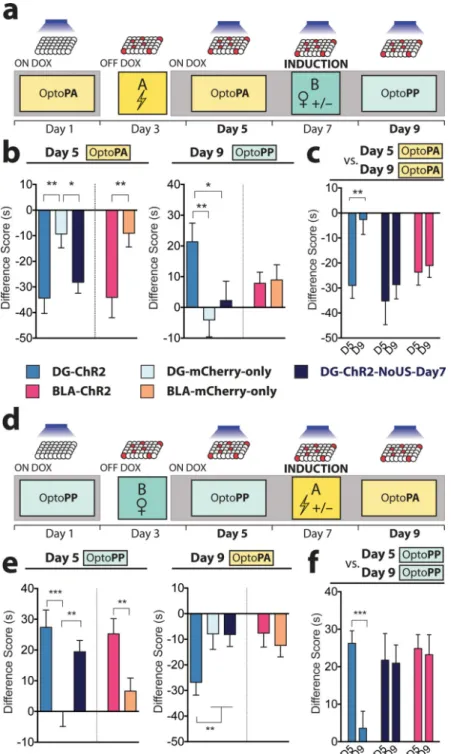
Figure 2. The valence associated with the DG engram is reversed after induction with the US of opposite value
a, The Fear-to-Reward experimental protocol. b, On day 5, Difference Scores of DG-ChR2 (n = 16), DG-ChR2-NoUS-Day7 (n = 20), and BLA-ChR2 mice (n = 19) were lower compared to corresponding mCherry-only mice (DG n = 27; BLA n = 27) (DG F2,59 = 6.16,
P < 0.01; BLA t44 = 2.73, P < 0.01). In the day 9 OptoPP test, Difference Scores of
DG-ChR2 mice were greater than the control mice (F2,60 = 4.4, P < 0.05). Difference Scores of
BLA-ChR2 mice were similar to those of BLA-mCherry-only mice (t44 = 0.16, n.s.). c, On
NIH-PA Author Manuscript
NIH-PA Author Manuscript
day 9 OptoPA test, DG-ChR2 mice (n = 12) showed less aversive response compared to day 5 while both DG-ChR2-NoUS-Day7 (n = 16) and BLA-ChR2 (n = 17) mice showed similar Difference Scores on these days (F1,42 = 5.42, P < 0.05). d, Reward-to-Fear experimental
protocol. e, On day 5 OptoPP test, Difference Scores of DG-ChR2 (n = 17), DG-ChR2-NoUS-Day7 (n = 29), and BLA-ChR2 mice (n =30) were greater compared to corresponding mCherry-only mice (DG n = 27; BLA n = 29) (DG F2,70 = 8.97, P < 0.001; BLA t57 = 2.85,
P < 0.01) On day 9, Difference Scores of DG-ChR2 mice were lower compared to the
control mice (F2,71 = 3.20, P < 0.05) and Difference Scores of BLA-ChR2 mice were
similar to those of BLA-mCherry-only mice (t57 = 0.49, n.s.). f, On day 9 OptoPP test,
DG-ChR2 mice (n =18) showed a reduced appetitive response compared to day 5 OptoPP test while both DG-ChR2-NoUS-Day7 (n = 21) and BLA-ChR2 mice (n = 18) showed similar Difference Scores on day 9 and day 5 (F1,54 = 6.58, P < 0.05). Results show mean ± s.e.m.
NIH-PA Author Manuscript
NIH-PA Author Manuscript
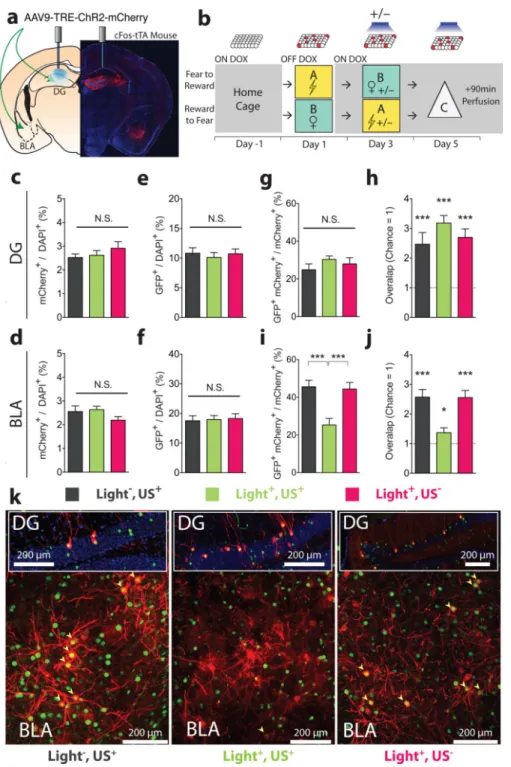
Figure 3. DG to BLA functional connectivity changes after induction
a, Injection sites and the optic fibre placement. b, Experimental protocol. On day 1, cells active during fear or reward experience were labelled. On day 3, on Dox, mice were randomly assigned to 3 groups: reward or fear conditioning without light reactivation (Light−,US+) (n = 11); full induction protocol (Light+,US+) (n = 16); light stimulation but neither reward nor fear conditioning (Light+,US−) (n = 16). On day 5, all animals received light stimulation in the DG for 12 minutes in a novel context (Context C) before brains were subjected to immunohistochemistry. Similar proportions of neurons were labelled by the
NIH-PA Author Manuscript
NIH-PA Author Manuscript
fear or reward conditioning on day 3 in all groups, both in c, DG (F2,40 = 0.77, n.s.) and d,
BLA (F2,40 = 2.40, n.s.). Light delivery to the DG on day 5 led to the activation (GFP+/
DAPI+) of similar proportions of cells in the e, DG (F2,40 = 0.21, n.s.) and f, BLA (F2,40 =
0.06, n.s.). g, Levels of reactivation (GFP+mCherry+/mCherry+) in the DG were similar across all groups (F2,40 = 0.61, n.s.) and h, above levels of chance (one sample t-tests
against chance overlap: –Light,+US t10 = 4.24, P < 0.01; Light+,US+ t15 = 8.56, P < 0.001;
Light+,US− t15 = 5.5, P < 0.001). i, Levels of reactivation (GFP+mCherry+ / mCherry+) in
the BLA were lower in the Light+,US+ compared to Light−,US+ and Light+,US− (F2,40 =
11.82, P < 0.001) even though overlap levels j, remained above chance (one sample t-tests: Light−,US+ t10 = 7.41, P < 0.001; Light+,US+ t15 = 2.33, P < 0.05; Light+,US− t15 = 6.94, P
< 0.001). k, Representative images of double immunofluorescence for GFP (green) and mCherry (red) in the DG and BLA. Results show mean ± s.e.m.
NIH-PA Author Manuscript
NIH-PA Author Manuscript
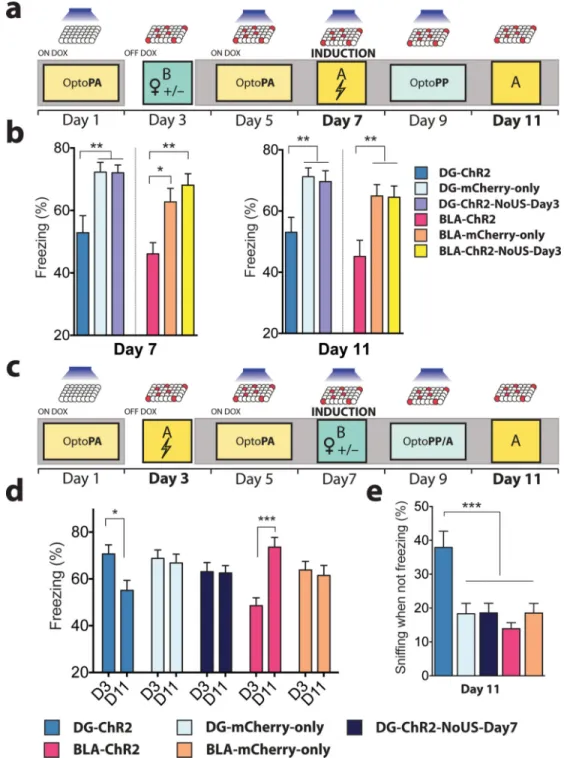
Figure 4. Memory induction alters naturally cued fear memory
a, Reward-to-Fear scheme with Context A fear memory tests on day 7 and day 11. b, On day 7, freezing levels during the last 3 minutes of the induction procedure were reduced in DG-ChR2 (n = 18) and BLA-ChR2 mice (n = 19) compared to corresponding mCherry-only (DG n = 21; BLA n = 20) and ChR2-NoUS-Day3 mice (DG n = 27; BLA n = 24) (DG F2, 63
= 8.768, P < 0.001; BLA F2,60 = 8.49, P < 0.001). These reduced freezing levels remained
on day 11 (DG F2,63 = 6.25, P < 0.01; BLA F2,60 = 6.86, P < 0.01). c, Fear-to-Reward
scheme with Context A fear memory tests on day 3 and day 11. d, Compared to the last
NIH-PA Author Manuscript
NIH-PA Author Manuscript
three minutes of the fear conditioning on day 3, only DG-ChR2 mice (n =27) showed a reduction of freezing responses on day 11 (Interaction F4,151 = 8.48, P < 0.001). BLA-ChR2
mice (n = 29) showed increased levels of freezing on day 11 compared to day 3. DG-ChR2-NoUS-Day7 mice (n = 42) and mCherry-only mice (DG n = 32; BLA n = 29) did not show differences between day 3 and day 11. e, After correcting for the time spent freezing, DG-ChR2 mice spent a larger proportion of time sniffing than any other group in Context A on day 11 (F4,151 = 7.78, P < 0.001). Results show mean ± s.e.m.
![[PDF] Tutoriel capteur infrarouge avec Arduino | Cours PDF](data:image/gif;base64,R0lGODlhAQABAIAAAP///wAAACH5BAEAAAAALAAAAAABAAEAAAICRAEAOw==)