HAL Id: hal-02619795
https://hal.inrae.fr/hal-02619795
Submitted on 25 May 2020HAL is a multi-disciplinary open access archive for the deposit and dissemination of sci-entific research documents, whether they are pub-lished or not. The documents may come from teaching and research institutions in France or abroad, or from public or private research centers.
L’archive ouverte pluridisciplinaire HAL, est destinée au dépôt et à la diffusion de documents scientifiques de niveau recherche, publiés ou non, émanant des établissements d’enseignement et de recherche français ou étrangers, des laboratoires publics ou privés.
Sylvain Vrignon-Brenas, Aurelie Metay, Romain Leporatti, Shiva Gharibi,
Alana Fraga, Myriam Dauzat, Gaelle Rolland, Anne Pellegrino
To cite this version:
Sylvain Vrignon-Brenas, Aurelie Metay, Romain Leporatti, Shiva Gharibi, Alana Fraga, et al.. Gradual responses of grapevine yield components and carbon status to nitrogen supply. OENO One, Institut des Sciences de la Vigne et du Vin (Université de Bordeaux), 2019, 53 (2), pp.289-306. �10.20870/oeno-one.2019.53.2.2431�. �hal-02619795�
Gradual responses of grapevine yield components
and carbon status to nitrogen supply
Sylvain Vrignon-Brenas1, Aurélie Metay2, Romain Leporatti1, Shiva Gharibi1, Alana Fraga1,
Myriam Dauzat1, Gaëlle Rolland1and Anne Pellegrino1*
1UMR LEPSE, Université Montpellier Inra, Montpellier SupAgro, F-34060 Montpellier, France 2UMR SYSTEM, Montpellier SupAgro, Inra, Cirad, CIHEAM-IAMM, Univ Montpellier,
F-34060 Montpellier, France
Corresponding author: [email protected]
Aim: Nitrogen is a major element conditioning grapevine growth, yield and aromatic profiles of berries and wines. Different tools can be used in order to detect differences in N status of the plant, including direct measurements of soil, plant nitrogen status (eg. petiole; must), or indirect observations of plant nutritional status such as leaf transmittance or reflectance (eg. SPAD; NDVI). However, the relationships between these indicators of nitrogen status and the overall plant functioning over vintages remain poorly known. The present study aimed at quantifying key vegetative and reproductive responses to plant nitrogen status over two successive seasons under different nitrogen supply levels.
Methods and results: Potted plants of Sauvignon blanc grafted onto SO4 were grown outdoors in 2017 and 2018 with no water limitation. Four mineral nitrogen fertilization levels (equivalent to 0 kg of N ha-1 or 0U, 20U, 40U,
80U) and one organic nitrogen fertilization level (40U) were imposed in 2017. These treatments were doubled in 2018 to increase the degree of nitrogen supply and consequently, the range of observed effects on plant growth and yield. Plant nitrogen status (SPAD) was monitored weekly during both growing cycles. Yield components were determined over the two seasons. Lastly, plant carbon status was addressed through dynamic measurement of plant development and photosynthesis, and destructive measurement of dry matter accumulation and carbon storage in annual and perennial organs at flowering, veraison and harvest.
The SPAD values progressively decreased under lower N supply (0N) during the first year (from 31 to 16) and they were more than halved between the maximum and the minimum N treatments straight after budburst in year two (40 for 160N and 19 for 0N). Then, the differences in SPAD values among treatments were maintained up to harvest (2018). The gradient of N status resulted in a gradient of berry numbers per inflorescence (from 180 to 34 berries/inflorescence for 80N and 0N, respectively in 2018) and of individual berry dry matter at harvest (from 0.13 to 0.41 g for 160N and 0N, respectively in 2018). Quantitative relationships between N status and the relative reductions (% of reduction per %SPAD decrease) in terms of C gain (leaf area, photosynthesis), C growth (shoot, berry, trunk and root dry matter) and C storage (trunk and root) were fitted at flowering, veraison and harvest. The reduction in C gain under lower N supply was mainly related to the decrease in total leaf area before flowering (-1.64 %). Although the photosynthesis rate tended to decrease under N deficiency over the season, it only poorly contributed to the reduction in C gain. The whole plant C growth was inhibited when N status decreased (-1.13 % at harvest), due to the inhibition of shoot dry matter before veraison (-1.81 %) and to a lower extent, to the lower dry matter in berries (-0.80 %), trunks (-0.42 %) and roots (-0.84 %) at harvest. Part of the reduction in root dry matter was related to the lower starch reserves (-0.31 %) at harvest. Interestingly, starch reserves tended to be higher under organic N supply than mineral N supply.
Conclusion: The present results provided a general framework of carbon gain and use over time (within and between seasons) as impacted by N supply levels and form. Such a framework will be useful when building a model of the pluri-annual dynamics of carbon balance related to yield elaboration in grapevines.
grapevine, SPAD, N supply, yield components, quantitative responses
A B S T R A C T
K E Y W O R D S
Received : 11 March 2019; Accepted : 25 April 2019; Published : 25 May 2019 DOI: 10.20870/oeno-one.2019.53.2.2431
V I N E A N D W I N E OPEN ACCESS JOURNAL
This article is published in cooperation with the 21th GIESCO International Meeting, June 23-28 2019, Thessaloniki, Greece. Guests editors : Stefanos Koundouras and Laurent Torregrosa
INTRODUCTION
Vitis vinifera L. (Grapevines), like other
perennial crops, is marked by important fluctuations of nutrient content related to vine phenology (Bünemann, 1980; Schreiner, 2016). This is particularly the case for nitrogen (N). The seasonal dynamics of N are generally characterized by a translocation of N from woody tissues toward actively growing organs at the beginning of the season, from budburst to flowering (Zapata et al., 2004). Plant growth is then further promoted by the N assimilation from root, up to veraison (Comas et al., 2000; Lakso and Eissenstat, 2012). From veraison until leaf fall, N uptake decreases and the N stored in annual growth parts is reallocated to woody tissues, thus decreasing the N content of annual tissues (Pradubsuk and Davenport, 2010; Schreiner, 2016; Treeby and Wheatley, 2006). Therefore, N reserves accumulated in the previous seasons play a major role in vegetative and reproductive development up to flowering, which conditions the plant functioning all through the season (Lobit et al., 2001; Zapata et
al., 2004).
Vineyard N management is critical in order to control vine vigour and in fine the source/sink relationships and the canopy microclimate, to ensure the success of berry development and to reach specific berry quality in respect of the wine type targeted. Low nitrogen availability decreases vegetative growth (Metay et al., 2014) and photosynthetic activity (Prieto et al., 2012), while it promotes the levels of carbon allocated to the root and the root to shoot dry matter ratio (Hermans et al., 2006). Moreover, low nitrogen availability decreases the N content in berries with negative impact on aroma profiles and wine fermentability (Bell and Henschke, 2005; Conde
et al., 2007; Rapp and Versini, 1995; Verdenal et al., 2017). On the other hand, by promoting high
shoot vigour, berry growth and N accumulation in shoots, excessive N supply can depreciate the bunch microclimate (Treeby and Wheatley, 2006), delay berry maturity and increase the incidence of Botrytis bunch rot (Conradie, 2005). Based on the dynamics of root and berry development (Bates et al., 2002), the two most appropriate periods to supply N in order to control the vegetative N status and berry amino-acid at harvest may be between flowering and veraison (Conradie, 1990; Treeby and Wheatley, 2006; Verdenal et al., 2017), or even after harvest, when the climatic conditions are warm
enough to keep leaves active (Holzapfel and Treeby, 2007). This demonstrates that it can be very important to be able to detect a N deficiency or more globally to evaluate the N status of the plant. Grape growers usually implement very few tools to manage N supply, and only use the target yield as a gross estimator of the nitrogen needs of the vine (Cahurel et al., 2018). However, some indicators exist to assess plant N status. For instance, N biochemical analyses in petiole, leaf blade and must have proved useful to characterize the dynamics of N allocation within the plant (Munson, 1998; Romero et al., 2014; 2013; Tregoat et al., 2002). On this point, leaf blade sampling may be more accurate for assessing N levels than using leaf petioles (Romero et al., 2014). A great deal of attention must be paid to differentiate situations of low leaf N from leaf N dilution. Leaf sampling for N status assessment should therefore be consistent and always performed on equivalent leaves such as young fully expanded and photosynthetically active leaves and which are well exposed to sunlight. Recently, non-destructive spectral methods have also been proposed to assess leaf N status, such as the N-tester (N-N-tester, Yara, Paris), the Dualex (Force-A Dualex Scientific+ TM) or the SPAD (Soil Plant Analysis Division value) (Brunetto et al., 2012; van Leeuwen et al., 2000). In contrast with biochemical analysis which takes a few days to perform or which is performed late in the season (eg. N in must), non-destructive spectral-based indicators provide an immediate assessment of the N available for the plant and can thus be quite useful to estimate N content in leaves (Brunetto et al., 2012). In their study on cv. Shiraz, Metay et al. (2014) highlighted that the SPAD was efficient to identify a gradient of N treatments and to quantify their relative impact on vegetative growth components (primary and secondary axes) at veraison. The SPAD can be used as an early and sensitive indicator of the N stress experienced by the plant, although specific SPAD thresholds should be calibrated per cultivar (Romero et al., 2013).
The objectives of the present study, conducted on Sauvignon blanc, were ultimately to: (i) quantify the N supply effects on the dynamics over the season of leaf N status (SPAD), C gain (photosynthesis, leaf area), C growth (biomass accumulation in annual and perennial parts) and C storage (starch content in perennial parts) and (ii) hierarchize the relative responses to N status of yield components and of C balance terms at
key phenological stages. In the mid-term, the objective of this work is to propose a quantified conceptual framework for modelling the pluri-annual and dynamic impacts of N constraint on grapevine yield.
MATERIALS AND METHODS
1. Plant material and growth conditions Two experiments, called “Experiment 1” and “Experiment 2”, were conducted in 2017 and 2018 outside on potted grapevines at the Montpellier-SupAgro Campus (43’83’’N, 38’53’’E) in the South of France. The scion was Sauvignon blanc, and the rootstock was SO4. Two lots of plants (total of 151 plants) were grown outdoors during one year prior to the experiments. Plants in the first batch were 2 and 3 years old in Experiment 1 (2017 and 2018, respectively). Plants in the second batch were 2 years old in Experiment 2 (2018). For both experiments, the plants were pruned to one individual primary shoot and were vertically trained. The number of bunches per shoot was restricted to one in 2017 and two in 2018. The pots (10 l) were filled with a mixture of frozen black sphagnum peat moss, peat fibre, fine clay, and blond sphagnum peat moss (Klasmann, Substrat SP 15 %). Plants were drip-irrigated. Four irrigations per day were supplied in order to meet plant water needs, considering both plant leaf area and climatic demand. No water deficit was experienced by the grapevines. We maintained the water availability at 80 % of the maximum available soil water thanks to plant and pot weight measurements for all treatments, all through the cycle. All the pots were fertilized with a solution of macro- and micro-elements free of N two times in 2017 (255 and 716°Cd) and three times in 2018 (68, 478 and 966°Cd), similar to the protocol used by Zerihun and Treeby (2002). Contrasted treatments of mineral (NO3-NH4) or organic nitrogen (EO 4/3/5 +
3 GR, Frayssinet) supply were imposed, as explained in Table 1.
2. Experimental design and N treatments Five N treatments including four levels of mineral N and one level of organic N were imposed each year (Table 1). In 2018, N supply was doubled compared with 2017. Thus, a total of seven contrasted N treatments (five levels of mineral N and two levels of organic N) were tested. The levels of N for both years were on average 0, 0.46, 0.92 (1.15 in 2018), 1.84 (2.26 in 2018) and 4.10 g N per plant for mineral N;
and 0.92 and 2.03 g N per plant for organic N. When considering each plant being representative of one shoot in a vineyard with a density of 4400 plants per ha and 10 shoots per plant (ie. 44000 shoots/ha), these N supplies were equivalent to 0U, 20U, 40U, 80U and 160U for mineral N; and 40U and 80U for organic N. These N levels cover a range of N supply from no supply to excessive supply, in comparison to fertilization standards (Cahurel et
al., 2018). The N treatments started two weeks
after budburst and were applied up to veraison through five applications in 2017 and six applications in 2018 (Table 1).
3. Climate
Weather data (temperature, air moisture, wind speed and rainfall) were monitored with a weather station installed within the experimental area. Data readings, collected every 12 minutes, were averaged and stored in a datalogger (CR1000; Campbell Scientific Ltd, Shepshed, Leics, UK).
4. Leaf chlorophyll content and development The SPAD (SPAD-502, Konica-Minolta, Osaka, Japan) was measured once a week and the leaf specific dry matter (m-2g-1) was measured twice a month from budburst up to the harvest on six young fully expanded leaves per treatment with a similar exposure to sunlight. More precisely, the measurements were performed on the tenth leaf from the apex of the primary axis. Five successive readings were taken for SPAD measurements across the whole surface of the leaf. In addition, the total leaf area per plant (m²) was measured twice a month.
5. Leaf photosynthesis
The net rate of CO2assimilation under saturating
light intensity was measured on the middle part of fully developed leaves (the tenth leaf from the apex of the primary axis) using a portable gas exchange analyser (Ciras-2, PP Systems, UK). The measurements were made on six plants per N treatment at noon. The photosynthetic photon flux density, air temperature and air CO2
concentration imposed in the Ciras measurement chamber were 1600 μmol m-2 s-1, 27°C and 400 ppm, respectively.
6. Dry biomass allocations
For each treatment, from three to six plants per N treatment were sampled for destructive measurement of dry matter at different stages,
depending on experiment and year. In 2017, plants were sampled at two phenological stages: budburst and harvest (ca. 1561°Cd post-budburst; Table 1). In 2018, plants were sampled at four phenological stages: budburst, flowering, veraison and harvest (ca. 316, 1082 and 1832°Cd post-budburst, respectively; Table 1). Roots were carefully extracted from the soil and washed. Primary and secondary leaves and stems, bunches, trunk, and roots were separated. Trunk and root samples were frozen in liquid N and stored in the freezer (-60°C) for further starch content analyses. All organs were then oven-dried at 65°C for 3 days and their dry weights were determined.
7. Perennial starch content
Frozen wood and root tissues were lyophilised during 24 hours at -110°C (Heto PowerDry LL1500, Thermo). Then, each tissue was grounded to pass through a 0.1mm mesh grid for starch biochemical measurements. Starch was extracted with ethanol, then amyloglucosidase was used before a dosage by spectrophotometry at 340 nm according to the method proposed by Gomez et al. (2003).
8. Yield components
At flowering, the number of flowers per inflorescence was counted on six plants per treatment using an allometric relationship between the count obtained from the application VitisFlower® (Aquino et al., 2015) and destructive measurements (data not shown). Then, at veraison, the number of berries was counted on five plants per treatment. Lastly, at harvest, 20 berries per plant were separated from the grape to be oven-dried 3 days at 65°C and dry weighted.
9. Statistical analysis
After checking the data normality (Shapiro-Wilk test, α=0.05) and homoscedasticity (Bartlett test, α=0.05) at each date, one-way ANOVA (α=0.05) was performed for comparison of N treatment effects on plant variables. When the ANOVA was significant, a Tukey test (α=0.05) was used to compare the treatments. Then, linear relationships were fitted between the SPAD values and plant functions. For this purpose, the relative variations compared to a reference treatment were calculated both for SPAD and plant functions. This calculation was realized for each plant function called “variable Y” (Y representing a given function) at flowering,
TA BL E 1. De sc rip tio n of p he no lo gi ca l s tag es an d N tre atm en ts (m in er al an d or ga ni c ‘ or g’ fo rm s) ov er th e s ea so n. E xp er im en t 2 20 17 20 18 20 18 F lo w er in g 32 3 32 0 31 3 V er ai so n 10 36 10 69 10 95 H ar ve st 15 61 18 32 18 32 N tr ea tm en ts [ eq ui va le nt U ni ts ] [ 0N ; 2 0N ; 4 0N ; 8 0N ; 4 0o rg ] [0 N ; 4 0N ; 8 0N ; 1 60 N ; 8 0o rg ] [0 N ; 4 0N ; 8 0N ; 1 60 N ; 8 0o rg ] 8 6 [ 0; 0 .0 4; 0 .0 8; 0 .1 6; 0 .0 8 ] 6 7 [ 0; 0 .2 3; 0 .4 5; 0 .9 1; 0 .4 5 ] 60 [ 0 ; 0. 23 ; 0. 45 ; 0. 91 ; 0. 45 ] 15 8 [ 0; 0 .0 4; 0 .0 8; 0 .1 6; 0 .0 8 ] 13 0 [ 0; 0 .2 3; 0 .4 5; 0 .9 1; 0 .4 5 ] 12 3 [ 0; 0 .2 3; 0 .4 5; 0 .9 1; 0 .4 5 ] 25 5 [ 0; 0 .0 4; 0 .0 8; 0 .1 6; 0 .0 8 ] 17 3 [ 0; 0 .2 3; 0 .4 5; 0 .9 1; 0 .4 5 ] 16 7 [ 0; 0 .2 3; 0 .4 5; 0 .9 1; 0 .4 5 ] 32 3 [ 0; 0 .0 4; 0 .0 8; 0 .1 6; 0 .0 8 ] 24 2 [ 0; 0 .2 3; 0 .4 5; 0 .9 1; 0 .4 5] 23 4 [ 0; 0 .2 3; 0 .4 5; 0 .9 1; 0 .4 5 ] 96 1 [ 0; 0 .3 0; 0 .6 0; 1 .2 0; 0 .6 0 ] 75 6 [ 0; 0 ; 0; 0 .2 3; 0 .2 3; 0 ] 7 59 [ 0 ; [0 ; 0; 0 .2 3; 0 .2 3; 0 ] 96 2 [ 0; 0 .2 3; 0 .2 3; 0 .2 3; 0 .2 3 ] 96 6 [ 0; 0 .2 3; 0 .2 3; 0 .2 3; 0 .2 3 ] [ To ta l N s up pl y ov er th e se as on , g /p la nt ] [ 0; 0 .4 6; 0 .9 2; 1 .8 4; 0 .9 2 ] [ 0 ; 1. 15 ; 2. 26 ; 4. 10 ; 2. 03 ] [ 0 ; 1. 15 ; 2. 26 ; 4. 10 ; 2. 03 ] E xp er im en t 1 P la nt p he no lo gi ca l s ta ge s (° C d po st -b ud bu rs t) T im in g (° C d po st -b ud bu rs t) a nd a m ou nt o f N s up pl y (e qu iv al en t U ni ts o r kg /h a or g p er p la nt ) T im in g in ° C d [ N s up pl y, g /p la nt ]
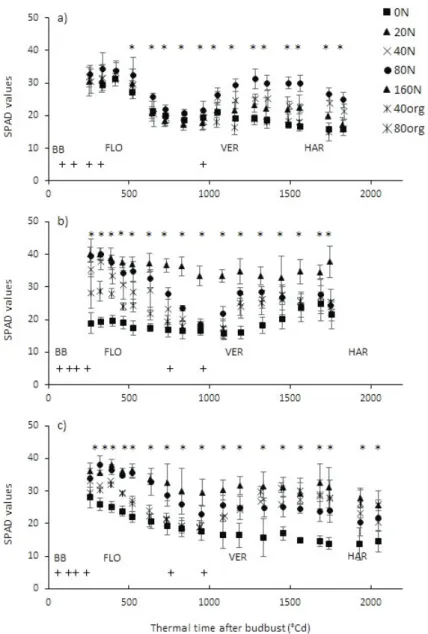
values), were different according to the N treatments for all Experiments (Figure 1-a, b, c). In Experiment 1 - 2017 (Figure 1-a), the SPAD values progressively decreased from 34 to 20 for all N treatments after flowering (323°Cd post-budburst), to 800°Cd post-budburst (pre-veraison). The high N fertilization at 961°Cd post-budburst (Table 1) resulted in an increase of SPAD values for all the mineral N treatments (20N, 40N and 80N). Straight after veraison (1036°Cd post-budburst), the SPAD ranged from 21 for 0N to 26 for 80N. As the reproductive veraison and harvest. The reference treatment
was the treatment for which the maximum plant and bunch dry matter were observed for both “Experiment 1” and “Experiment 2”. All statistical analyses were performed using R software, ver. 3.5.2 (R Core Team, 2018).
RESULTS
1. Effect of various N supplies on leaf N status dynamics over two successive years (1 and 2) The leaf N status dynamics, as estimated through the chlorophyll content of the leaves (SPAD
FIGURE 1. Time course of SPAD values according to thermal time after budburst (in °Cd) for Experiment 1 in 2017 (a), 2018 (b) and Experiment 2 in 2018 (c).
The sign ‘+’ indicates the timing of N applications. Main developmental stages are indicated: flowering (FLO), veraison (VER) and harvest (HAR). Vertical lines indicate the confident interval (n=6, p=0.05). Asterisks indicate a significant effect of the treatment (p<0.05).
sink strength became higher straight after veraison, the SPAD values decreased for all treatments. At harvest (1561°Cd post-budburst), the SPAD ranged from 16 to 23 depending on treatment.
During the second year of N treatment for Experiment 1 - 2018 (Figure 1-b), the SPAD values also progressively decreased from flowering (320°Cd post-budburst) to veraison (1069°Cd post-budburst), except for the 0N and 160N treatment. Indeed, the SPAD values for 160N remained high (SPAD>35) over the whole period, although the SPAD for 0N treatment was lower compared to other treatments straight after budburst. After veraison, the SPAD values increased for all treatments except the 160N, ranging at harvest (1832°Cd post-budburst) from 21 to 38 for the 0N and 160N treatments, respectively.
In Experiment 2 - 2018 (Figure 1-c), ie. the first year of N treatment in 2018, the maximal SPAD
values pre-flowering reached ca. 38, similarly to Experiment 1 - 2017. At flowering (313°Cd post-budburst), the SPAD was significantly higher for 40N, 80N and 160N (35 on average) compared to 0N and 80org treatments (24 on average). Then, it decreased for all treatments until veraison (1095°Cd post-budburst). The SPAD values ranged from 16 for 0N to 31 for 160N at veraison. Lastly, the SPAD increased up to harvest (1832°Cd post-budburst) for all treatments except the 0N. The minimum and maximum SPAD values at harvest ranged from 14 for 0N to 26 for both 160N and 80org treatments.
A high range of SPAD values was reached over the two experiments, covering a gradient from high N deficiency to excess of N. The N treatments differed at key stages from flowering to harvest in year one, and straight from budburst in year two.
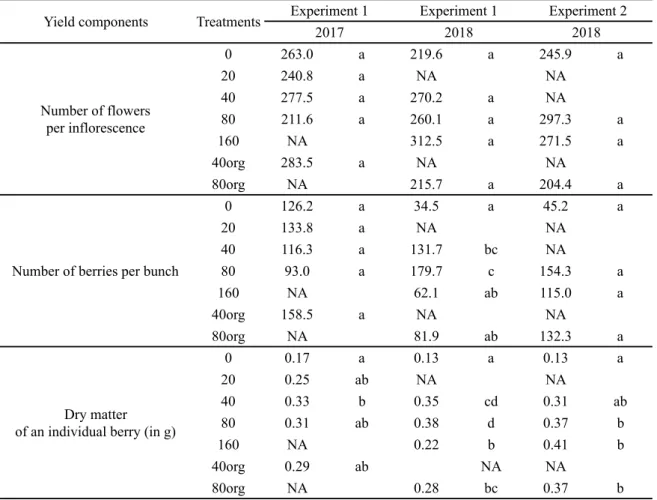
TABLE 2. Numbers of flowers and berries per bunch and dry matter of an individual berry according to N treatment and Experiment/year. Data are the mean of six plants. Values in bold show the treatment with the highest mean. Similar letters indicate homogeneous groups after Tukey’s test (p>0.05).
0 263.0 a 219.6 a 245.9 a 20 240.8 a NA NA 40 277.5 a 270.2 a NA 80 211.6 a 260.1 a 297.3 a 160 NA 312.5 a 271.5 a 40org 283.5 a NA NA 80org NA 215.7 a 204.4 a 0 126.2 a 34.5 a 45.2 a 20 133.8 a NA NA 40 116.3 a 131.7 bc NA 80 93.0 a 179.7 c 154.3 a 160 NA 62.1 ab 115.0 a 40org 158.5 a NA NA 80org NA 81.9 ab 132.3 a 0 0.17 a 0.13 a 0.13 a 20 0.25 ab NA NA 40 0.33 b 0.35 cd 0.31 ab 80 0.31 ab 0.38 d 0.37 b 160 NA 0.22 b 0.41 b 40org 0.29 ab NA NA 80org NA 0.28 bc 0.37 b Number of flowers per inflorescence
Number of berries per bunch
Dry matter of an individual berry (in g)
Yield components Treatments Experiment 1 Experiment 1 Experiment 2
2. Yield component responses to N supply (years 1 and 2)
The impact of N status on yield components, including the number of inflorescences per plant, the numbers of flowers and berries (percentage of setting) per bunch and the final berry size were addressed in Table 2.
In the present study, the impact of N treatment (year 1) on the number of inflorescences (year 2) could only be assessed in Experiment 1 - 2018: the number of inflorescences was 3.6 on average and was not significantly impacted by the N treatments (p>0.05; data not shown).
The mean number of flowers per inflorescence was in the same range (204 to 312) for all experiments (Table 2). This was not significantly impacted by the N treatments (p>0.05). Similarly, the number of berries did not differ between N treatments during the first year in Experiment 1 and Experiment 2, although the
FIGURE 2. Time course of total leaf area (a, b, c; in m²) and net photosynthesis (d, e; in µmol m-2s-1) according to thermal time after budburst (in °Cd) for Experiment 1 in 2017 (a, d), 2018 (b) and Experiment 2 in 2018 (c, e).
Main developmental stages are indicated: flowering (FLO), veraison (VER) and harvest (HAR). Vertical lines indicate the confidence interval (n=6, p=0.05). sterisks indicate a significant effect of the treatment (p<0.05).
effect of treatments might have been masked due to the high variability of berry numbers for the 160N treatment (Table 2). Indeed, bunches were infected by rot on that treatment and high berry drop was observed (data not shown). The average number of berries per bunch reached 126 in Experiment 1 2017 vs 112 in Experiment 2 -2018. In contrast, the second year of treatment (Experiment 1 - 2018) was characterized by a significantly higher number of berries per bunch for the 80N and 40N treatments (156 berries on average) compared to the 0N treatments (35 berries), while the other treatments (80org and 160N) showed a range of intermediate values. The percentage of setting after one year of N treatment was ca. 49 % and 44 % in Experiment 1 - 2017 and Experiment 2 - 2018, respectively. After two successive years of N treatments, it ranged from 52 % for 80N to 18 % for 0N. The individual berry dry matter was also significantly influenced by the N treatment
(Table 2). When no N was supplied (0N), the berry dry matter was the lowest (p<0.05) compared to all other N treatments (from 0.13 g for Experiment 1 - 2018 to 0.17 g for Experiment 1 - 2017). No clear difference in individual berry dry matter was observed among the other N treatments. In Experiment 1 - 2017, the berry dry matter was higher for 40N (0.33 g) compared to 0N, while all other treatments showed intermediate values. The berry dry matter was the highest for 80N in Experiment 1 -2018 (0.38 g). Regarding Experiment 2 - -2018,
the berry dry matter was significantly higher for 80N, 160N and 80org treatments compared to 0N (p<0.05), the 40N treatment was intermediate (0.31 g).
To summarize, low N supply (≤40N) lowered final yield through the decrease in berry dry weight after one and two years of N treatments and through the lower number of berries (lower berry set) after two successive years of N treatment only. High N supply (160N) also resulted in lower yield due to rot development and berry drop. No effect of N deficiency on the
FIGURE 3. Dry matter at harvest (in g per plant) of shoot (), trunk (), root () and bunches () according to N treatments for Experiment 1 in 2017 (a), 2018 (b) and Experiment 2 in 2018 (c).
Vertical lines indicate the confidence interval (n=6, p=0.05). Similar letters indicate homogeneous groups after Tukey’s test (p>0.05) performed on each plant part. The letters above the histogram indicate the homogeneous groups regarding the overall plant.
number of inflorescences was observed in our study, as a narrow range of N status was reached during the critical phase of inflorescence differentiation in latent buds in year one.
3. Leaf growth and photosynthetic activity responses to N supply (years 1 and 2)
The total leaf area (Figure 2-a, b, c) increased over the cropping season and was impacted by the N supply for all experiments. In Experiment 1 - 2017 (Figure 2-a), the total leaf area was lower for the 0N treatment and higher for the 80N treatment straight after flowering at 419°Cd (p<0.05). The difference between these two N treatments (0N and 80N) then persisted until the harvest. At that time, the total leaf area was 0.35 m² for 0N and 0.99 m² for 80N. From veraison to harvest, the total leaf area of the 40N treatment
was significantly higher compared to 0N treatment and lower than 80N treatment, while the 40org was intermediate. During the second year of N treatment of Experiment 1 - 2018, the total leaf area differed among treatments before flowering (Figure 2-b). The total leaf area for 0N treatment stayed extremely low until harvest (≤0.17 m²) compared to the 160N (1.4 m² at harvest). The total leaf area for other N treatments were intermediate between those extremes (0.68 m² for 40N, 0.56 m² for 80org and 1.0 m² for 80N). In Experiment 2 - 2018, similarly to Experiment 1 - 2018, the gradual increase in total leaf area under higher N supply started before flowering. At harvest the total leaf area ranged from 0.18 m² for 0N to 1.4 m² for 160N, all other treatments showing intermediate values (Figure 2-c).
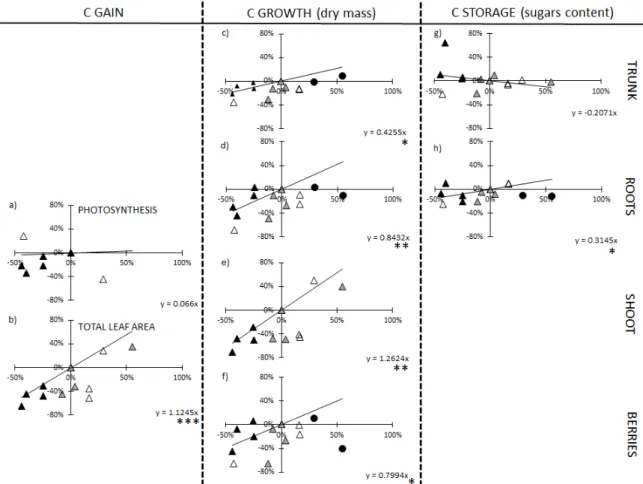
FIGURE 4. Quantitative relationships between SPAD and plant functions related to carbon acquisition (photosynthesis (a), total leaf area (b)), carbon growth (dry matter of trunks (c), roots (d), shoots (e) and individual berries (f)) and carbon storage (starch concentration in trunks (g) and roots (h)).
Each plot represents the variation of a given variable Y and SPAD compared to the 80N treatment as follows: %_ Y = a x %_ SPAD. All Experiment/year and N treatments were included, except the 160N treatment, when the variables at that N level plateaued or decreased compared with the 80N treatment.
The symbols represent the Experiment and year: Experiment 1 - 2017 (▲); Experiment 1 - 2018 (▲);
Experiment 2 - 2018 ( ▲▲). The black circles (●) correspond to the 160N that was excluded. OENO One, 2019, vol. , x
1
The dynamics of leaf net photosynthesis (Pn) over the season for Experiment 1 - 2017 and Experiment 2 - 2018 are illustrated in Figure 2-d, e. The Pn values were around 12.5 µmol m-2 s-1 at flowering for all N treatments in both Experiment 1 - 2017 (Figure 2-d) and Experiment 2 - 2018 (Figure 2-e), and then they constantly and progressively decreased until harvest. In Experiment 1, Pn was generally lower (p<0.05) for both 0N and 40org treatments compared to the 80N treatment, while the 20N was intermediate. Notably, at veraison Pn reached 5.6 µmol m-2 s-1 on average for 0N and 40org and 11.4 µmol m-2 s-1 for 80N. For Experiment 2, Pn was also lower for the 0N treatment compared to the 80N treatment before veraison, while all other treatments showed intermediate values. After veraison, the 160N treatment was characterized by the lowest Pn values (4.7 µmol m-2s-1for 160N vs 9.5 µmol m -2s-1for other treatments on average).
In conclusion, our results showed that both the total leaf area and the photosynthetic activity dynamics were impacted by the N supply. When the N supply increased (from 0N to 80N), total leaf area was five times higher and photosynthesis two times higher at veraison. Under the highest N level (160N) the total leaf area was still promoted (+30 % compared to 80N) while the net photosynthesis was inhibited after the veraison stage (-40 %). Ultimately, those results indicated that under higher N supply, the gain in total surface leaf area was widely higher compared to any photosynthesis decrease, suggesting that the final C fixation also globally increased.
4. C growth and C storage responses to N supply (years 1 and 2)
The total dry matter (Figure 3) of the whole-plant at harvest increased when the N supply was higher, except for Experiment 2 - 2018. For this experiment, a very high variability in total dry matter was observed (coefficient of variation > 50 %, data not shown). In Experiment 1 (2017-2018), the dry matter for 0N treatment was the lowest (137.9 g and 115.0 g, respectively for the first and second years of N treatment) and the highest for the 80N treatment (304.5 g and 315.2 g, respectively for the first and second years of N treatment). When the N supply increased up to 160N (Experiment 1 - 2018), no additional dry matter increment was observed (Figure 3-b; p>0.05). The other treatments (20N, 40N, 40org and 80org) showed intermediate values of dry
matter. The total dry mater for 40org and 80org were similar to the ones of 20N and 40N, respectively. The impacts of N supply on the perennial (root + trunk) and aerial (stem + bunch) components of the total dry matter were then addressed.
The dry matter of roots was not significantly impacted by N supply for Experiment 2. In contrast, the root dry matter for Experiment 1 (2017-2018) tended to be lower for 0N and organic N (40org) compared to other N levels. Trunk dry matter was similar across the range of N supply in Experiment 1 - 2017. However, during the second year of Experiment 1 - 2018 and during Experiment 2 - 2018, the trunk dry matter was the lowest for 0N treatment and reached highest values for 80N and 160N treatments, all other treatments producing intermediates values. The perennial dry matter (root + wood) tended to increase in 2018 (Experiment 1 and Experiment 2) when mineral N supply was higher from 0N to 80N. No additional perennial biomass was observed for 160N, compared to 80N. The proportion of the total dry matter allocated to the perennial organs showed the opposite trend: when the N supply increased, the proportion of dry matter allocated to the perennial parts decreased. Indeed, it represented 82 % and 49 % of the total dry matter for 0N and 160N, respectively. Lastly, the organic N supply (80org) in 2018 (Experiment 1 and Experiment 2) resulted in perennial biomass increment similar to that observed for the 40N treatment.
The annual aerial vegetative dry matter (shoot + leaves) gradually increased (p<0.05) when N supply was higher for all experiments, as observed for the total leaf area (Figure 2-a, b, c). This dry matter was notably higher for 80N compared to 0N for both experiments and years (+109 g on average per plant; Figure 3-a, b, c). The higher N supply (160N) did not systematically favour supplementary dry matter growth (cf Experiment 1 - 2018, Figure 3-b). In contrast with the perennial dry matter, the proportion of total dry matter allocated toward the annual aerial vegetative part was higher under high N supply. It represented 12 % to 44 % of the total dry matter for 0N and 160N, respectively. As observed for perennial parts, the organic N supply of 40org and 80org led to annual aerial vegetative dry matter that was close to the observations for the 20N and 40N treatments, respectively.
The dry matter of bunches did not significantly change between the N treatments in Experiment 1 - 2017. However, for both Experiment 1 - 2018 and Experiment 2 - 2018, higher N supplies increased the bunch dry matter (ca. +65 % from 0N to 80N), except under high N supply (160N) in Experiment 1 - 2018. The bunch dry matter of 40N treatment was intermediate between the 0N and 80N treatments in both Experiment 1 and 2. For the 80org treatment, the bunch dry matter was not different to the 0N for the Experiment 1 - 2018, whereas it was similar to 80N in Experiment 2. The proportion of the total dry matter allocated to the bunch was ultimately lower when N supply increased for all experiments.
The proportion of dry matter allocated to bunches increased from 11 % to 16 %, when N supply increased from 0N to 80N. This proportion then decreased to 11 % for the 160N treatment. The organic fertilization (40org) intermediate values ranged between 0N and 80N treatments (13 %), while the 80org permitted to reach a higher proportion of dry matter allocated to bunches (23 %).
The impact of N supplies on the carbon content stored in perennial organs including roots and trunk (starch) are represented in Table 3. The starch content was generally higher in roots (>150 mg g-1 DM) compared to trunks, where it
rarely exceeded 100 mg g-1 DM. The effect of N supply on starch content was not significant in trunks (p>0.05), except during the second year of N treatment of Experiment 1. For this, the starch content was the highest for 80org and the lowest for 0N, while all other treatments, including the 160N, were between those extremes. The root starch content was also similar between the N treatments in Experiment 1 - 2017, although it varied with N supply in 2018 for both experiments (Experiment 1 and 2). In both cases, the root starch content was -20 % to -30 % lower for 0N treatments compared to the 80N in Experiment 1 and to the 40N and 80org in Experiment 2. As observed for trunks, the 160N treatment did not increase the root starch content, while the 80org tended to be higher.
In conclusion, N supply from 0N to 80N increased the total dry matter production (Figure 3) at harvest, although higher N supply (160N) did not permit supplementary biomass increment. The higher plant dry matter was supported by a lower proportion of dry matter allocated to perennial tissues, while the proportion of dry matter allocated to the aerial vegetative parts sharply increased for both mineral and organic fertilization treatments. The proportion of dry matter allocated to the reproductive tissues showed a lower increase when N supply increased and strongest increased
0 84.4 a 99.8 a 95.8 a 20 81.3 a NA NA 40 79.1 a 131.2 ab 117.7 a 80 76.2 a 127.0 ab 122.9 a 160 NA 125.0 ab 125.3 a 40org 125.0 a NA NA 80org NA 138.5 b 114.6 a 0 141.4 a 209.6 a 150.3 a 20 120.5 a NA NA 40 137.1 a 250.5 ab 218.5 b 80 152.1 a 263.2 b 200.3 ab 160 NA 233.0 ab 179.8 ab 40org 166.7 a NA NA 80org NA 240.6 ab 221.4 b Experiment 1 Root Wood Starch content
(mg per g-1of dry matter) Treatments
Experiment 2
2017 2018 2018
TABLE 3. Starch content at harvest (in mg g-1DM) of trunk and root according to treatments and Experiment/year. Values are the mean of six plants. Values in bold show the treatment with the highest mean. Similar letters indicate homogeneous groups after Tukey’s test (p>0.05).
for the 80org treatment. The carbon storage (Table 3) tended to increase with higher N supply. However, the increase in starch storage was less marked compared to the dry matter increase. Lastly, organic fertilization tended to promote starch restoration at harvest in wood and root although the effect was not systematic for all years and experiments.
5. Quantitative responses of C gain, C growth and C storage to N deficiency at harvest The effect of N supply on plant functions related to carbon gain, carbon growth and carbon storage was quantified at harvest in Figure 4. For this purpose, the relative reduction of each plant function and SPAD values were calculated using the 80N treatment as a reference. Indeed, both plant dry matter and bunch dry matter were shown to reach maximum values for this treatment (Figure 3). The 160N treatment was not included in the adjustment of the
relationship, when it resulted in a depreciative effect compared with the 80N treatment.
The C gain variables included the net photosynthesis and the total leaf area. The net photosynthesis was poorly linked to the SPAD at harvest (p>0.05; Figure 4-a). In contrast, the total leaf area significantly decreased when the SPAD was lower, reaching ca -1.12 % per percent of SPAD reduction (p<0.05).
The whole plant C growth (total plant dry matter) variations were highly correlated to the SPAD variation at harvest (-1.13 % per percent of SPAD reduction; not shown). All dry matter components (trunk, roots, shoots and berries) were correlated to the SPAD values (Figure 4-c, d, e, f). However, based on the regression coefficients obtained, the aerial vegetative dry matter was the most sensitive growth process to lower N supply, followed by root, berry and trunk. The dry matter of an individual berry (Figure 4-f) linearly decreased when SPAD was
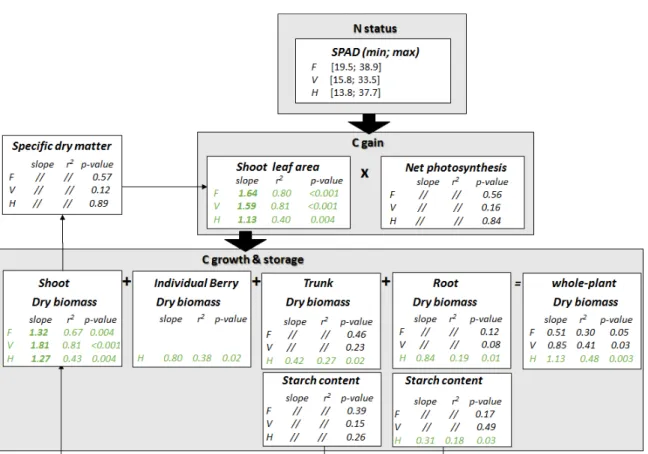
FIGURE 5. General framework of the quantitative impacts of SPAD variation on plant functions related to carbon acquisition, growth and storage at flowering, veraison and harvest.
The regression coefficient corresponds to the linear regression at each stage between the variation of a given variable Y and SPAD compared to the 80N treatment (see Figure 4). The r² and the p-values of these relationships are indicated. All experiments (Experiment 1 and Experiment 2) and years (2017-2018) were included in the relationships. F: flowering, V: veraison, H: harvest. ‘//’: are used when p>0.05.
lower (<80U). It was also lower under high N supply (160N).
The SPAD reduction differently affected the C storage in perennial organs at harvest (Figure 4-g, h). While starch accumulation tended to decrease in roots when SPAD was lower, no clear variation in trunk starch content was observed.
Ultimately, the effects of SPAD on the terms of carbon gain, growth and storage could be quantified at harvest. The regression coefficient of the fitted relationships showed that the C gain and C growth were reduced when N supply was lower (from 80N to 0N), mostly due to the reduction in leaf area and shoot dry matter. However, other growth components, including the individual berry and the perennial organs, were also correlated to a lower extent to N status. In addition, C restoration in the root storage pool slightly decreased under lower N supply.
DISCUSSION
The present study has highlighted the preponderant role of N status (SPAD) at harvest in terms of carbon balance related to C gain (shoot leaf area; net photosynthesis), C growth (vegetative and reproductive annual dry matter; perennial dry matter) and C storage (starch in perennial parts) (Figure 4). However, parameter settings for quantitative relationships over the different periods of the cropping season are necessary in order to find when plant functions are most impacted by N status. Thus, quantitative relationships between the SPAD readings and the terms of C balance were shown at two additional key phenological stages, ie. at flowering and at veraison (Figure 5).
1. Relevance of SPAD index as an indicator of N status
In our experiments, we tested seven N treatments considering the five contrasted levels of N supply (0, 20, 40, 80 and 160N) and two N fertilizer forms (organic and mineral). The SPAD values from flowering to harvest greatly varied, ranging from 13.8 to 38.9 depending on treatments and experiments (Figure 5). The SPAD was shown to be a very sensitive indicator of the N supply, as previously observed in other studies (Brunetto et al., 2012; Cerovic et al., 2015) (Figure 1). Indeed, the SPAD values permitted to discriminate the N treatments well before any change in plant functioning was noticed. For instance, in Experiment 1 - 2017,
the SPAD value at flowering greatly differed between treatments (19.5 to 38.9), whereas the net photosynthesis and the specific dry matter of leaf only slightly changed (7 % and 9 %, respectively). The SPAD values also underlined the contrasted kinetics of N provision to the plant between organic and mineral fertilizers. More precisely, our results obtained in Experiment 1 and 2 (2018) showed that the SPAD values for the 80org treatment were similar to the 40N treatment until veraison suggesting that only 50 % of the N supply was released at this period. Then, the SPAD values increased and reached the values observed for the 80N. These observations clearly underline the need to consider the kinetics of N release for organic fertilizers (Conradie, 2001) to adapt N management (particularly the timing of application) and avoid any risk of N deficiency during the most sensitive periods for production (ie. flowering/veraison).
The use of the SPAD method presents some advantages compared to other methods implemented in the vineyard to diagnose the plant nitrogen status (eg. petiole analysis, leaf blade analysis and grape analysis). Indeed, SPAD measurements are easy to perform, non-destructive, cheap and provide immediate and sensitive assessment of the leaf N status. Our study highlighted the early response of SPAD to N supply (eg. in Experiment 1 - 2017 where the SPAD decreased due to insufficient N fertilization up to 961°Cd post-budburst, and later suddenly rose in response to substantial N fertilization; Figure 1). Another advantage of the SPAD method is the possibility to adjust N supply in real-time through fertilization management (van Leeuwen et al., 2000). The N fertilization in 2018 was adjusted over the cropping season, based on the SPAD readings. Two additional N fertilizations at 759°Cd and 966°Cd were notably decided from SPAD kinetics and permitted to maintain a sufficient gradient between N treatments. Although the SPAD method presents many advantages, the challenge of this method consists in establishing the relationship and/or threshold between leaf nitrogen content and SPAD values. Indeed those relationships are cultivar-specific dependent, non-linear, especially at optimal and supra-optimal N contents (Cerovic et al., 2012), and influenced by specific leaf area (Cerovic et al., 2015).
2. Hierarchical responses of the terms of carbon balance under nitrogen deficiency over the cropping seasons
C gain decreased when N supply was lower, due to the inhibition of vegetative growth (Figure 5), as shown in numerous previous studies (Körner, 2013; Zerihun and Treeby, 2002). The effects of N supply on vegetative growth was the strongest before flowering (regression coefficient = 1.64). Although the differences among treatments persisted afterwards, leaf growth progressively plateaued from veraison (Figure 2). The differences in total leaf area were thus mostly inherited from the period before flowering. Based on our results, the net photosynthesis (Pn) poorly contributed to the lower C gain under N deficiency regardless of the stage (flowering, veraison and harvest) (Figure 5). The higher sensitivity to low N supply of leaf growth compared with photosynthetic activity is consistent with other studies (Körner, 2013). However, since Pn was systematically measured at midday on young fully expanded leaves, it was not representative of the photosynthetic activity at the whole plant scale over the whole day. In addition, the decrease of Pn over the season for all N treatments possibly masked the effects of N treatment. Such Pn decreases may be related to stomatal closure at noon due to high vapour-pressure deficit (VPD) during summer. One may expect lower Pn per unit of leaf area under N deficiency or excess due to the higher proportion of leaves turning senescent or being shaded, respectively (Prieto et al., 2012). Whole-plant photosynthesis measurement could provide a better estimation of the C gain than our measurements of potential photosynthesis based on one single mature leaf.
C growth decreased when N supply was lower. In contrast with leaf area, the highest impact of N status (SPAD) on the whole plant dry matter accumulation was observed late in the season, at harvest (Figure 5). However, the magnitude and the timing of the effect of N supply on the production of dry matter largely depended on the considered tissue. The allocation of dry matter toward the aerial organs was higher compared with the dry matter allocated to the roots (less than 30 % of the total dry matter) similarly to other studies on the grapevine (Grechi et al., 2007; Metay et al., 2014). The annual organs (shoots) were the most sensitive compartment to the N supply (higher regression coefficients regardless of the stages). The strongest decrease
in shoot growth under nitrogen deficiency was observed at veraison (-1.81 % per SPAD% variation). This is likely to result from the reduction of both leaf area (pre-flowering) and shoot vigour (pre-veraison) assessed by stem diameter which also significantly decreased with low N supply (data not shown). Indeed, no effect of N supply on the leaf thickness (leaf specific dry matter) was observed over the season (Figure 5). It should be noted that the shoot dry matter reduction mainly depended on the decrease in the lateral shoot dry matter. Notably, the reduction in lateral dry matter under low N supply was 1.5 times higher compared to the reduction in main axes dry matter (data not shown). The hierarchy of primary and secondary axes growth inhibitions under N deficiency appeared consistent with those observed for Shiraz under N deficit (Metay et al., 2014) and for Shiraz and Grenache under water deficit. The growth of perennial organs (roots and trunk) was mainly impacted by N treatments at harvest. In grapevine, roots grow throughout the entire cycle but two peaks of annual root development generally occur at flowering and after veraison (Bates et al., 2002; van Zyl, 1984). The dry matter measured in the present study did not only represent the structural C, but also the storage C. Part of the dry matter incremental value in the trunk and roots was related to accumulation in reserves. In roots, the starch content represented on average 14 % of the dry matter at harvest in year 1 and up to 26 % in year 2 (Experiment 1 -2018), while in trunks it represented on average between 8 % and 13 % of the dry matter. No clear effect of N on wood starch content was observed regardless of the stages. However, the starch content in wood decreased under lower N supply at budburst after one year of treatment (-28 %; data not shown). The starch storage in roots tended to decrease under lower N supply at harvest after both one and two years of treatment. Over the seasons, starch content in roots and wood decreased in the same order of magnitude (around -50 %) from budburst to flowering. Starch reallocation in perennial parts was lower under low N availability. These observations were in accordance with Zapata et
al. (2004) or Holzapfel et al. (2010). The
reallocation of carbon toward the reserve pool highly depends on abiotic factors and source/sink ratio, starting from flowering (Zapata et al., 2004) or later on at veraison or after harvest under high crop load or abiotic constraints (Holzapfel et al., 2010). Lastly, it should be
noted that soluble sugar content in perennial organs was not tested in our study, although their proportion (in particular sucrose) cannot be neglected (Holzapfel et al., 2010).
Ultimately, yield mainly decreased under low N supply due to the lower individual berry weight at harvest (Figure 3, Table 2). No effect on the number of clusters was observed (Experiment 1 -2018). However, it should be noted that the N status (SPAD) did not substantially differ between the N treatments during the potential period of inflorescence initiation and differentiation, ie. close to flowering (Experiment 1 - 2017). One could expect to modify the cluster pool more strongly with more contrasted N levels at that critical stage. The number of flowers was not impacted by the N supply in the first year of treatment, or the second year (Table 2). In contrast, we observed berry number reduction due to high N supply (160N). Berry abortion under high N supply was likely to be due to the high vegetative vigour which may have lowered the allocation of sugar toward the grapes (Lebon et al., 2008) and increased the canopy density and berry N content that ultimately promoted rot development (Bains
et al., 1981; Smart, 1985).
Our study confirmed that increasing N supply (up to 80N) favours the source/sink ratio, final yield and reserve restoration although higher N supply (160N) has a depletion effect (Dordas, 2008; Lebon et al., 2008).
3. Toward a modelling approach integrating the gradual responses of grapevine growth, yield and storage processes to nitrogen supply?
Numerous models exist to simulate the seasonal C balance in vines under abiotic constraints and its impact on final yield [Bindi et al. (1997); Nendel and Kersebaum (2004); the STICS model (Brisson et al., 1998) adapted for the grapevine by Garcia de Cortazar Atauri (2006); VitiSim (Lakso and Poni, 2005)]. A process-based model was recently developed by Nogueira Júnior et al. (2018) to simulate the dynamics of grapevine growth over the years. However, none of the above models simulates the plurennial effect of N supply on C balance and yield components (eg. number of berries).
The present study permitted to quantify the specific response of the terms of C balance and of yield components to a wide range of N supply over two successive years. Contrasted regression
coefficients were obtained at three different phenological stages between leaf N status and C gain (leaf photosynthesis, total leaf area), C growth (root, trunk, shoot, leaf and berry dry matter) and C storage (root and trunk starch content). These regression coefficients provide new knowledge about the intensity, the timing and the hierarchical plant C responses to N supply. Such relationships represent the underlying basis of a conceptual model of the dynamics of source/sink activities in the grapevine. However, further research is needed to address more specifically the effects of plant C and N status on yield elaboration over two successive years, to ultimately develop a new model of plurennial grapevine C/N balance and yield elaboration under abiotic constraint (N deficiency).
CONCLUSION
Our study permitted to quantify the effect of contrasting N supplies on the main variables involved in carbon gain, growth and storage processes according to the phenological stages. We showed that shoot organs were the most sensitive to N application from flowering compared to the perennial organs (ie. roots and wood). The response of shoot organs to contrasted N supply was important in terms of (i) carbon acquisition, mainly due to an increase of the leaf surface and (ii) carbon growth (increase of dry matter). The relative increase of these two functions when the N status was higher was similar suggesting that none of them was favoured. In contrast, the storage and dry matter of perennial organs were impacted later (from veraison to harvest) and tended to be higher in roots with an increasing or organic form of N supply. Consequently, the N supply modified the source/sink relationships. More dry matter was allocated to the shoot parts compared to the fruits. Ultimately, the present study permitted to identify the timing and intensity of the responses of source/sink activities to N supply. These results will be useful for a modelling perspective. We proposed a conceptual framework of the impact of N supply in terms of C balance, which will be used later on to build a new model of the plurennial dynamics of grapevine carbon balance related to yield elaboration under N deficiency.
Acknowledgements : This study was supported by the Fond Unique Interministériel (FUI n°21) as part of the project NV2. The authors would
like to thank the partners of the project, notably from ITK, Frayssinet, Lallemand and Nyseos.
REFERENCES
Aquino A., Millan B., Gaston D., Diago M.-P. and Tardaguila J., 2015. VitisFlower®: Development and testing of a novel android-smartphone application for assessing the number of grapevine flowers per inflorescence using artificial vision techniques. Sensors, 15(9), 21204–21218. doi:10.3390/s1509 21204
Bains K.S., Bindra A.S. and Bal J.S., 1981. Seasonal changes in carbohydrate and mineral composition of overvigorous and devitalized Anab-e-Shahi grapevines in relation to unfruitfulness. Vitis, 20(4), 311–319. https://ojs. openagrar.de/index.php/VITIS/ article/view/311
Bates T.R., Dunst R.M. and Joy P., 2002. Seasonal dry matter, starch, and nutrient distribution in ‘Concord’ grapevine roots. HortScience, 37(2), 313–316. doi:10.21273/ HORTSCI.37.2.313
Bell S.-J. and Henschke P.A., 2005. Implications of nitrogen nutrition for grapes, fermentation and wine. Australian Journal of Grape and Wine Research, 11(3), 242–295. doi:10.1111/j.1755-0238.2005.tb0 0028.x
Bindi M., Miglietta F., Gozzini B., Orlandini S. and Seghi L., 1997. A simple model for simulation of growth and development in grapevine (Vitis vinifera L.). II. Model validation. Vitis, 36(2), 73–76. https://ojs.opena grar.de/index.php/VITIS/ article/view/4859
Brisson N., Mary B., Ripoche D., Jeuffroy M.-H., Ruget F., Nicoullaud B., Gate P., Devienne-Barret F., Antonioletti R., Durr C., Richard G., Beaudoin N., Recous S., Tayot X., Plenet D., Cellier P., Machet J.-M., Meynard J.M. and Delécolle R., 1998. STICS: A generic model for the simulation of crops and their water and nitrogen balances. I. Theory and parameteri-zation applied to wheat and corn. Agronomie, 18(5–6), 311–346. doi:10.1051/agro :19980501
Brunetto G., Trentin G., Ceretta C., Girotto E., Lorensini F., Miotto A., … de Melo G., 2012. Use of the SPAD-502 in estimating nitrogen content in leaves and grape yield in grapevines in soils with different texture. American Journal of Plant Sciences, 3(11), 1546–1561. doi:10.4236/ajps.2012.311187 Bünemann G., 1980. Mineral nutrition and fruit quality of temperate zone fruit trees. In D. Atkinson, J. E. Jackson, R. O. Sharples, W. M. Waller (Eds.), Mineral Nutrition of Fruit Trees (pp. 3–9): Butterworth-Heinemann. doi:10.1016/B978-0-408-10662-7.50006-5
Cahurel J.-Y., Bidaut F., Crété X., Damay N., Dubrulle P., Dumot V., … Trambouze W., 2018. N-Pérennes, un outil de raisonnement de la fertilisation
azotée en cultures pérennes : application à la vigne et à certains arbres fruitiers. Innovations Agronomiques, 63, 433–443. doi:10.15454/1.519120075396944 3E12 Cerovic Z.G., Ghozlen N. B., Milhade C., Obert M., Debuisson S. and Le Moigne M., 2015. Nondestructive diagnostic test for nitrogen nutrition of grapevine (Vitis vinifera L.) based on Dualex leaf-clip measurements in the field. Journal of Agricultural and Food Chemistry, 63(14), 3669–3680. doi:10.1021/acs.jafc.5b0 0304
Cerovic Z.G., Masdoumier G., Ben Ghozlen N. and Latouche G., 2012. A new optical leaf-clip meter for simultaneous non-destructive assessment of leaf chlorophyll and epidermal flavonoids. Physiologia Plantarum, 146(3), 251–260. doi:10.1111/j.1399-3054.2012.01639.x
Comas L.H., Eissenstat D. M. and Lakso A.N., 2000. Assessing root death and root system dynamics in a study of grape canopy pruning. New Phytologist, 147(1), 171–178. doi:10.1046/ j.1469-8137.2000. 00679.x
Conde C., Silva P., Fontes N., Dias A.C.P., Tavares R.M., Sousa M.J., Alice Agasse, Serge Delrot and Gerós H., 2007. Biochemical changes throughout grape berry development and fruit and wine quality. Food, 1(1), 1–22. http://www. globalscience books.info/Online/GSBOnline/OnlineFOOD_1_1. html
Conradie W.J., 1990. Distribution and translocation of nitrogen absorbed during late spring by two-year-old grapevines grown in sand culture. American Journal of Enology and Viticulture, 41(3), 241–250. https://www.ajevon line.org/content/41/3/241
Conradie W.J., 2001. Timing of nitrogen fertilisation and the effect of poultry manure on the performance of grapevines on sandy soil. I. Soil analysis, grape yield and vegetative growth. South African Journal of Enology and Viticulture, 22(2), 53–59. doi:10.21548/22-2-2192
Conradie W.J., 2005. Partitioning of mineral nutrients and timing of fertilizer applications for optimum efficiency. In L. P. Christensen, D. R. Smart (Eds.), Proceedings of the Soil Environment and Vine Mineral Nutrition Symposium, San Diego, California (pp. 69–81): American Society for Enology and Viticulture.
Dordas C., 2008. Role of nutrients in controlling plant diseases in sustainable agriculture. A review. Agronomy for Sustainable Development, 28(1), 33–46. doi:10.1051/agro:2007051
Garcia de Cortazar Atauri I., 2006. Adaptation du modèle STICS à la vigne (Vitis vinifera L.) : utilisation dans le cadre d’une étude d’impact du changement climatique à l’échelle de la France. PhD thesis, École nationale supérieure agronomique (Montpellier).
Gomez L., Jordan M.-O., Adamowicz S., Leiser H. and Pagès L., 2003. Du prélèvement au dosage : réflexions sur les problèmes posés par la mesure des glucides non structuraux chez les végétaux ligneux. Cahiers Agricultures, 12(6), 368–386. http://revues.
cirad.fr/index.php/
cahiers-agricultures/article/view/30409
Grechi I., Vivin P., Hilbert G., Milin S., Robert T. and Gaudillère J.-P., 2007. Effect of light and nitrogen supply on internal C:N balance and control of root-to-shoot biomass allocation in grapevine. Environmental and Experimental Botany, 59(2), 139–149. doi:10.1016/j.envex pbot.2005.11.002 Hermans C., Hammond J.P., White P. J. and Verbruggen N., 2006). How do plants respond to nutrient shortage by biomass allocation? Trends in Plant Science, 11(12), 610–617. doi:10.1016/j. tplants.2006.10.007
Holzapfel B.P., Smith J.P., Field S.K. and Hardie W.J., 2010. Dynamics of carbohydrate reserves in cultivated grapevines. In J. Janick (Ed.), Horticultural Reviews, volume 37 (pp. 143–211): Wiley-Blackwell. doi:10.1002/9780 470543672 .ch3 Holzapfel B.P. and Treeby M.T., 2007. Effects of timing and rate of N supply on leaf nitrogen status, grape yield and juice composition from Shiraz grapevines grafted to one of three different rootstocks. Australian Journal of Grape and Wine Research, 13(1), 14–22. doi:10.1111/j.1755-0238.2007.tb00067.x
Körner C., 2013. Growth controls photosynthesis – mostly. Nova Acta Leopoldina, 391, 273–283. Lakso A.N. and Eissenstat D.M., 2012. Fifteen years of vine root growth studies in Concords. Cornell Viticulture and Enology, 4, 1–5. https://grapes andwine.cals.cornell.edu/newsletters/appellation-cornell/2012-newsletters/issue-12/
Lakso A.N. and Poni S., 2005. «VitiSim» - A simplified carbon balance model of a grapevine. In H. R. Schultz (Ed.), Proceedings of the 14th International GESCO Viticulture Congress, Geisen-heim, Germany (pp. 478–484).
Lebon G., Wojnarowiez G., Holzapfel B., Fontaine F., Vaillant-Gaveau N. and Clément C., 2008. Sugars and flowering in the grapevine (Vitis vinifera L.). Journal of Experimental Botany, 59(10), 2565–2578. doi:10.1093/jxb/ ern135
Lobit P., Soing P., Génard M. and Habib R., 2001. Effects of timing of nitrogen fertilization on shoot development in peach (Prunus persica) trees. Tree Physiology, 21(1), 35–42. doi:10. 1093/treephys /21.1.35
Metay A., Magnier J., Guilpart N. and Christophe A., 2014. Nitrogen supply controls vegetative growth, biomass and nitrogen allocation for grapevine (cv. Shiraz) grown in pots. Functional Plant Biology, 42(1), 105–114. doi:10.1071/FP14062
Munson R.D., 1998. Principles of plant analysis. In Y. P. Kalra (Ed.), Handbook of Reference Methods for Plant Analysis (pp. 1–24): CRC Press, Boca Raton. doi:10.1201/9781420049398
Nendel C. and Kersebaum K.C. 2004. A simple model approach to simulate nitrogen dynamics in vineyard soils. Ecological Modelling, 177(1–2), 1–15. doi:10.1016/j.ecolmodel.2004.01.014
Nogueira Júnior A.F., Amorim L., Savary S. and Willocquet L., 2018. Modelling the dynamics of grapevine growth over years. Ecological Modelling, 369, 77–87. doi:10.1016/j.ecolmodel. 2017.12.016 Pradubsuk S. and Davenport J.R., 2010. Seasonal uptake and partitioning of macronutrients in mature ‘Concord’ grape. Journal of the American Society for Horticul-tural Science, 135(5), 474–483. doi:10.21273/ JASHS.135.5.474
Prieto J.A., Louarn G., Perez Peña J., Ojeda H., Simonneau T. and Lebon E., 2012. A leaf gas exchange model that accounts for intra-canopy variability by considering leaf nitrogen content and local acclimation to radiation in grapevine (Vitis vinifera L.). Plant, Cell & Environment, 35(7), 1313–1328. doi:10.1111/j.1365-3040. 2012.02491.x Rapp A. and Versini G., 1995. Influence of nitrogen compounds in grapes on aroma compounds in wine. Developments in Food Science, 37, 1659–1694. doi:10.1016/S0167-4501(06)80257-8
R Core Team, 2018. R: A language and environment for statistical computing. Vienna, Austria. Retrieved from https://www.R-project.org/
Romero I., Benito A., Dominguez N., Garcia-Escudero E. and Martin I., 2014. Leaf blade and petiole nutritional diagnosis for Vitis vinifera L. cv. Tempranillo by deviation from optimum percentage method. Spanish Journal of Agricultural Research, 12(1), 206–214. doi:10.5424/sjar/2014121-4308 Romero I., Garcia-Escudero E. and Martin I., 2013. Leaf blade versus petiole analysis for nutritional diagnosis of Vitis vinifera L. cv. Tempranillo. American Journal of Enology and Viticulture, 64(1), 50–64. doi:10.5344/ajev.2012. 11004
Schreiner R.P., 2016. Nutrient uptake and distribution in young Pinot noir grapevines over two seasons. American Journal of Enology and Viticulture, 67(4), 436–448. doi:10.5344/ajev. 2016.16019
Smart R.E., 1985. Principles of grapevine canopy microclimate manipulation with implications for yield and quality. A Review. American Journal of Enology and Viticulture, 36(3), 230–239.
Treeby M.T. and Wheatley D.M., 2006. Effect of nitrogen fertiliser on nitrogen partitioning and pool sizes in irrigated Sultana grapevines. Australian Journal of Experimental Agriculture, 46(9), 1207–1215. doi:10.1071/EA05238
Tregoat O., van Leeuwen C., Choné X. and Gaudillère J.-P., 2002. The assessment of vine water and nitrogen uptake by means of physiological indicators: influence on vine development and berry potential (Vitis vinifera L. cv. Merlot, 2000, Bordeaux). Journal Interna-tional des Sciences de la Vigne et du Vin, 36(3), 133–142. doi:10.20870/oeno-one.2002.36.3.967
van Leeuwen C., Friant P., Soyer J.-P., Molot C., Choné X. and Dubourdieu D., 2000. L’intérêt du dosage de l’azote total et de l’azote assimilable dans le moût comme indicateur de la nutrition azotée de la vigne. Journal International des Sciences de la Vigne et du Vin, 34(2), 75–82. doi:10.20870/oeno-one.2000.34.2.1010
van Zyl J.L., 1984. Response of Colombar grapevines to irrigation as regards quality aspects and growth. South African Journal of Enology and Viticulture, 5(1), 19–28. doi:10.21548/5-1-2365
Verdenal T., Zufferey V., Spring J.-L., Dienes-Nagy Á., Belcher S. and Lorenzini F., 2017. Impact de la zone d’application de l’urée foliaire sur la teneur en azote des raisins. Revue Suisse de Viticulture, Arboriculture et Horticulture, 49(6), 354–359. https://www.revuevitiarbohorti. ch/wp-content/uploads/2017_06_f_1114.pdf
Zapata C., Deléens E., Chaillou S. and Magné C., 2004. Partitioning and mobilization of starch and N reserves in grapevine (Vitis vinifera L.). Journal of Plant Physiology, 161(9), 1031–1040. doi:10.1016 /j.jplph.2003.11.009
Zerihun A. and Treeby M.T., 2002. Biomass distribution and nitrate assimilation in response to N supply for Vitis vinifera L. cv. Cabernet-Sauvignon on five Vitis rootstock genotypes. Australian Journal of Grape and Wine Research, 8(3), 157–162. doi:10.1111/j.1755-0238.2002. tb00251.x