An Approach to Analyze Tradeoffs for Aerospace
System Design and Operation
by
Michael Gregory O’Neill
S.B., Aerospace Engineering, Syracuse University, 2007
S.M., Aeronautics & Astronautics, Massachusetts Institute of Technology, 2010 Submitted to the Department of Aeronautics and Astronautics
in partial fulfillment of the requirements for the degree of Doctor of Philosophy
in AERONAUTICS AND ASTRONAUTICS at the
MASSACUSSETTS INSTITUTE OF TECHNOLOGY February 2013
© 2012 Massachusetts Institute of Technology. All rights reserved.
The author hereby grants to MIT permission to reproduce and to distribute publicly paper and electronic copies of this thesis document in whole or in part in any medium now known or hereafter created.
Author... M. Gregory O’Neill Department of Aeronautics and Astronautics September 28, 2012 Certified by... Olivier de Weck Professor of Aeronautics and Astronautics and Engineering Systems Thesis Supervisor Certified by... R. John Hansman Professor of Aeronautics and Astronautics Thesis Supervisor Certified by... Annalisa L. Weigel Assistant Professor of Aeronautics and Astronautics Thesis Committee Member Accepted by... Eytan H. Modiano Professor of Aeronautics and Astronautics Chair, Graduate Program Committee
An Approach to Analyze Tradeoffs for Aerospace
System Design and Operation
by
Michael Gregory O’Neill
Submitted to the Department of Aeronautics and Astronautics on September 28, 2012 in partial fulfillment of the requirements for the degree of Doctor of Philosophy in Aeronautics and Astronautics.
A
BSTRACTThere are important tradeoffs that need to be considered for the design and operation of aerospace systems. In addition to tradeoffs, there may also be multiple stakeholders of interest to the system and each may have different preferences as to the balance amongst the tradeoffs under consideration. A tradeoff hyperspace is created when there are three or more tradeoff dimensions and this increases the challenge associated with resolving the hyperspace in order to determine the best design and operation of a system. The corresponding objectives of this research are to develop a framework to analyze tradeoff hyperspaces and to account for the preferences of multiple stakeholders in this framework.
The framework developed in this research is called the Tradeoff Analysis Framework and its applicability was evaluated through analyzing three different case studies in the aerospace domain, each progressively more complex in terms of applying the framework and exploring the impact of certain types or change, or innovation in the system of interest. The first case study analyzed the impact of changing aircraft cruise operations and one facet of the case study explored the impact of imposing a hypothetical tax on aircraft-produced contrails. From this study it was determined that airlines will change their behavior (i.e., their perceived value-optimal cruise trajectory) in response to a tax placed on producing contrails where, the higher the tax, the less contrails they choose to produce. The second case study explored the impact of changes in aircraft approach procedures into Boston-Logan airport. In this study, there were multiple stakeholders, each with different preferences as to the balance amongst the performance and environmental tradeoffs considered. A key result from this study was that competing stakeholder preferences could be partially resolved, which led to the design new approach procedures that were beneficial to all stakeholders. The third and last case study examined the tradeoffs associated with using fractionated spacecraft for remote sensing space missions. Here, the current paradigm is monolithic spacecraft and it was found that despite fractionated spacecraft demonstrating more value-robustness than a comparable monolith, they fail to stay value-competitive to monoliths in terms of absolute value delivered. In particular, this occurs because presently the enabling technologies required for fractionated spacecraft are not yet mature and reliable enough at the performance levels needed for them to become viable alternatives to monoliths.
Along with insights gained in the case studies about the systems of interest, through applying the Tradeoff Analysis Framework insights were gained with respect to implementing the framework. These insights form the methodological contributions of this research since they offer opportunities to learn about the breadth of potential framework applicability and areas for subsequent improvements in the framework for future use.
B
IOGRAPHICALN
OTEGreg O’Neill grew up in Lewisburg, Pennsylvania and early on demonstrated an interest in mechanics, mathematics, and science. This interest remained with him through high school and following his graduation he chose to pursue engineering at the collegiate level. He began his engineering studies at Syracuse University in the Department of Mechanical and Aerospace Engineering in 2003. In May 2007, he graduated from Syracuse University with a Bachelors of Science in Aerospace Engineering and a minor in Mathematics and Economics. Then, in September 2007, he began his graduate studies at Massachusetts Institute of Technology, eventually completing his Master’s of Science degree in February 2010. Upon completion of his Master’s degree, he immediately began working on his Doctor of Philosophy degree. At MIT, Greg has maintained a socio-technical interdisciplinary education and research focus, primarily drawing from the fields of Aerospace Engineering, Systems Engineering (Theory), Space Systems, Aircraft/Air Transportation Systems, Mathematics, and Economics. He is particularly interested in designing and evaluating innovative systems (architectures) using a combination of technical system models, valuation theory, and economics.
Following the completion of his collegiate education, Greg plans to teach in a field related to Aerospace Engineering.
A
CKNOWLEDGEMENTSI would like to recognize several individuals for their contributions to my research and ultimately education at MIT. First, I would like to thank Nirav Shah and Zoe Szajnfarber for their invaluable guidance and feedback. Without them, I would have remained a lost and confused doctoral student, and I am therefore deeply appreciative of them for their continual help and support. Second, I would like to thank one of my thesis advisors, John Hansman. John was the first faculty member I met at MIT, having started out as a teaching assistant for him and, since this initial introduction, he has remained a constant source of guidance (and rationalization) for all things in my life research related or not. Lastly, I would like to thank Oli de Weck and Annalisa Weigel for their continual support of my independent research endeavors. Over the span of my graduate work at MIT, they have given me the freedom to pursue my research as I saw fit, and for this I am very thankful.
In direct support of my research, I would like to acknowledge Jean-Marie Dumont for his contributions to the first case study used in my research. I would also like to thank Neil Chen and Banavar Sridhar at NASA’s Aviation Systems Division who in part supported this research.
I would also like to acknowledge my family and friends who have supported me along the way and ultimately helped me mature as a person and as an educator. My experiences at MIT have reinforced their crucial role in my pursuit of excellence and I hope that the completion of my PhD may, in part, serve as recognition of their support in this continual pursuit.
Table of Contents
1.
Research Motivation and Objectives ... 23
2.
Literature review – Tradeoff Analysis Frameworks ... 25
2.1. Context – Systems Engineering Frameworks ... 25
2.1.1. The V-Model ... 25
2.2. Multi-Stakeholder, Tradeoff Analysis Frameworks ... 26
2.2.1. Decision-based Design Framework ... 26
2.2.2. Multi-Attribute Tradespace Exploration Framework ... 27
2.2.3. Change Propagation Analysis Frameworks ... 29
2.2.4. Hazard and Risk Analysis Frameworks ... 30
2.2.5. Multi-Actor, Multi-Criteria Analysis Frameworks ... 31
2.2.6. Negotiations ... 32
2.3. Observations from the Literature ... 33
3.
Literature review – Innovation Assessment Frameworks ... 35
3.1. Overview ... 35
3.2. Literature ... 36
3.3. Tradeoff Analysis Framework Motivation ... 39
4.
Tradeoff Analysis Framework ... 41
4.1. Tradeoff Analysis Framework Overview ... 41
4.1.1. Baseline Framework ... 41
4.1.2. Framework with Multiple Stakeholders ... 42
4.1.3. Framework with Optimization ... 42
4.2. Structuring the Proposed Changes ... 44
4.2.1. The Change Taxonomy ... 45
4.2.2. Using the Change Taxonomy to Analyze Historical Engineering Programs ... 46
4.2.3. The Deep Space Network ... 46
4.2.4. Controlled Flight Into Terrain ... 49
4.2.5. Observations from the Historical Applications ... 52
4.3. Extended Framework Discussion ... 52
4.3.1. System Transform ... 52
4.3.2. Valuation ... 53
4.3.3. Identifying Stakeholder Misalignment ... 55
4.3.4. Facilitating Stakeholder Alignment ... 57
4.3.5. Stakeholder Value ... 60
4.3.6. Uncertainty ... 62
4.4. Summary of the Tradeoff Analysis Framework Functionality ... 63
5.
Overview of the Case Studies ... 65
6.
Case Study 1 – Single Stakeholder, Simplified Aircraft Cruise Operations . 67
6.1. Background ... 676.2. Literature Review – Case Study 1 ... 67
6.3. Application of the Framework ... 69
6.3.1. Framework Application Overview ... 69
6.3.2. Stakeholders and System Outputs ... 69
6.3.3. Valuation ... 70
10
© 2012 Massachusetts Institute of Technology. All rights reserved.
6.3.5. System Model: The Simplified Model of Aircraft Operations ... 72
6.3.6. External Factor Model ... 73
6.4. Analyses ... 74
6.4.1. Overview of Analyses ... 74
6.4.2. Analyses and Results ... 75
6.5. Discussion ... 86
6.5.1. Case Study Insights ... 87
6.5.2. Framework Implementation Insights ... 89
7.
Case Study 2 – Multi-Stakeholder, Aircraft Approach Procedures ... 95
7.1. Background ... 95
7.2. Literature Review – Case Study 2 ... 97
7.3. Application of the Framework ... 98
7.3.1. Framework Application Overview ... 98
7.3.2. Stakeholders and System Outputs ... 99
7.3.3. Valuation ... 100
7.3.4. Proposed System Changes ... 103
7.3.5. System and External Factor Models ... 104
7.3.6. Modeling Changes in Technology ... 105
7.3.7. Modeling Changes in ConOps ... 106
7.4. Analyses ... 106
7.4.1. Background ... 107
7.4.2. Problem Scope and Assumptions ... 107
7.4.3. Overview of Analyses ... 108
7.4.4. Analyses and Results ... 108
7.5. Discussion ... 115
7.5.1. Case Study Insights ... 116
7.5.2. Framework Implementation Insights ... 119
8.
Case Study 3 – Multi-Stakeholder, Remote Sensing Space Mission ... 123
8.1. Background ... 123
8.1.1. Sharing Subsystem Resources ... 124
8.2. Literature Review – Case Study 3 ... 124
8.3. Application of the Framework ... 126
8.3.1. Framework Application Overview ... 126
8.3.2. Stakeholders and System Outputs ... 127
8.3.3. Valuation ... 129
8.3.4. Proposed System Changes ... 130
8.3.5. System and External Factor Models ... 131
8.3.6. Modeling Changes in Technology ... 135
8.3.7. Innovation and System Performance ... 137
8.3.8. Modeling Changes in ConOps ... 137
8.4. Analyses ... 139
8.4.1. Architectures ... 139
8.4.2. Problem Scope and Assumptions ... 139
8.4.3. Overview of Analyses ... 141
8.4.4. Analyses and Results ... 141
8.5.1. Case Study Insights ... 149
8.5.2. Framework Implementation Insights ... 155
9.
Discussion ... 159
9.1. Framework Opportunities ... 159
9.1.1. Framework Applicability ... 159
9.1.2. The Change Taxonomy ... 161
9.1.3. Analyzing the Tradeoff Hyperspaces with Principal Component Analysis ... 162
9.2. Contributions ... 164
9.2.1. A Coupled Change (Innovation) Assessment ... 165
9.2.2. A Framework for Analyzing Tradeoff Hyperspaces ... 167
9.2.3. Accounting for the Preferences of Multiple Stakeholders ... 170
9.2.4. Framework Implementation Insights ... 171
9.3. Scope of Framework Applicability ... 172
10.
Conclusion ... 175
References ... 181
Appendix A: Hyperspace Visualization (Extended Discussion) ... 191
Appendix B: The DoE Method for RNAV/RNP Approaches ... 203
Appendix C: PCA of the Remote sensing Mission Case Study Results ... 207
L
IST OFF
IGURESFigure 1-1. A Notional Tradeoff Hyperspace. ... 23
Figure 1-2. A Tradeoff Hyperspace for an Aircraft. ... 23
Figure 1-3. Competing Stakeholder Preferences in a Tradeoff Space. ... 23
Figure 2-1. A V-Model Systems Engineering Framework. ... 25
Figure 2-2. Decision-based Design Framework. ... 27
Figure 2-3. Multi-Attribute Tradespace Exploration Framework. ... 28
Figure 2-4. Change Prediction Method Framework. ... 30
Figure 2-5. A Hazard and Risk Analysis Framework. ... 31
Figure 2-6. Multi-Actor, Multi-Criteria Analysis Framework. ... 32
Figure 2-7. Nash Bargaining. ... 33
Figure 3-1. Literature Overview. ... 35
Figure 3-2. TMAT Process for Tracking Technology Impacts. ... 36
Figure 3-3. K-σ Technology Readiness Distribution. ... 39
Figure 4-1. Baseline Framework. ... 41
Figure 4-2. Framework with Multiple Stakeholders. ... 42
Figure 4-3. Framework with Optimization. ... 42
Figure 4-4. The Change Taxonomy. ... 45
Figure 4-5. Technology Innovation in the DSN. ... 47
Figure 4-6. DSN Innovation (Change) Progression. ... 48
Figure 4-7. DSN Performance Gains due to Innovation. ... 49
Figure 4-8. World Airline Fatalities (1986-1995). ... 50
Figure 4-9. CFIT Innovation Progression. ... 51
Figure 4-10. Framework: System Transform stem Transform. ... 52
Figure 4-11. System Transform. ... 52
Figure 4-12. Framework: Valuation. ... 53
Figure 4-13. Identifying Stakeholder Misalignment. ... 55
Figure 4-14. Stakeholder Value Thresholds. ... 60
Figure 4-15. Sequence of Proposed Changes. ... 61
Figure 4-16. Uncertainty in the Framework. ... 62
Figure 6-1. Framework Application (Case Study 1). ... 69
Figure 6-2. Stakeholder and System Output Matrix (Case Study 1). ... 70
Figure 6-3. Change Taxonomy (Case Study 1). ... 71
Figure 6-4. Simplified Cruise Operations Representation using the September 21, 2009 External Factors. ... 72
Figure 6-5. GTG2 Turbulence Data. ... 73
Figure 6-6. The Full-Factorial System Output Space... 76
Figure 6-7. August 12, 2011 External Factors ... 78
Figure 6-8. PCA Representation of the System Output Space (September 21, 2009 External Factors). ... 78
Figure 6-9. PCA Representation of the System Output Space (August 12, 2011 External Factors). . 79
Figure 6-10. Operationally Driven and Operationally and Environmentally Driven Trajectory Comparison. ... 81
Figure 6-11. Results of the Contrail Tax (Policy) Analysis. ... 83
Figure 6-12. Airline Selected Point. ... 85
Figure 6-13. Region of Possible Airline Preferences. ... 85
14
© 2012 Massachusetts Institute of Technology. All rights reserved.
Figure 7-1. RNAV-X. ... 96
Figure 7-2. Framework Application (Case Study 2). ... 98
Figure 7-3. Stakeholder and System Output Matrix (Case Study 2). ... 99
Figure 7-4. Change Taxonomy (Case Study 2). ... 103
Figure 7-5. Noise and Performance Impact Model. ... 104
Figure 7-6. Computing Population Noise Exposure. ... 105
Figure 7-7. BOS Runway Configurations. ... 107
Figure 7-8. Track Finder Program: Resulting Tradespace. ... 111
Figure 7-9. RWY 4R (ILS) and 4R (RNAV) Approach Routes. ... 112
Figure 7-10. Noise Comparison (DNL). ... 113
Figure 7-11. Noise Comparison (Time-Above 60 dB). ... 113
Figure 7-12. System Output Comparison. ... 114
Figure 7-13. Value Propositions (Case Study 2). ... 115
Figure 8-1. A Fractionated Spacecraft Concept. ... 123
Figure 8-2. Framework Application (Case Study 3). ... 127
Figure 8-3. Stakeholder and System Output Matrix (Case Study 3). ... 128
Figure 8-4. Spacecraft Revenue per Year. ... 130
Figure 8-5. Change Taxonomy (Case Study 3). ... 131
Figure 8-6. SET Functional Overview. ... 132
Figure 8-7. Continuous Innovation S-Curve. ... 136
Figure 8-8. Discrete Innovation S-Curve. ... 136
Figure 8-9. Spacecraft Architectures. ... 139
Figure 8-10. PCA of System Output Space. ... 142
Figure 8-11. Value Propositions (Case Study 3). ... 144
Figure 8-12. Sample Value Histogram. ... 144
Figure 8-13. ConOps “Corner” Points. ... 145
Figure 8-14. Value Percentiles. ... 146
Figure 8-15. Value-at-Risk and Gain Curves (On-Demand). ... 147
Figure 8-16. Value-at-Risk and Gain Curves (Predicted). ... 147
Figure 8-17. Framework Implementation Changes. ... 156
Figure 9-1. Three-Dimensional Change Taxonomy. ... 162
Figure 9-2. Change Taxonomy. ... 166
Figure 9-3. Changes Explored in the Case Studies. ... 166
Figure 9-4. Framework with Multiple Stakeholders. ... 167
Figure 9-5. Constrained Framework Scope. ... 169
Figure 9-6. A Notional Design Process. ... 173
Figure A-1. Example of an Icon Plot. ... 192
Figure A-2. Constructing a Glyph Plot. ... 193
Figure A-3. Example of a Pattern Glyph Plot. ... 193
Figure A-4. Example of a Parallel Coordinate Plot. ... 194
Figure A-5. Example of a 4D Plot. ... 195
Figure A-6. Matlab Peaks Function with a 2D slice at X = 0. ... 195
Figure A-7. An Example of a Plot-in-Plot Technique. ... 196
Figure A-8. An Example of a Carpet Plot. ... 197
Figure A-9. An Example of a Worlds-within-Worlds Plot. ... 198
Figure A-10. An Example of a Hyperslice Plot. ... 199
Figure C-1. PCA (On-Demand). ... 207
Figure C-2. PCA (Predicted). ... 207
Figure C-3. PCA (Threshold). ... 207
Figure D-1. Lifecycle Performance (On-Demand). ... 209
Figure D-2. Lifecycle Performance (Predicted). ... 209
L
IST OFT
ABLESTable 4-1. ConOps Innovation in the DSN. ... 48
Table 6-1. Reference λ-Set (Case Study 1). ... 71
Table 6-2. Operationally Driven and Operationally and Environmentally Driven System Output Comparison. ... 81
Table 6-3. Contrail Tax Study (λ-Sets). ... 82
Table 7-1. Stakeholder λ-Sets (Case Study 2). ... 101
Table 7-2. Cost of Noise Explanation. ... 102
Table 8-1. SET Design Structure Matrix. ... 133
L
IST OFA
CRONYMS AC ADS_GNS ATC BOS Comm_CS_C&DH ConOps CFIT CBA CER cdf DARPA DNL dB(A) DSN DoD DoE D FAA FL GPS ICAO ILS INM JFK LAX MCA NPIM O ppm PCA pdf RNAV RNP RWY SET SLCC System F6 TRL ToS TWAP VM VARG AircraftAttitude Determination System and Guidance Navigation System Air Traffic Control
Boston-Logan International Airport
Communication, Command & Data Handling, and Computer System Concept of Operations
Controlled Flight Into Terrain Cost-Benefit Analysis
Cost Estimating Relationship Cumulative Density Function
Defense Advanced Research Projects Agency Day-Night Average Noise Level, A-weighted scale Decibels on the A-weighted scale
Deep Space Network Department of Defense Design of Experiment Destination (airport)
Federal Aviation Administration Flight Level
Global Positioning System
International Civil Aviation Organization Instrument Landing System (Procedure) Integrated Noise Model – FAA Software John. F. Kennedy International Airport Los Angeles International Airport Monte Carlo Analysis
Noise and Performance Impact Model Origin (airport)
Pixels per Meter
Principal Component Analysis Probability Density Function Required Area Navigation
Required Navigation Performance Runway
Spacecraft Evaluation Tool Stochastic Lifecycle Cost
(DARPA) System Future, Fast, Flexible, Fractionated, Free-Flying (Program) Technology Readiness Level
Time-of-Service
Time-Weighted Average Performance Valuation Method
20
21
N
OMENCLATURE ALPHABET SYMBOLS!
c
= innovation timeline constant, years (yrs)!
CO2 = Carbon Dioxide, kilograms (kg) or metric tons (mt)
!
COps = cost of flight path, United States Dollars
!
dtrack = ground track distance, nautical miles (nm)
!
FT
= flight time, hours (hrs)!
FB
= fuel burn, gallons (gals) or pounds (lbs)!
NOx = mono-Nitrogen Oxides NO and NO2, kilograms (kg) or metric tons (mt)
!
PopDNL"65dB = DNL population noise exposure, number of people exposed (ppl)
!
PopTA 60dB = Time-above 60 dB population noise exposure, number of people exposed (ppl)
!
Pj
"
= preference structure for the jth stakeholder, varies
!
r
= discount (inflation) rate, dimensionless!
R
= resolution, pixels per meter (ppm)!
s
= performance gain from innovation, varies!
S
= innovation profile, performance gain with respect to time!
t = time, years (yrs)
!
Thru
= aircraft throughput, aircraft per hour (AC/hr) or total aircraft (AC) per day!
Tw = time window, years (yrs)
!
u
= single attribute utility, dimensionless!
U
" = multiple attribute utility, dimensionless!
U
" = external factors, varies!
Vj
"
= value proposition for the jth stakeholder, varies
!
Vj
* "
= optimal value proposition for the jth stakeholder, varies
!
Yi = ith system output, varies
!
Y" = set of system outputs, varies
Y*
"
22
© 2012 Massachusetts Institute of Technology. All rights reserved. !
X
"
= set of proposed system changes, varies GREEK SYMBOLS
!
"
#= set of preference weightings, varies
!
"i = ith preference weighting, varies
!
1.
R
ESEARCHM
OTIVATION ANDO
BJECTIVESThere are important tradeoffs that need to be considered for the design and operation of aerospace systems. Tradeoffs specifically arise when a improving a given system objective requires the compromise of at least one other objective, and a tradeoff hyperspace is created when three or more tradeoff dimensions (i.e., competing objectives) exist for a system. A notional tradeoff hyperspace is shown in Figure 1-1, which depicts multiple tradeoff dimensions for a generic system where each objective becomes a potential tradeoff with the other objectives for the system. A specific example of a tradeoff hyperspace is shown in Figure 1-2, which corresponds to the operation of an aircraft where environmental objectives such as emissions and contrails are considered along with “traditional” objectives such as performance, safety, and cost.
In addition to a tradeoff hyperspace, there may also be multiple stakeholders of interest to a system that will each have preferences as to the balance amongst the tradeoffs in the hyperspace. Exacerbating the difficulty of resolving a tradeoff hyperspace consequently arises if stakeholders have different preferences as to the balance amongst the tradeoffs under consideration. A simple example of this is shown in Figure 1-3, which shows the tradeoff between two arbitrary objectives where the two stakeholders of interest have different preferred balances of these tradeoffs along the line of feasible first and second objective values. Therefore, in
summary, understanding and analyzing tradeoff hyperspaces is complicated and thus an approach is needed to achieve this that also accounts for stakeholders and their preferences. This observation leads to the two objectives of this research as summarized hereafter.
Objective1 Objective2 Objective3 Objective4 Objectiven Emissions Contrails Safety Performance Cost Objective2 Objective1 Stakeholder2 Stakeholder1
Figure 1-1. A Notional Tradeoff Hyperspace.
Figure 1-2. A Tradeoff Hyperspace for an Aircraft.
Figure 1-3. Competing Stakeholder Preferences in a
24
© 2012 Massachusetts Institute of Technology. All rights reserved.
RESEARCH OBJECTIVES
1. Develop a framework to analyze tradeoff hyperspaces
The first objective of this research is to identify key components for analyzing and articulating tradeoff hyperspaces and to organize these components into a coherent, usable framework. The framework development will be structured such that it is generalizable and can therefore be used to analyze tradeoff hyperspaces corresponding to the design and/or operation of many systems of interest. The resulting framework from this research used to analyze tradeoff hyperspaces is called the Tradeoff Analysis Framework.
2. Account for the preferences from multiple stakeholders
The second objective of this research is to account for the preferences of multiple stakeholders. These preferences are ultimately intended to provide a mechanism to structure and quantify the respective desirability of the stakeholders as to the balance amongst the system tradeoffs of interest. In the context of the tradeoff hyperspace in Figure 1-3, these preferences effectively become a means for stakeholders to negotiate with each other as to best balance amongst the system objectives, where each stakeholder may have unique preferences as to this balance.
In order to evaluate the applicability of the Tradeoff Analysis Framework, it will be used to analyze several relevant tradeoff problems in the aerospace field. This exercise serves as validation of the Tradeoff Analysis Framework and provides the necessary insights to reflect on the framework development and overall utility. The particular applications of the framework are purposefully scoped to assess tradeoff hyperspaces associated with changes in aerospace system design and/or operation, thereby providing a common source of motivation amongst the applications. Here, changes in system design and operation are considered to be any departures from the current, or existing design and operation of a system and thus may be interpreted as innovation in a system, depending on the context. The case studies sequentially grow in complexity in terms of the applying the framework as well as the type and magnitude changes, or innovation analyzed with the framework.
2. L
ITERATURE REVIEW–
T
RADEOFFA
NALYSISF
RAMEWORKSThere is a class of frameworks offered in the literature that might be used to analyze the tradeoff hyperspaces associated with engineering systems. This class of frameworks is referred to as the multi-stakeholder, tradeoff analysis framework class. In order to provide context as to when frameworks belonging to this class may be of use, the first part of this section is used to position them within the systems engineering process. This discussion is then followed by a further discussion this framework class with specific examples.
Context – Systems Engineering Frameworks
2.1.
Systems engineering frameworks are useful for positioning where the multi-stakeholder, tradeoff analysis class of frameworks may be of use in the engineering design and execution process. Systems engineering frameworks implicitly adopt a lifecycle, or beginning-to-end perspective of a system. Subsequently, these frameworks tend to be holistic and focus more on the key activities involved in developing, manufacturing, testing, deploying, and operating a system than on specific methods for executing these steps of the systems engineering process. One of the more common lifecycle or systems engineering frameworks is the V-Model framework and this is used to provide context as to where the multi-stakeholder, tradeoff analysis frameworks discussed in Section 2.2 may be of use.
The V-Model 2.1.1.
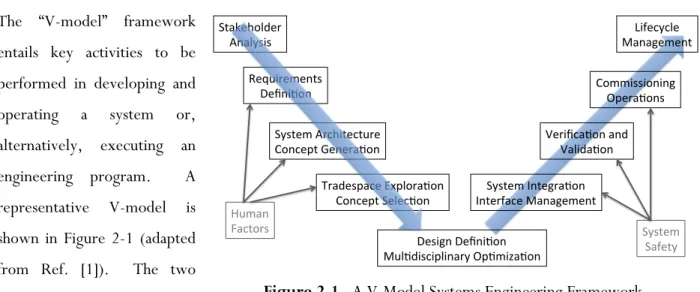
The “V-model” framework entails key activities to be performed in developing and operating a system or, alternatively, executing an engineering program. A representative V-model is shown in Figure 2-1 (adapted from Ref. [1]). The two components of the V-model
are the system, or program definition (the downward arrow in Figure 2-1) and then the system integration, testing, and operation (the upward arrow in Figure 2-1). The key activities in the system definition include a stakeholder analysis and then, given a set of requirements, exploring the space of potential designs and
!"#$%&'()%*++ ,-#(./0/+ 1%230*%4%-"/+ 5%6-07'-+ !./"%4+,*8&0"%8"3*%+ 9'-8%:"+;%-%*#7'-+ <*#)%/:#8%+=>:('*#7'-+ 9'-8%:"+!%(%87'-+ 5%/0?-+5%6-07'-+ @3(7)0/80:(0-#*.+A:740B#7'-+ !./"%4+C-"%?*#7'-+ C-"%*D#8%+@#-#?%4%-"+ E%*068#7'-+#-)+ E#(0)#7'-+ 9'440//0'-0-?+ A:%*#7'-/+ F0D%8.8(%++ @#-#?%4%-"+ G34#-++ H#8"'*/+ !./"%4+ !#D%".+ Figure 2-1. A V-Model Systems Engineering Framework.
26
© 2012 Massachusetts Institute of Technology. All rights reserved.
evaluating which designs are the most valuable. The outcome of the system definition process is a system to be manufactured, integrated, tested, and then operated. These activities collectively form the upward part of the V-model, which ends with the lifecycle management of the system.
In the V-Model process, the key activities associated with the system definition process are where the multi-stakeholder, tradeoff analysis frameworks discussed in Section 2.2 may be of most use, although this does not preclude their usefulness elsewhere in the V-Model. In particular, it is during these activities when the relevant stakeholders for the system of interest are identified and their needs are captured, which are then used to derive the requirements, or important objectives for the system. Since there are often multiple objectives, there may be tradeoffs amongst these objectives, thus requiring the use of multi-stakeholder, tradeoff analysis frameworks to explore potential concepts given these criteria. The multi-stakeholder aspect of these frameworks ultimately become of use when there are several stakeholders of interest, each with different preferences as to balance of these tradeoffs.
Multi-Stakeholder, Tradeoff Analysis Frameworks
2.2.
Multi-stakeholder, tradeoff analysis frameworks can be used to analyze systems based on multiple criteria, or tradeoffs dimensions. In addition, these frameworks address competing stakeholder preferences as to the balance of tradeoffs under consideration, in at least some capacity. The common goal of multi-stakeholder, tradeoff analysis frameworks is therefore develop mechanisms for effectively resolving multiple criteria to rank a given set of system concepts (alternatives) in order to select the best, or most desirable option in the context of stakeholder preferences, or value. These frameworks are often developed such that they either specific to particular system and/or methods for analyzing tradeoff hyperspaces, or are generalizable to any methods and analysis. Several examples of multi-stakeholder, tradeoff analysis frameworks are provided hereafter.
Decision-based Design Framework 2.2.1.
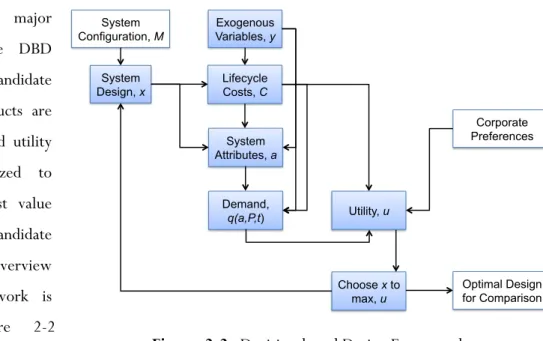
The decision-based design (DBD) framework was developed by Hazelrigg and it evaluates engineering products, that is, tangible systems or objects that have a corresponding market and ensuing demand and supply such that revenue is generated from the product given a sell price, P [2]. The DBD framework therefore implicitly considers the tradeoffs associated with engineering products along with including the relevant needs of the product developers, manufacturers, and customer market. The DBD framework was specifically founded upon the rationale that the design with the highest expected value is the preferred
design. The major characteristic of the DBD framework is that candidate alternatives, or products are ranked using expected utility and therein optimized to determine the highest value alternative, or candidate product [3,4]. An overview of the DBF framework is provided in Figure 2-2 (adapted from Ref. [2]).
As seen in Figure 2-2, the inputs to the framework are the system configuration (e.g., a product) along with the exogenous variables, which influence the system and, within the DBD framework, are prescribed as random variables characterized by either discrete or continuous probability distributions. In addition to these inputs, corporate, or stakeholder preferences are also input to the framework and these ultimately account for the needs of the customers for the system, or product of interest as well as that of the product developers and manufacturers. Given these inputs, the core of the framework is executed, which leads to the determination of the lifecycle costs of the system, the attributes of the system, and the demand for the system. The attributes of the system may characterize the multiple tradeoff dimensions of interest for the system and the demand for the system is ultimately dependent on the attributes, the price of the system, and time1. Given the lifecycle costs, corporate preferences, and demand, the utility of the system is then
computed, therein forming the key input to the value-optimizer in the framework. The optimizer specifically chooses the system design, or configuration that maximizes the expected utility. The output of this, or more generally the DBD framework is the value-optimal design for future comparison.
Multi-Attribute Tradespace Exploration Framework 2.2.2.
The Multi-attribute Tradespace Exploration (MATE) framework was developed by Diller and Ross and can be used to explore a number of designs, or configurations and then to evaluate those designs in a utility-cost
1 In the DBD framework, the price for the system is chosen to maximize the expected utility of the system, given the corporate
preferences. System Configuration, M System Design, x Optimal Design for Comparison Exogenous Variables, y Lifecycle Costs, C System Attributes, a Utility, u Demand, q(a,P,t) Corporate Preferences Choose x to max, u
28
© 2012 Massachusetts Institute of Technology. All rights reserved.
space [5,6]. Here, utility aggregates the attributes, or tradeoff dimensions of interest for a given design that are beneficial to the relevant stakeholders and positions them relative to the cost(s) of the design, therein positioning the value of the design as benefit versus cost. Analogous to the DBD framework, the implicit rationale adopted in MATE is that the designs with the higher expected value are preferred over those designs with the lesser expected value. While the core MATE process is discussed hereafter, the original MATE process was intended for use with integrated concurrent engineering (ICE) to facilitate the design and ensuing decision-making process in team-based working environments with multiple tradeoff dimensions and stakeholders of interest. It is also relevant to note that MATE was first developed in 2002 and since then a number of adaptations of the MATE process have been developed and applied and these include: MATE for Changeability (Dynamic MATE) [7]; MATE for Systems-of-Systems [8,9]; MATE for Flexibility [10,11]; and MATE for Survivability [12]. A corresponding overview of the core of the MATE process and thereby any subsequent version of MATE is provided in Figure 2-3 (adapted from Ref. [6]).
As seen in Figure 2-3, the core of the MATE process is iterative and it involves several key activities. The first activity is the stakeholder need identification process where the specific desires or preferences of the relevant stakeholders are determined and ultimately used to evaluate the candidate designs. The second activity is the architecture solution
exploration. This activity involves defining the candidate designs to be analyzed, often by characterizing each design through a vector of variables and then modeling each candidate design vector. In order to ultimately evaluate and compare designs, the model must assign the corresponding attribute values to each design vector so that it can be mapped to a utility-cost space, where the attributes of interest are identified through the needs of the stakeholders. After this is complete, the utility-cost space consisting of several, or
Need Identification
Architecture
Exploration Architecture Evaluation
Design
Evaluations Exploration Design
Identify, Need, Mission, Scope Define Design Space and Preference Space
Model System
Simulate System
Analyze System
Select Reduced Solution Space Concurrent Design Architecture Exploration Need Identification Architecture Evaluation Solution Exploration Design Evaluation System Design(s)
many, candidate designs can be explored and evaluated by the relevant stakeholders, leading to the selection of the most stakeholder-desirable system design(s).
Change Propagation Analysis Frameworks 2.2.3.
Change propagation analysis (CPA) frameworks include methods for tracking changes in often-complex systems with the goal of ultimately evaluating the impact of a potential change in a system [13–15]. Here, the impact may implicitly contain multiple attributes, or system objective tradeoffs based on stakeholder input just as is the case with the DBD and MATE frameworks. The commonality of change propagation frameworks is their reliance on Design Structure Matrices (DSM’s) in order to characterize the interdependencies of a system’s components and/or information flows (refer to Ref. [16] for a description of DSM’s). Through characterizing a system in a DSM, changes in the system can be identified, tracked, and quantified, forming the basis for deriving measures of the type and magnitude of change in a system. For example, Griffin et al. assume the change in the density of a DSM is a proxy for the magnitude of change in a system and correspondingly offer the Change Propagation Index (CPI) metric for determining the level of change in a system, which is shown in Equation 1.
Equation 1
!
CPI
i= "E
out,i# "E
in.iIn Equation 1, CPI compares the binary entries in a DSM, which are characterized by the variable E, and determines whether or not the ith element in a DSM has changed because of any other element in the DSM. The CPI metric is then specifically the difference in change in the ith element from in the feed-forward (E
in) and feedback (Eout) portions of the DSM. In addition to deriving metrics such as CPI, the DSM characterization also enables CPA methods to be extended, for example, to evaluate the corresponding risk introduced in a system from change.
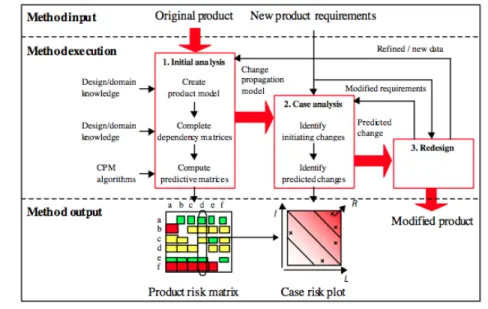
While there are several unique versions of CPA frameworks, the Change Prediction Method (CPM) from Clarkson et al. shown in Figure 2-4 is discussed as a representative example of such frameworks (image source: Ref. [13]). Clarkson’s CPM framework can be parsed into three components: method inputs, method execution, and method outputs. The required inputs to this method are the product, or system of to be analyzed as well as any new product requirements, which lead to required changes in the product. Given these inputs, the CPM core execution activities include the initial analysis, where a model of the product and its respective subsystems is created, characterizing a product by a DSM, and computing predictive matrices, which lead to the creation of a product risk matrix. The second core activity in the
30
© 2012 Massachusetts Institute of Technology. All rights reserved.
CPM is the case analysis
where new product
requirements lead to required changes in the system, which are then combined with the product risk matrix to formulate the case risk plot. This plot ultimately depicts each subsystem in terms of the likelihood and impact of change in a subsystem on the overall risk of the system.
Recall that this impact may consist of multiple system objectives based on stakeholder input to the CPM process. The information provided from the case risk plot can then be used to redesign the system to mitigate the identified sources of risk in a system.
Hazard and Risk Analysis Frameworks 2.2.4.
Hazards lead to potential risk in engineering systems and thus an important aspect of evaluating engineering systems is to analyze these potential sources of risk, if they are to be safe and successful in operation. Hazard and risk analysis frameworks specifically address this through evaluating how design decisions affect the reliability or risk imposed by a system, where there may be different sources of risk such as that arising from the reliability of system hardware or potential operator error. Benefits from applying hazard and risk analysis frameworks and methods may include, for example, exposing single point failure modes in a subsystem assumed to be redundant and therein identifying opportunities for mitigating risk through functional redundancy. Most hazard and risk analysis frameworks are meant to analyze a system in order to mitigate residual risks in that system before it is fielded and two common hazard and risk analysis frameworks are Failure Modes, Effect, and Critical Analysis (FMECA) [17] and Systems-Theoretic Accident Modeling and Process (STAMP) Hazard Analysis [18]. The hazard and risk framework discussed hereafter is
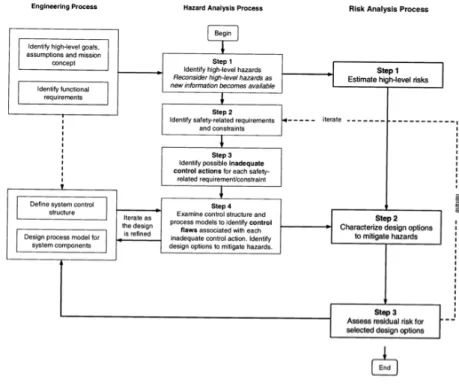
suggested as an improvement upon the STAMP hazard analysis and was developed by Marais [19]. This framework is shown in Figure 2-5 (image source: Ref. [19]).
Marais’s hazard and risk analysis framework focuses on identifying the impact of organizational factors on risk and provides several benefits including the early identification of risk, determining the most valuable allocation of resources to mitigate risk, and provides an ability to continuously monitor risk. And within Marais’s framework, stakeholder input and the existence tradeoffs in the risk
domain are important considerations. The first two components of Marais’s framework, the engineering process and hazard analysis process, are the STAMP hazard analysis method. Within this method, the engineering process is specifically responsible for developing the underpinning of the system of interest such that it can be analyzed in order to identify potential sources of risk. The hazard analysis then involves executing four steps: (1) identify high-level hazards; (2) identify safety-related requirements and constraints; (3) identify possible inadequate control actions for each safety requirement; and (4) identify control flaws. Marais’s framework extends these two aspects of the STAMP hazard analysis with a third component: risk analysis. The risk analysis is specifically responsible for estimating the high-level risks given the identified hazards in a system, developing design options or adaptations to mitigate these hazards, and then assessing the residual risk for the design options considered. From the output of the risk analysis, the design option that best mitigates potential risk in the system of interest can be determined.
Multi-Actor, Multi-Criteria Analysis Frameworks 2.2.5.
Multi-actor, multi-criteria analysis (MAMCA) frameworks are another type of framework that can be used to analyze the tradeoff hyperspaces associated with the design and operation of a system while considering the needs and preferences of multiple stakeholders. MAMCA frameworks tend to be the broadest and most generally applicable for analyzing systems since they are often not overly specific to a particular system, or
32
© 2012 Massachusetts Institute of Technology. All rights reserved.
method of interest. MAMCA frameworks specifically consider the preferences of multiple stakeholders in order to develop a set of criteria to evaluate candidate system designs or configurations. One example of a MAMCA framework is that developed by Macharis et al., which is shown in Figure 2-6 and used as a representative example of such frameworks [20].
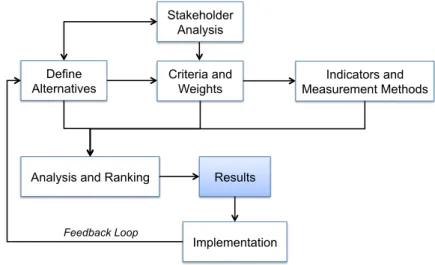
Macharis’s MAMCA framework begins with a stakeholder analysis. This analysis is used to identify the relevant stakeholders given the system of interest and then to use their needs as the criteria basis for evaluating a set of system design alternatives. Depending on the formulation of criteria used, this may include weighting the criteria in a relativistic sense in order to establish a ranked ordering of the most to least important criterion. Following this, the criteria from multiple stakeholders is used to develop indicators and measurement methods that use the (weighted) criteria from the various stakeholders to ultimately evaluate alternative system designs or configurations. This step of the process may implicitly involve selecting the best set of stakeholder criteria for inclusion in the analysis. Following the analysis of the systems, they can be ranked in terms of the stakeholder-derived criteria. Once this is complete, the results, in terms of the preferred system design for each stakeholder, can be compared. The remaining step in the method is then implementation, which is the process of using the framework iteratively in order to refine stakeholder preferences with the goal of having the stakeholders reach some consensus about the best system design or configuration.
Negotiations 2.2.6.
Given a tradeoff hyperspace for a system, negotiations can be useful for facilitating consensus amongst stakeholders if there are competing preferences as to the balance of tradeoffs amongst the stakeholders. There are many, formal negotiation approaches to facilitate alignment and this is discussed in additional detail in Section 4.3.4. However, to provide an example of such an approach, Game Theory is briefly explored hereafter. Game theory is a theoretical framework for characterizing and predicting the outcome of games created by a group of players, when rationality is assumed, that is, more value offered by a system
Define Alternatives Stakeholder Analysis Criteria and Weights Indicators and Measurement Methods
Analysis and Ranking Results
Implementation
Feedback Loop
is more desirable to stakeholders. Game Theory was originally developed John von Neumann and greatly complemented by John Nash [4,21–23]. One extension of Game Theory developed by Nash led to Nash Bargaining, which is a theory based on the non-cooperative theory ofgames and bargaining models. This theory may subsequently be of use to resolve competing stakeholder preferences as to best balance of tradeoffs in a given hyperspace. The bargaining model relies on a preference and payoffstructure for each stakeholder (e.g., some value function such as expected utility), which truncates the various tradeoff dimensions of interest to a single metric, or value. The ensuing suggested optimum, or Nash Bargaining Solution is themost efficient point in the tradespace for maximizing the aggregate value of the stakeholders, which happens to be the tangent to any location on the
Pareto Front of value corresponding to acceptable set of agreeable solutions amongst the stakeholders of interest. A simple two-dimensional example of this is conceptually depicted in Figure 2-7 where the Nash Bargaining solution is on the Pareto front of value between two arbitrary stakeholders, Stakeholders A and B, given their respective valuation of the tradeoff dimensions of interest. Any point on the Pareto Frontier would suffice, hence the negotiation aspect of this Game Theoretic approach for facilitating multi-stakeholder negotiations.
Observations from the Literature
2.3.
The frameworks for evaluating engineering systems cited in the literature all have the common goal of determining the best, or most valuable system design or configuration given a set of criteria derived from stakeholder needs and preferences. In the context of the motivation of this research, the criteria evaluated with these frameworks might be implied to include the relevant tradeoffs (or tradeoff hyperspaces) for the system of interest. In reflecting on the types of frameworks examined in the literature, the systems engineering frameworks are the most holistic in terms of the beginning to end process of designing, developing, and operating a system. Subsequently, the multi-stakeholder, tradeoff analysis class of frameworks mentioned in the literature may be applicable at various stages of the process prescribed by systems engineering frameworks. In terms of general applicability, the multi-stakeholder, tradeoff analysis frameworks that are tailored to a given set of methods or investigation focus of interest, which includes the
B
A
StakeholderB Value Nash Bargaining Solution Agreement Set Status Quo StakeholderA Value Figure 2-7. Nash Bargaining.34
© 2012 Massachusetts Institute of Technology. All rights reserved.
DBD, MATE, CPA, and Hazard and Risk Analysis Frameworks in Sections 2.2.1 - 2.2.4, will likely have a more limited scope of applicability than the MAMCA framework. For a specific example of this consider the DBD framework (Section 2.2.1), which optimizes a system based on expected utility. Therefore the users of the framework are to conform to this methodological prescription for evaluating engineering systems, which may not be less appropriate than some other, better evaluation approach or method. Thus, while these tailored frameworks are of great value for their intended applications, one potential limitation of these frameworks is the breadth of their applicability as result of the overly specific methods or approaches prescribed by these frameworks. The MAMCA framework discussed in Section 2.2.5 does not inherently contain this limitation since this approach is purposefully general to any system of interest and the ensuing methods and criteria used to evaluate the system.
3. L
ITERATURE REVIEW–
I
NNOVATIONA
SSESSMENTF
RAMEWORKSThe applicability of the Tradeoff Analysis Framework developed in this research to analyze tradeoff hyperspaces in the context of stakeholder value is evaluated through several case studies (see Sections 6-8). In these case studies, the framework is specifically used to evaluate the impact, or tradeoffs associated with change, or innovation in aerospace systems, depending on the case study context. Therefore, given this scoped application of the Tradeoff Analysis Framework, it is relevant to mention some related approaches in the aerospace literature offered for evaluating the impact of changes, specifically innovation in aerospace system design and operation, which is the subject of this section.
Overview
3.1.
There have been numerous, formal approaches offered in the aerospace literature for analyzing the tradeoffs associated with aerospace systems. Of particular interest to evaluating the applicability of the Tradeoff Analysis Framework developed in this research are those works that develop formal approaches for assessing how changes in the design and/or operation of a system impact its potential value delivery to the relevant stakeholders. Here, changes in system design and operation are considered to be any departures from the current, or existing design and operation of a system and thus may be interpreted as innovation in a system, depending on the context. The resulting relevant literature therefore draws from four different fields: Decision Analysis, Technology Forecasting and Management, Space Systems, and Aircraft Systems (see Figure 3-1). The space and aircraft systems fields are important because these form the basis for the specific systems eventually analyzed to evaluate the applicability of the framework in the case studies; the relevant literature belonging to these domains is presented in the case studies considered in this research (see Sections 6-8). The decision analysis
literature is presented in Section 4.3.2- 4.3.4 and it deals with research on methods for resolving tradeoff hyperspaces, as they are defined in Section 1, and resolving competing preferences amongst multiple stakeholders. And the technology forecasting and management literature is used to identify and structure the
Technology Forecasting and Management
Space Systems Aircraft Systems
Frameworks for Evaluating Innovation in Aerospace Systems Decision Analysis
36
© 2012 Massachusetts Institute of Technology. All rights reserved.
type and magnitude of proposed changes to the design and/or operation of a system before it is analyzed with a given framework or approach; this literature is discussed in Section 4.2. As shown in Figure 3-1, the confluence of these four literature fields is the development and application of frameworks to analyze tradeoff hyperspaces associated with change, or innovation in aerospace system design and operation, while considering multiple stakeholders of interest. The scope of the following literature review is therefore research that contributes to this confluence of research fields, namely, “Frameworks for Evaluating Innovation in Aerospace Systems.”
Literature
3.2.
Several sources from the aerospace domain are used as examples of the formal approaches or methods contributed to the confluence of research fields shown in Figure 3-1. The commonality of these works is their emphasis, in varying capacities, on evaluating the tradeoffs associated with innovation in aerospace system design and operation, depending on the context. This literature scoping was specifically chosen since the applicability of the framework developed in this research will be evaluated by analyzing the tradeoffs associated with change, or innovation in systems. The relevant, formal approaches in the literature are briefly discussed hereafter.
1. Technology Metric Assessment and Tracking (TMAT) Process [24]. The TMAT process is used to evaluate the tradeoffs associated with inserting new technologies in systems and the five major steps of the TMAT process include:
1. Technology metric (i.e., measure of success) identification 2. Technology audit scheme definition and
information gathering, which collects data regarding the expected impact of new technology and probability of achieving that impact
3. Technology metrics assessment, which maps the information obtained in Step 2 to quantifiable metric forms
4. Technology metrics integration, which quantifies the impact of technology via the metrics
5. Technology metrics sensitivity analysis, which
quantifies the change in impact due to any modeling assumptions.
Figure 3-2. TMAT Process for Tracking Technology Impacts.
The TMAT process is notionally a linear, feed-forward approach and the result of applying TMAT process is a model of technology impacts over time as shown in Figure 3-2 (Image source: Ref. [24]). In Figure 3-2, the x- and y- axes are time and technology improvement, respectively. Despites its linearity, the innovation profile in Figure 3-2 has probability distributions along it that define confidence regions in technology improvement over time.
2. Cardinal Technology Readiness Scale Valuation [25]. This approach to analyzing systems simply maps the impact of innovation in system design and/or operation to a continuous Technology Readiness Level (TRL) scale, thereby providing technology readiness levels for all integer and non-integer TRL values between 1 and 9. The resulting continuous TRL scale can be used to identify the risk and readiness of new technologies to a more granular degree, which may be of value when the changes to a system are similarly granular.
3. Internet-Accessible Technology Risk Assessment Collaborative System (ITRACS) and Framework for Advanced Systems Tradeoffs using Probabilistic Analysis of Concepts and Technologies (FASTPACT) [26]. The FASTPACT approach is used to quantify the impact of new technology (or technology portfolios) on a program’s figures of merit based on information from applying ITRACS, which solicits expert opinions on the probability of technology performance success. This approach can therefore account for multiple stakeholders and their respective value through the figures of merit. This method was applied to NASA’s Next Generation Launch Technology project in Ref. [26].
4. Technology Performance Risk Index (TPRI) [27]. TPRI tracks technology readiness throughout a lifecycle and is comparable to the TRL scale and can thus be used to analyze the impact of innovation in a system’s design and/or operation. TPRI specifically achieves this by determining how well a technology is meeting its performance requirements and, if not, this determines a performance risk in a system due to the technology. This approach was applied to a generic weapon system in Ref. [27].
38
© 2012 Massachusetts Institute of Technology. All rights reserved.
5. Developmental Maturity Index (DMI) [28]. The DMI is suggested as being an improvement to the TRL scale for capturing technology maturity and therein the impact of changes, or innovation in a system’s design and/or operation. The DMI is quantified through a two-step process with an emphasis on maintaining continuity throughout the process. The two steps used to quantify the DMI for a given system are:
1. Technology maturity evaluation
2. Evaluation of the reduction in risk imposed by new technology
6. Failure Modes, Effect, and Critical Analysis (FMECA) [17]. FMECA is a structured approach that provides valuable insights as to how design decisions affect reliability, for example, the downstream impacts of innovation on a system’s respective reliability. Benefits of applying FMECA may include: exposing single point failure modes in a subsystem assumed to be redundant; identifying opportunities for functional redundancy; and permitting components to assume a safe mode in the absence of required signals or power. There are numerous versions of the FMECA approach but they all have the common objective of identifying sources of risk in a system as the result of changes in that system. For example, in Ref. [17] FMECA was applied to the Space Test Program, specifically to minimize the risk of inserting new technology in military or civil space missions.
7. k-σ Technology Risk Model
In addition to the previously mentioned approaches that can be used to assess the impact of innovation in systems, there is a body of work with the common objective of assessing reliability improvements in initially immature technologies over time, either holding technology performance constant, or allowing it to vary. These studies specifically build their respective approaches using probabilistic technology readiness (e.g., TRL) distributions for subsystems and payload technologies to capture the impact of increases in technology maturity, and potentially performance, over time. Given their focus, the changing parameter is often the reliability (or probability) at which the desired performance is achieved with a given technology [29–36]. Many of these works use the k-σ
Technology Risk Model to generate distributions of technology performance gains and losses as a function of the technology’s TRL; a good example of one of these distributions can be found in Ref. [30] and is shown in Figure 3-3. These distributions assume that performance probabilistically
degrades with TRL and are subsequently generated from Weibull distributions dependent on a “k” Factor, which is a variable reflecting the potential performance loss and gain of a technology determined from expert interviews. An example of one of these distributions is shown in Figure 3-3 (Image source: Ref. [30]). Figure 3-3 shows probability density functions corresponding to some arbitrary k-factor
(in this case lower k-factor values are more desirable). Each TRL has a dedicated density function and, intuitively, as TRL increases, the probability of realizing a lower k-factor also increases; this establishes the increasing compression and leftward shift of the TRL distributions seen in Figure 3-3.
Certain works using the k-σ Technology Risk Model select the optimal technology (or technology
portfolio) to pursue using a heuristic optimizer to balance performance gains with technology risk due to increasing innovation [30–33], and one of these works does so while also allowing the type of technologies available to change over time [35]. For those works using the K-σ Technology Risk
Model that assume technology performance is constant, an implicit assumption is therefore that the desired level of technology performance is always available and that the innovation of that technology is only manifested through continuously reducing the risk of that technology (in time).
Tradeoff Analysis Framework Motivation
3.3.
The previously discussed literature provides a variety of approaches and methods for analyzing aerospace systems, with an emphasis on evaluating the impact of innovation in system design and operation. One observation from this literature is that with the exception of the FASTPACT approach, the approaches offered all focus on one metric, or objective to capture the result of a proposed change to the system of interest, thereby ignoring the existence of potential and relevant tradeoff hyperspaces for the system. Furthermore, the approaches do not explicitly consider and thereby provide formal provisions for accounting for the relevant stakeholders of interest to the system under consideration, which may be
Figure 3-3. K-σ Technology Readiness Distribution.
40
© 2012 Massachusetts Institute of Technology. All rights reserved.
important to the overall evaluation of the system. Lastly, the approaches offered adopt a singular emphasis on evaluating the impact of performance and reliability improvements in technology or operational changes to a system and, in many cases, the approaches are tailored to the system of interest. The major drawback from this latter observation is an immediate constraint on the breadth of applicability of the approaches offered in the literature if they are overly specific to a system. These observations from the relevant literature do not negate the utility of the frameworks offered therein, but motivate the need for a broadened framework to analyze the tradeoff hyperspaces associated with changes, or innovation in system design and operation that adopts a system-agnostic and macroscopic view of the tradeoff assessment problem.
4.
T
RADEOFFA
NALYSISF
RAMEWORKIn order to address the first objective of the research, the Tradeoff Analysis Framework was developed, which is capable of analyzing the tradeoff hyperspaces associated with the design and operation of systems. Three versions of the Tradeoff Analysis Framework will first be discussed, the: Baseline Framework, Framework with Multiple Stakeholders, and the Framework with Optimization. The majority of this section is then devoted to discussing specific elements of the framework in more detail along with potential opportunities to further mature the framework development and thereby increase its utility.
Tradeoff Analysis Framework Overview
4.1.
This section presents the three versions of the Tradeoff Analysis Framework. Baseline Framework
4.1.1.
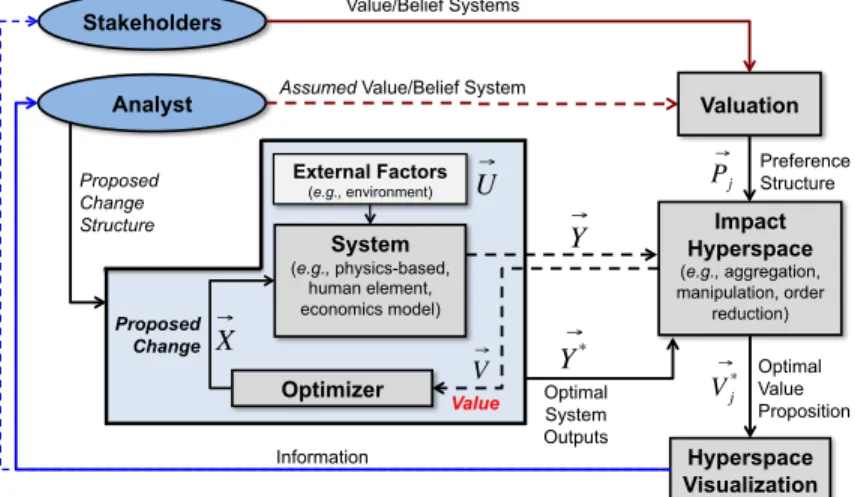
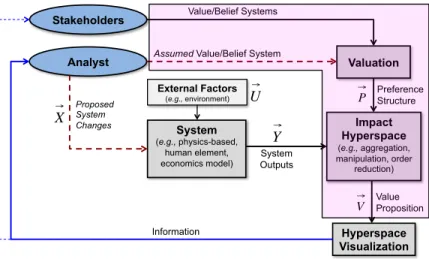
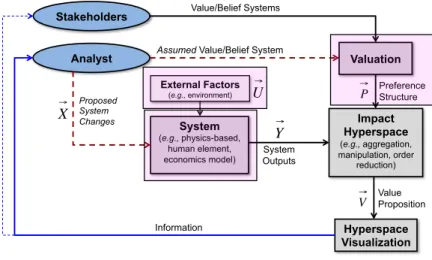
The first version of the Tradeoff Analysis Framework is the Baseline Framework, which is shown in Figure 4-1. As seen in the figure, in the Baseline Framework, the analyst is the user of the framework, and at the core of the framework is the system, which is often a representation of the system of interest (e.g., a model). The system
operates in a specific context, which is characterized by the external factors, U. The system outputs, Y, are the tradeoff dimensions of interest and when influenced by a proposed change to the system, X, they characterize the impact of the system. These tradeoff dimensions ultimately constitute the tradeoff hyperspace to be analyzed with the framework. The system outputs are inputs to the impact hyperspace where they may be combined with the preference structure to form the value proposition, which is then conveyed to the
analyst. The analyst has a value or belief system indicative of their perceived importance of the system
outputs, which may change based on new information provided from the hyperspace visualization. The
valuation aspect of the framework formalizes these belief systems into preference structures, P, which, as
previously stated can be combined with the system outputs in the impact hyperspace to generate value propositions, V. These value propositions are then conveyed back to the analyst via the hyperspace
Proposed System Changes
Assumed Value/Belief System
System (e.g., physics-based, human element, economics model) Impact Hyperspace (e.g., aggregation, manipulation, order reduction) Analyst Valuation Hyperspace Visualization System Outputs ! Y" Information External Factors (e.g., environment) Value Proposition ! V " Preference Structure ! P " ! X " ! U"