HAL Id: hal-02740281
https://hal.inrae.fr/hal-02740281
Submitted on 2 Jun 2020HAL is a multi-disciplinary open access archive for the deposit and dissemination of sci-entific research documents, whether they are pub-lished or not. The documents may come from teaching and research institutions in France or abroad, or from public or private research centers.
L’archive ouverte pluridisciplinaire HAL, est destinée au dépôt et à la diffusion de documents scientifiques de niveau recherche, publiés ou non, émanant des établissements d’enseignement et de recherche français ou étrangers, des laboratoires publics ou privés.
How the national prices impact the international
activity? The case of oilive oil market in Spain
Magali Aubert, Federica Demaria, Maria Gutiérrez-Salcedo
To cite this version:
Magali Aubert, Federica Demaria, Maria Gutiérrez-Salcedo. How the national prices impact the inter-national activity? The case of oilive oil market in Spain. 8. Journées de recherches en sciences sociales (JRSS), Institut National de Recherche Agronomique (INRA). UMR Economie Appliquée de Grenoble (1215).; Société Française d’Economie Rurale (SFER). FRA.; Centre de Coopération Internationale en Recherche Agronomique pour le Développement (CIRAD). FRA., Dec 2014, Grenoble, France. 19 p. �hal-02740281�
How the national prices impact the international activity?
The case of olive oil market in Spain
Magali Auberta, Federica DeMariaa, María Gutiérrez-Salcedob
a
INRA UMR MOISA Montpellier (France)
b
Department of Management and Marketing, University of Jaén (Spain)
September 11 2014
Abstract: Olive oil plays an important role in the European Union countries where Spain, Italy and Greece are the main actors. Spain industry knew a flourished period by confirming its own leadership in this sector. Spain is the main olive oil producer and exporter in the world. Starting from this evidence, the main objective of this work is that of analysing the price transmission at the national level to understand in which way this activity has some impact on the international ones. At first we look at the national production and Spanish trade flows, then, we study how the exports and imports affect the consumption, and in which way consumption and production affect exports and imports. Finally, we also consider the effects of European policy intervention in olive oil market.
KEY WORDS: Olive Oil, Price Transmission, Spain, Export, Import, EU policies Jel codes: F14, F68
I. Introduction
In the last two decades, the worldwide consumption of olive oil has followed a rising trend. In particular, since 1991 it has been an 83.41% of increase, according to International Olive Oil Council (IOOC), mainly in Japan (1,175%), United Kingdom (769.12%) or Germany (494.18%). This rise is caused by the rising interest of consumer for introducing this product in their balanced diet, as consequence of extension of Mediterranean diet and the communication of health properties of olive oil.
With the objective to provide its growing demand, olive oil production has been also increased, appearing new producer countries as Chile or Australia. However, the weight of the production is concentrated in Europe.
Olive oil plays an important role in the European Union (EU) countries where Spain, Italy and Greece are the main actors. In the last decades Spain industry knew a flourished period by confirming its own leadership in this particular sector. At this moment, Spain is the main olive oil producer and exporter in the world.
Based on Spanish supremacy in olive oil sector and its influence in the rest of markets at world level, the aim of the paper is analyse the price transmission at the national level to understand in which way this activity has some impact on the international ones. In order to do so, we look at the national production and the trade flows for Spain. By doing so we can see how the exports and imports affects the consumption, conversely, how consumption and production affect exports and imports, and the effects of European policy intervention in olive oil market.
This paper is organised as follows: Sect. 2 presents a briefly overview of the literature. Sect. 3 includes a description of olive oil market structure in the world. Sect. 4 describes data and econometric method. Sect. 5 gives the results obtained in the econometric analysis. Finally, in Sect.6 some conclusions are drawn.
II. Briefly Overview
Before presenting the data on the evolution in terms of production and trade of the olive oil market, we briefly review the current literature. In line with our aim we only focus the review on two different aspects: a) interdependencies between markets and countries; and b) effects of policy interventions.
As regard the first point, in a recent study Emmanouilides et al (2014), assess the degree and the structure of price dependence in Spain, Italy and Greece for two different quality of oil (extra virgin and virgin). In order to analyze the spatial price interrelationship, they use monthly data and a bivariate copulas function. Their results show that in two cases (Spain and Italy) tail dependence is asymmetric; this means that prices are to be expected to exploding together, but not to collapse together. The asymmetric price co-movements imply that the Spain, Italy and Greece cannot be considered as one great pool. Fousekis et al. (2002) investigated the price interdependencies in the South area as well. Even in this study data on extra virgin and virgin wholesale level prices are used over the period 1992-1998. Their investigation emphasized that both a high degree of integration market and market performance exists. Their cointegration analysis put into evidence strong price interdependency in Spain, Italy and Greece. Roland et al. (2013) consider the spatial integration of the EU olive oil market by taking into account the prices of Spain, Italy and Greece from 1961 to 2007. Through multivariate cointegration techniques, they identify short-run and long-run relationships which confirm these three markets are extremely integrated, with a full price transmission in the long run. Their results also prove that, being Spain the main producer, Italy is the leader market in terms of prices.
As regard the effects of policy interventions, Migdalas et al. (2004) consider the effect of a change in EU policy on Cretan olive oil sector. A mathematical problem based on the welfare concept and the simulation of the olive oil market equilibrium is applied. Authors stress the idea that a change in the Common Agricultural Policy (CAP) and improvements in the productions and marketing system may have some effects both on the welfare of the producers and consumers. Results of this study emphasize how production costs are a determining factor in the olive oil sector. In addition, a CAP change focused on the reduction of production aid, or whichever category of subsidies, has an influence in producers and consumers. On the other hand, Larby and Chemsy (2009) use the cointegration model to analyze the export function of Tunisian olive oil to the EU market and understand what the main determinants over the period 1978 – 2008 are. In particular, this study focuses on the policies adopted by the government in 2005 to expand this sector. Their results put into evidence that, in order to improve the competitiveness of the Tunisian olive oil in the world, the behaviour of the Government, in terms of adoption of policies and incentives, may increase national production of
olive oil by encouraging farmers to improve productivity, quality and reducing production costs. In line with the requirements of the EU CAP, some authors focused their research on the region of Andalusia (Spain). For instance, Dios-Palomares and Martínez-Paz (2011) try to assess the production of olive oil in this region, in order to provide some evidence on the level of technical efficiency from a multi-output perspective, by also considering olive oil production in quantitative and qualitative terms. To achieve this goal, authors build environmental and quality indicators, based on three different data sources, and apply the Data Envelopment Analysis (DEA). The main goal of the paper is that of measuring the technical efficiency and assessing improvements on the resources management. Indeed, the results remark that better quality and practices may affect the performance of a firm. The results show a medium-high level of relative technical efficiency and medium-highlight the importance of efficiency factors involving production and marketing associations.
In this first section we have briefly review some of the papers focusing on the possible determinants affecting the olive oil market. After doing this overview we pass to examine the market olive oil structure.
III. The Olive oil market structure in the world
The production structure of the olive oil sector is very complex; it is not constant and varies year by year depending on input factors and climate changes. These two factors have an important impact on price, producer activities and supply.
At global level, the production is concentrated in the Mediterranean area. Spain, Italy and Greece are the main EU country producers (see figure 1), followed by Tunisia, Turkey, Syria and Morocco (Ismea, 2013). However, in the last two decades the production of the olive oil changed its own structure. Indeed, countries that historically did not have any link with olive oil now do it (IOOC 2013). For example, in the last five years USA, Australia, Chile, China and India have appeared as new producers. Nevertheless, even if their presence at international level is low (less than 2% of the world production), they may exercise some influence on the trade policies1.
1
For example, since 2012, USA is considering to apply measures against olive oil imports, in order to improve their own production.
Figure 1. Evolution of the relative importance of Greece, Italy and Spain on world production of olive oil (percentage)
Source: FAO Data.
As previously specified, the EU is the largest world producers (2,395,200 tonnes) and Spain becomes into the leader (1,615,000 tonnes), replacing Italy (294,600 tonnes) (IOOC 2013).
For Spain, olive oil has a strategic role in the agriculture, concentrating more than 60% of the total olives surface in the world and in which produces close to half of olive oil consumed in the world. In the last two decades, Spanish production has an important increase trend caused, mainly, by the improvement of quality and the implementation of new techniques of production (intensive production). As a result, since 1992 the level of production has been increased in 122.11%, meanwhile the Italian production only has been increased in 33.66%.
However, the Spanish consumption not shares the same trend as production. The economic and financial crisis, the introduction of new oils in the market, the consumer preferences for oils cheaper, among others, has as consequence a decrease of olive oil consumption during the last decade (Martínez, et al. 2011).
Due to there is a difference between increased trend production and national consumption, the exportation has been the key strategy for the olive oil companies in the international market. It avoids that an excessive offer cause a price fall in the national market (Moral et al., 2012). The main destiny of Spanish exports is Italy (figure 2). The high percentage is a consequence of an Italian disequilibrium between its production and demand, national and international both. The exports to the rest of
0.00 10.00 20.00 30.00 40.00 50.00 60.00 1961 1963 1965 1967 1969 1971 1973 1975 1977 1979 1981 1983 1985 1987 1989 1991 1993 1995 1997 1999 2001 2003 2005 2007 2009 2011
countries are constant, with a little increase in countries as USA, China or Japan, being these last countries that more have increased their consumption in the last two decades. In this sense, Spain is the main olive oil supplier in the most their exporter countries, with a market share bigger than its second supplier, as it is shown in table 1.
Figure 2. Destiny of Spanish exports (percentage)
Source: Comtrade.
Table 1. Origin of imported olive oil (percentage of total imported olive oil in 2012)
COUNTRY FIRST SUPPLIER SECOND SUPPLIER
Italy Spain (66.06%) Greece (17.91%)
Portugal Spain (94.24%) Morocco (0.47%)
France Spain (62.35%) Italy (26.50%)
USA Italy (50.51%) Spain (26.58%)
United Kingdom Spain (58.70%) Italy (26.52%)
China Spain (62.50%) Italy (19.77%)
Japan Spain (44.10%) Italy (49.52%)
Australia Spain (67.52%) Italy (24.01%)
Brazil Portugal (59.77%) Spain (23.14%)
Source: IOOC and Comtrade.
48.23 9.67 8.59 6.76 4.17 2.23 1.80 2.43 1.79 14.33 41.18 10.93 8.95 8.58 4.44 3.65 2.62 2.45 2.28 14.92 0.00 10.00 20.00 30.00 40.00 50.00 60.00
Italy Portugal France USA United Kingdom
China Japan Australia Brazil Rest
Based on the weight of Spain in olive oil international commerce, is possible to think that its international activity could be influenced by the national activity, and the opposite. For example, world exportations could be influence by Spanish production and prices. If, for different factors (as climate, political, etc.), production is decreased, level of export could be affect and, in this way, world consumption. Equally, Spanish price movements could cause an increase of exports, if the international price is bigger than national price, or the opposite.
In this sense, in next sections we try to understand how price transmission could influence in Spanish market, studying their national and international activities and their interrelationship.
IV. Data & Econometric method
In order to achieve the research objective, in this section we describe the database used in the analysis and the configuration of econometric model, justifying the possible relationship between the variables.
IV.I. Database
The database used was built with four weekly variables related to national and international Spanish activity, for the period from January’06 to December’132
:
Production. Volume of Spanish production of all categories of olive oils in origin market: Extra Virgin, Virgin and Lampante.
Consumption. Spanish home demand of all categories of olive oils in final market: ExtraVirgin, Virgin, Olive oil and Olive-pomace oil.
2 In order to understand variables and different types of olive oil, two different markets should be taking into account in Spanish olive oil sector: 1) origin market, in which producers selling the bulked olive oil to refiners and/or packagers, and 2) final market, in which packagers selling bottled olive oil to final consumer, usually through distributors. In origin market is possible to find three types of olive oils: Extra virgin, Virgin and Lampante. They are olive oils obtained only through mechanical or other physical processes from the fruit of olives trees. Two firsts, are the first-class olive oil directly obtained from the fruit, with an excellent aroma and its acidity is below 0.8º and 2º, respectively. The third type, Lampante, is an olive oil which presents a high acidity level (above 2º) or a defective taste and smell. This olive oil is not suitable for consumption, must therefore undergo a refining process in order to correct said flaws. In second market, final consumers can buy four types of olive oils: Extra Virgin, Virgin, Olive oil (contains exclusively refined and virgin olive oil) and Olive-pomace oil. Olive oil and Olive-pomace oil are oils obtain through a refining process. First product, after the refining of Lampante, it obtains refined olive oil. It conserves its basic chemical structure and is then added a certain quantity of Virgin or Extra Virgin, which contributes with its aroma and taste, to obtain Olive oil. The acidity of these olive oils, by law, must be less than or equal to 1º. Second product, Olive-pomace oil, is the solid sub-product obtained in the virgin olive oil production process. It must then undergo a refining process, similar to that of Lampante olive oil, to become Refined Olive Oil. A percentage of virgin or extra virgin olive oil is added so that it reaches the commercial category of Olive Pomace Oil, with acidity inferior or equal to 1º.
Export. Volume of Spanish export of all categories of olive oils in final market. Import. Volume of Spanish import of all categories of olive oils in final market. Data was obtained for Spanish Ministry of Agriculture, Food and Environment, by Spanish Reporting and Food Control Agency and its national Consumer Panel Data. Three are the reasons because we used a national source for database: 1) our objective and analysis are focused on Spanish activity (national and international); 2) Ministry of Agriculture, Food and Environment is responsible for sending the information about Spanish olive oil sector to European Union; and 3) while international sources provided monthly data, this Ministry provided weekly data, periodicity more adjusted to the real activity of the olive oil Spanish sector.
Additionally, we use a dummy variable in order to collect the possible impact of European politics in the Spanish activities. The European Union and the COM in olive oil and tables olives, in its commission regulation No 826/2008, allows the granting of private storage aid if producer prices is under certain levels (less than 1,779€/tonne for Extra Virgin, less than 1,710 €/tonne for Virgin, and less than 1,524 €/tonne for Lampante). Due to there is 4 periods of intervention in Spain, we have integrated them in only a variable, depending they refer to the first, the second, the third or the fourth period of intervention3.
Finally, to control month effect, we introduce other dummies variables. These variables let us appreciate the fact that volume (exported, imported, produced and consumed) varies from a month to another.
A short description of these variables is shown in table 2.
3 The information about of these periods was obtained by European Union and Spanish Agricultural Guarantee Fund. They are: 1st) July'09-January'10; 2nd) October'11-May'12; 3rd) February'12-August'12; and 4th) May'12-December'12.
Table 2. Description of variable’s analysis
VARIABLE NAME DESCRIPTION
Production Volume of Spanish production
Consumption Spanish home demand
Export Volume of Spanish export
Import Volume of Spanish import
Dummy: CAP intervention Dates in which is activated the private storage aid in Spanish olive oil market
Dummy: Month Each month
IV.I. Descriptive analysis and econometric method
Considering time series, two main steps have to be identified. The first step is to understand the dynamic of each series and more precisely to know if it is integrated or not. The second one is to analyse the co-evolution of all series depending there are stationary or not.
Descriptive analysis
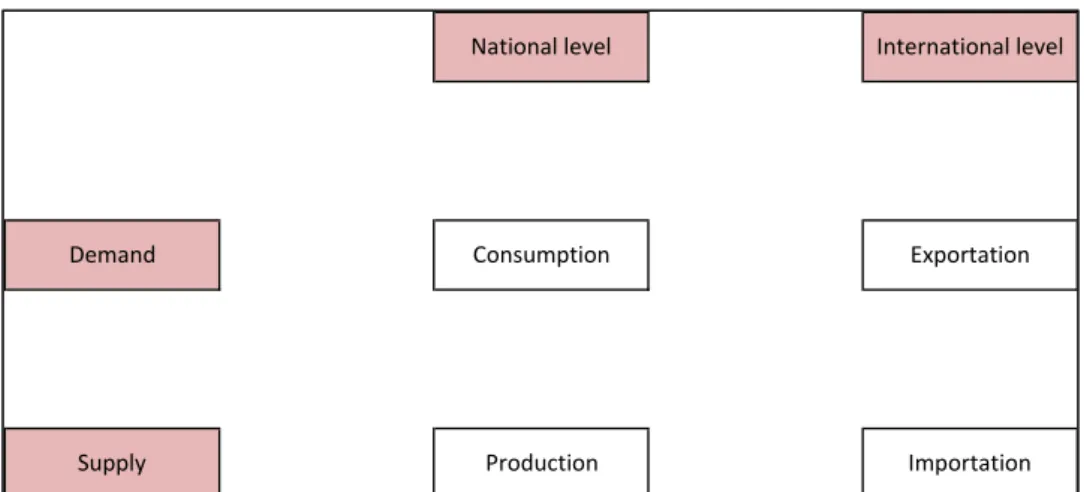
To correctly understand the olive oil market at the Spain level, we have to take into account both national structure and international one. Moreover, we need to differentiate the supply from the demand. This leads us to consider the articulation described in figure 3.
Figure 3: Articulation of series
National level International level
Demand Consumption Exportation
Once the scheme detailed, we have to define if each series has or not an impact on another one. We consider that demand and supply has an impact at the national and international level; and conversely. Our hypothesis is that the evolution of each series has to be considered to understand the evolution of the others. We suppose that there is a mutual articulation4.
Series considered to analyse this scheme are based on volumes and not on prices. Since we focus on volumes, we can appreciate consumers’ preferences. Indeed, price indicates a level to obtain a certain product. This makes the assumption that products are equivalent at the same price, however even at the same price consumption can differ considering the origin of the product.
Taking into account first step, figure 1 underlines that a market has to be considered in terms of his evolution. Depending if a series is stationary or not, the way to consider a series in articulation with others ones can differ.
In this sense, a series can be stationary or integrated. An integrated series means that the value of yesterday has an impact on today’s value; while a stationary series can be qualified of “amnesic series”. To test whatever the series is integrated or stationary, we implement the augmented Dickey-Fuller test (Dickey and Fuller, 1981). This test has for null hypothesis that the series has a unit root. In case of unit root, the series is said integrated. Results shown in table 3 underline that every series is stationary at 1% level. Thus, series can be qualified as amnesic since they have no memory.
Such amnesia can be explained by the fact that even if the olive production is seasonal, its level and quality depend of the weather, and the olive oil produced can be storage during a year, without altering the quality of product. In this way, this product is more independent from market fluctuations (see Gutiérrez-Salcedo et al., 2013a).
4
In this sense, Pupo D’Andrea and Anania (2009) emphasize that demand plays a main role in the development of the market together the imperfectly competitive structure of the industry. Conversely supply factors and changing in trade policies are not so relevant. How do the relations work? The supply may be influenced by production and by the EU aids and intervention policies which may increase or reduce prices. The demand depends on the stock and prices in addition to consumer’s preferences. The EU policy intervention may also exert some influence on the demand’s side. The consumption may be positively affected from changing in the per capita income, the higher the income the higher the consumption. As regard storage, it depends on the beginning provision an on the demand. However some price intervention may also have an effect on the level of the storage. So, the capacity of country to exports depends on the agricultural production, on the demand, on total production, on consumption and on the variation of the stocks. By modelling this function we can understand the evolution of the series and the influence that each series exert on the others.
Table 3: Augmented Dickey-Fuller test
CONSUMPTION EXPORTATION IMPORTATION PRODUCTION t-Statistic (Prob.) -5.3183 (0.0000) -5.2376 (0.0001) -4.0989 (0.0011) -7.8682 (0.0000) Crit. values 1% level 5% level 10% level -3.4408 -2.8660 -2.5692 -3.9729 -3.4171 -3.1309 -3.4407 -2.8660 -2.5692 -3.9730 -3.4171 -3.1310 Econometric method
Since all series are stationary, a Vector Auto Regressive (VAR) model appreciates their articulation. Let consider 2 series A and B. The VAR model let measure the impact of the evolution of A on B and conversely the impact of B on A. In such a case, the assumption is that there is a mutual causality between A and B. In opposition with econometric linear model, times series can measures this mutual conditional evolution. Formally, we can summarize the VAR models as below:
For each model, we have considered as a control the month to validate that series can evaluate differently considering the period of the year. Furthermore, we assume that all series are not impacted by interventions. While the level of production, the volumes imported and exported are supposed to depend on these interventions; we make the hypothesis that the consumption is independent. Since the olive oil is an annual production, its price is quite stable and independent from the CAP intervention..
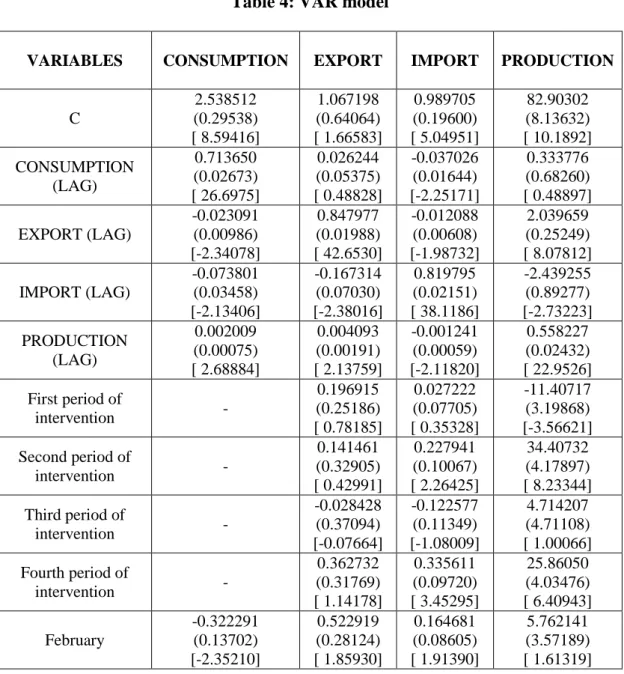
V. Results
VAR results could be observed in table 4 in Appendix. Furthermore, the articulation between all series can be summarized in figure 4, where the arrow indicates there is a significant link. Negative link are represented by dotted arrow; while a positive one is represented by plain arrow.
Figure 4: Nature of co-evolution of olive oil markets
Regarding to results of dummy variables analysis, we should point out that almost all series are independent from a seasonal point of view, probably because production of olive oil can be stored. With and exception, importation is the only series that evaluates differently depending the month. While importations are more important on February and March, the period from April to September corresponds to less level of exchange. Results also highlight that importations are the only to depend on CAP intervention. Exportations and production level seem to be independent from these periods of intervention.
National level Internation level
Demand consumption exportation
Supply production importation
CAP intervention
In next paragraphs, we discuss the results of VAR model for each series and their articulation.
Determinants of the consumption level
The model implemented let appreciate the preferences of both producers and consumers.
First, results highlight that the Spanish consumer is sensitive to the local production, as Erraach et al. (2013) noted through a consumer survey. As a matter of fact, an increase of the national production has a positive impact on the consumption; while it’s the contrary for the importation. Such links highlight the behaviour of consumers and more precisely their preferences for the national production.
Moreover, we observe an economic arbitration for producers. Any increase of exportation translates into a decrease of consumption and, in other hand, when consumption increase, exportation increase also. This is not a contradiction, because it has an important dependency with the level of prices in national market.
Based on the fact that consumption is influenced by economic position consumer (see Martin, 2012), when national level price decrease, national consumption increase because more consumers can buy olive oil. But, if international prices are higher than national prices, of course, producers prefer to sell their production outside5.
Thus, since the Spain olive oil produce serves to national and international demand, the link described indicates that producers prefer sell their production to the international market rather than to the local market.
Determinants of the production level
The level of Spain production indicates a potential that answer the national and international demand. It appears that both national and international demand has no influence on the production.
Because Spain is one of the main producers of olive oil, the absence of link with international and national market indicates that the production has a double outlet. Hence, if the production is not sell at the national market, it will be send at the
5 This situation is closely connected with the production level, as you can see in the discussion about production series.
international market and conversely. The important point is not the type of outlet but more the fact that producers know they can flow their production.
But, this fact has an important consequence in price level of both markets. When production exceeded national and international demand, because the storage capacity is not very high, sometimes producers reduce price in order to sell all their olive oil and prepare the mills for the next production period. In other words, producers not consider the capacity of consumption in order to determine their level of production, situation that not has changed for more a decade (see Parras, 2001).
So, Spanish production is defined independently from any national or international activity.
Determinants of the exportation level
The level of exportation depends on the production level, in such a way that any increase of production leads to an increase of exportation. This relationship is explained by the different level of prices between national and international markets, it previously has been mentioned.
We also observe that, when importation increases to answer national demand, exportation decreases. This point remark the will to satisfy the national demand. Thus, while consumers prefer buy national olive oil, in case of non-sufficient production, producers will set at the national level to permit satisfying the national demand.
Determinants of the importation level
As above mentioned, importations let compensate a less level of production. Any increase of the production translates into less importation. Similarly, when producers can answer national and international demand, they do not import. Hence, any increase of exportation leads to a decrease of the importation.
Our results highlight that any increase of the consumption lead to less importation. As mentioned before, Spanish consumers prefer the national production. Hence, even if the demand is defined at a higher level, consumers will not buy imported production.
As indicated, the level of importation varies depending the period of exchange, being the month from April to September the period with a lower level. In the opposite, February and March concentrated the international negotiation, coinciding with the end of national olive oil production. During these two months, producers know the final
level of national olive oil produced and the level required for demand (national and international). Thus, if more olive oil is needed for cover these demands, they start the international negotiation.
Finally, we observe that periods of the CAP intervention have an impact on importations. More precisely, except the third period of intervention, the remaining have a positive impact on the level of importations. According to Gutiérrez-Salcedo et al. (2013b), because intervention supposed less level of olive oil in the national market, in order to maintain the level of demand, if producers need more olive oil during these periods, they have to buy it at international market.
VI. Conclusions
Olive oil is an important element in EU agricultural, particularly in Spain because it is the main producer and exporter in the world. Based on this key role and its influence in the rest of markets at world level, this contribution trying to analyse the price transmission at the national level to understand in which way this activity has some impact on the international ones. To achieve this aim, we analyse the relationships between variables that represent national and international Spanish activity: production, consumption, export and import. Furthermore, model includes two dummy variables (month and CAP intervention) in order to determine if the evolution of the main variables are influenced by time or EU policies.
The results of VAR analysis highlight a consumer preference to national olive oil. For this reason, producers have as a priority to supply national consumption. However, if international prices are higher than national prices, they prefer to sell their production at international market. So, national olive oil price is who determine if olive oil is sold at national or international market.
In other hand, production is considered the variable more independent of the model, not be influence by national or international activity. In contrast, it has an important influence in the rest of variable, basically through national price. Thus, an increase of production brings a decrease of national price. This effect has as consequence an increase of national consumption, because more consumer can buy olive oil, and at the same time, an increase of export, because international price is more attractive for producer. In the opposite, a decrease of production has a positive effect in import, since it is activated in order to face up to commitments with national and international
demand. So, relationships between these variables through national price highlight a special price sensibility of two more important agents in Spanish olive oil sector: producers and consumers.
Regarding to EU policies, results show that CAP intervention by private storage no has an important effect in national price because, while it is activated, producers can sell/buy olive oil at international market. Therefore, it is not an enough strategy to improve the general welfare of market agents, as was established.
To sum up, three aspects could be highlight about national and international activity in Spanish olive oil sector:
The price sensibility of consumer and producer determines Spanish international activity.
This price sensibility is an essential consequence of production level and national equilibrium between supply and demand.
If the objective of CAP intervention is increase national price, adjustment measures have to be focused on production because it is the determinant of national and international activity. For example, invest into formation of agents in terms of productivity, quality and management.
References:
Dickey, D.W. & Fuller, W.A. (1981), The likelihood ratio Statistics for autoregressive time series with a unit Root, Econometrica, 49(4), p.1057-1072.
Dios-Palomares, R. & Martínez-Paz, J.M. (2011), Technical, quality and environmental efficiency of the olive oil industry, Food Policy, 36, p.526-534.
Emmanouilides, C.; Fousekis, P. & Grigoriadis, V. (2014), Price dependence in the principal EU olive oil markets, Spanish Journal of Agricultural Research, 12(1), p.3-14.
Errach, Y.; Sayadi, S. & Parra-López, C. (2013), Preferencias por el origen del aceite de oliva: Influencia de variables socio-económicas y estilo de vida del consumidor andaluz, in El sector de elaboración de aceite de oliva: un studio multidisciplinary, Centro Internacional de Excelencia para Aceite de Oliva-GEA Westfalia Separator Iberica, Jaén (Spain).
Fousekis, P. & Klonaris, S. (2002), Spatial price relationships in the olive oil market of the Mediterranean, Agricultural Economics Review, 3(2), p.23-35.
Gutiérrez-Salcedo, M.; Torres-Ruiz, F.J.; Vega-Zamora, & M.; Murgado-Armenteros, E.M. (2013b), Efecto de las prácticas de envasadores y refinadores en la formación de precios en la cadena de los aceites de oliva, XVI Simposio Científico Técnico del Aceite de Oliva, May, Jaén (Spain).
Gutiérrez-Salcedo, M.; Torres-Ruiz, F.J.; Vega-Zamora, M.; Murgado-Armenteros, E.M. & Parras, M. (2013a), Características del sistema agroalimentario de los aceites de olive y su incidencia en la formación y transmisión de los precios de los aceites, in El sector de elaboración de aceite de oliva: un studio multidisciplinary, Centro Internacional de Excelencia para Aceite de Oliva-GEA Westfalia Separator Iberica, Jaén (Spain).
International Olive Oil Council (IOOC) (2013), World olive oil figures, www.internationaloliveoil.org
Ismea (2013) Olive Oil Report, www.ismea.it
Larby and Chemsy (2009) “The impact of the government policies and incentives to promote the export of agricultural products in Tunisia: case of olive oil”. 113th EAAE Seminar.
Martin, V.J. (2012), Consumo de aceite de oliva en España, Distribución y Consumo, November-December, p.27-37.
Martínez, A.B.; Talavera, J.; Vilar, J.; Cárdenas, R.; Velasco, M.M.; Poyatos, R. & Caño, S. (2011), Análisis de la evolución del sector de aceite de olive: campañas 2005-2010, XV Simposio Científico Técnico del Aceite de Oliva, May, Jaén (Spain). Migdalas, G.; Baourakis, N.; Kalogeras, H.B. & Meriem (2004), Sector modelling for
the prediction and evaluation of Cretan olive oil, European Journal of Operational Research, 152, p.454-464.
Moral, E.; Lanzas, J.R. & Cuadros P.J. (2012), Adaptación de las exportaciones españolas del aceite de olive a la demanda mundial, Boletín Económico ICE, 3027, p.23-34.
Parras, M. (2001), El comportamiento del consumidor y la demanda de aceites vegetales en España: oliva virgen versus oliva/girasol, Estudios Agrosociales y Pesqueros, 292, p.161-193.
Pupo D’Andrea, M.R. & Anania, G. (2009), The global market for olive oil: actors, trends, prospects and research needs, I Mediterranean Conference of Agro-Food Social Scientists, April, Barcelona (Spain).
Roldán-Casas, J.A.; Dios-Palomares, R. & Martínez-Paz, J. (2013), Integración especial en el mercado europeo de aceite de olive, ITEA, 20, p.1-18.
Appendix
Table 4: VAR model
VARIABLES CONSUMPTION EXPORT IMPORT PRODUCTION
C 2.538512 (0.29538) [ 8.59416] 1.067198 (0.64064) [ 1.66583] 0.989705 (0.19600) [ 5.04951] 82.90302 (8.13632) [ 10.1892] CONSUMPTION (LAG) 0.713650 (0.02673) [ 26.6975] 0.026244 (0.05375) [ 0.48828] -0.037026 (0.01644) [-2.25171] 0.333776 (0.68260) [ 0.48897] EXPORT (LAG) -0.023091 (0.00986) [-2.34078] 0.847977 (0.01988) [ 42.6530] -0.012088 (0.00608) [-1.98732] 2.039659 (0.25249) [ 8.07812] IMPORT (LAG) -0.073801 (0.03458) [-2.13406] -0.167314 (0.07030) [-2.38016] 0.819795 (0.02151) [ 38.1186] -2.439255 (0.89277) [-2.73223] PRODUCTION (LAG) 0.002009 (0.00075) [ 2.68884] 0.004093 (0.00191) [ 2.13759] -0.001241 (0.00059) [-2.11820] 0.558227 (0.02432) [ 22.9526] First period of intervention - 0.196915 (0.25186) [ 0.78185] 0.027222 (0.07705) [ 0.35328] -11.40717 (3.19868) [-3.56621] Second period of intervention - 0.141461 (0.32905) [ 0.42991] 0.227941 (0.10067) [ 2.26425] 34.40732 (4.17897) [ 8.23344] Third period of intervention - -0.028428 (0.37094) [-0.07664] -0.122577 (0.11349) [-1.08009] 4.714207 (4.71108) [ 1.00066] Fourth period of intervention - 0.362732 (0.31769) [ 1.14178] 0.335611 (0.09720) [ 3.45295] 25.86050 (4.03476) [ 6.40943] February -0.322291 (0.13702) [-2.35210] 0.522919 (0.28124) [ 1.85930] 0.164681 (0.08605) [ 1.91390] 5.762141 (3.57189) [ 1.61319]
March -0.280306 (0.13367) [-2.09696] 0.149973 (0.27322) [ 0.54891] 0.149738 (0.08359) [ 1.79134] -14.81825 (3.46996) [-4.27044] April -0.056646 (0.13181) [-0.42976] -0.178144 (0.26654) [-0.66835] -0.083266 (0.08155) [-1.02107] -18.80554 (3.38517) [-5.55526] May -0.303394 (0.13273) [-2.28571] 0.306012 (0.26962) [ 1.13497] -0.112720 (0.08249) [-1.36648] -34.41853 (3.42428) [-10.0513] June -0.279874 (0.14114) [-1.98291] 0.766540 (0.29019) [ 2.64149] -0.130491 (0.08878) [-1.46979] -43.52600 (3.68553) [-11.8100] July -0.208794 (0.14819) [-1.40893] 0.640427 (0.31084) [ 2.06030] -0.227193 (0.09510) [-2.38899] -59.10345 (3.94777) [-14.9713] August -0.407172 (0.15339) [-2.65442] -0.269067 (0.32596) [-0.82547] -0.382428 (0.09972) [-3.83485] -63.94880 (4.13973) [-15.4476] September 0.243605 (0.16466) [ 1.47944] 1.401372 (0.35565) [ 3.94026] -0.184168 (0.10881) [-1.69255] -76.71923 (4.51692) [-16.9849] October 0.126807 (0.17239) [ 0.73556] 0.488538 (0.38417) [ 1.27167] -0.281217 (0.11753) [-2.39265] -88.65969 (4.87905) [-18.1715] November -0.100950 (0.16975) [-0.59470] 0.454678 (0.37807) [ 1.20262] -0.154912 (0.11567) [-1.33927] -77.38766 (4.80163) [-16.1170] December 0.223876 (0.14365) [ 1.55853] -0.261185 (0.30482) [-0.85684] -0.100609 (0.09326) [-1.07882] -35.82914 (3.87135) [-9.25496] R-squared 0.632846 0.853624 0.781237 0.947437 Adj. R-squared 0.623743 0.848996 0.774321 0.945776 Sum sq. resids 267.0279 1061.367 99.34566 171195.5 S.E. equation 0.664356 1.328910 0.406572 16.87753 F-statistic 69.52069 184.4661 112.9612 570.1561 Log likelihood -619.1057 -1047.583 -312.0995 -2625.932 Akaike AIC 2.045429 3.438271 1.069564 8.521520 Schwarz SC 2.159602 3.580987 1.212279 8.664236 Mean dependent 8.140709 13.79309 1.289614 160.2462 S.D. dependent 1.083075 3.419806 0.855838 72.47890