Simultaneous three-axis torque measurements of micromagnetism:
Supplementary Material
K.R. Fast, J.A. Thibault, V.T.K. Sauer, M.G. Dunsmore, A. Kav,
J.E. Losby, Z.Diao, E.J. Luber, M. Belov, and M.R. Freeman
S1
Sample Fabrication Details
These devices were fabricated at the University of Alberta nanoFAB facility as a double-clamped paddle supporting a thin cobalt oxide / permalloy bilayer disk. A subsequent modification of the devices involved the release of one supporting arm with a focused ion beam (FIB) cut.
Depositions were done using confocal magnetron sputtering on an ATC Orion 8 sputter system (AJA International Inc.), using 2" diameter targets (Plasmaterials Inc.). Prior to deposition, the base pressure of the chamber was less than 2.0E-7 Torr. The CoO films (20 nm thick) were reactively RF sputtered from a Co target at a power of 118 W, a sputtering gas pressure of 4 mTorr, flow rate of 14 SSCM Ar and 6 SCCM O2 and a deposition rate of 0.228 nm/min. After reactive sputtering the CoO the chamber was filled with argon to a pressure of 40 mTorr and held for 60 seconds, then pumped back down to vacuum for 60 seconds. This process was repeated 5 times to ensure that any residual oxygen from the reactive sputtering had been evacuated from the chamber prior to NiFe deposition. The NiFe film (20 nm thick) was co-deposited from Ni and Fe targets and DC power supplies at 40 and 13 W, with deposition rates of 1.13 and 0.31 nm/min respectively and a sputtering pressure of 4 mTorr using argon gas flowing at 20 SCCM. Deposition rates very determined using a quartz crystal monitor, where the CoO was assumed to have a density of 6.44 g/cm3and the bulk densities of 8.91 and 7.86 g/cm3 for Ni and Fe were used.
S2
Thermomechanical Calibration
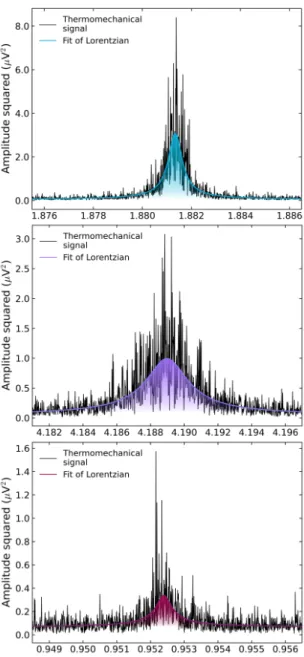
The sensitivities to each torque mode were determined through thermomechanical calibration by measuring torque with no applied RF field. The thermomechanical signal for each mode is given in Figure S1. The quality factor of the resonances is paired with material parameters and sensor dimensions to calculate the sensitivity as per the procedure of Hauer et al.13. These sensitivities are calculated to be 16.50, 67.72, 48.23 aN m / mV for τx, τy, and τz, respectively.
S3
Scanned Signal Maps
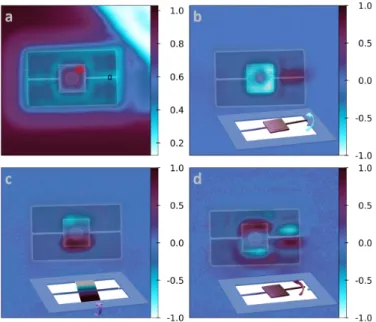
The optical reflectance and the motion of the device when driven at each mechanical frequency are shown through signal maps in Figure S2. Each quadrant includes a transparent overlay of an SEM image of the device as a reference for the sensor orientation. This SEM was taken prior to the FIB cut. The location of the cut is indicated by a dark rectangle in S2a. The red circle on Figure S2a indicates the laser spot position for the data collection throughout the
main text. Finite element simulation of each torque mode performed in COMSOL Multiphysics is shown at the bottom of each panel as a reference for the expected motion of each torque mode.
The scanned reflectance in Figure S2a produces a detailed image of the device. The top right corner of this panel shows a remnant of photoresist from the fabrication procedure. The low reflectance in this region is likely an effect of this remnant sitting at non-normal angle relative to the silicon, resulting in the reflection of light away from the photodetector. The torque driven signals of Figure S2b-c-d show no evidence of this remnant material and indicate motion consistent with expectation.
The reflectance and signal phase of the x- and z-torque modes in Figure S2 show notable features as effects of diffraction. The reflectance from the arms is less obvious than the features of the paddle, and the phase behaviours of the x- and z-torques (Figure S2b and S2d) are not indicated by finite-element simulations. These features stem from diffracton effects related to the laser beam width (approximately 0.8 µm) in comparison with the arm width (0.2 µm). The y-torque (Figure S2c) scan does not show evidence of diffraction effects, due largely to the negligible motion of the arms. These diffraction effects are seen around the paddle (3.0 x 2.9 µm) edges, though are not prominent in the paddle’s center, when the beam spot is positioned completely on the paddle.
Simulation of the x-torque indicates a uniform phase across the device. The x-torque shown in Figure S2b shows an unexpected phase difference between the paddle and the arm. This phase reversal is a result of scattered reflected light from the surface below the device, which eliminates reflected intensity from out-of-plane motion of the cut arm. Similarly, the motion of the z-torque in Figure S2d exhibits a 180 degree phase difference between the paddle and the arm. In this case, diffraction losses from the edges of the arm, where the laser spot overlaps the arm and the undercut are the cause of this phase difference. The diffraction losses surpass the magnitude of the arm’s reflected intensity, lending to an optical readout of negative motion from in-plane modulation of the sensor.
Figure S1: Thermomechanical signal for each torque mode, with a Lorentzian fit applied. The parameters of the Lorentzian fit were used to determine the sensitivity, as per the procedure by Hauer et al.13.
Figure S2: Scanned images of the normalized a) reflected intensity of optical light, b) x-torque ( fmechanical = 1.886
MHz), c) y-torque ( fmechanical= 4.194 MHz), d) z-torque ( fmechanical= 0.953 MHz), overlaid with a transparency of an
SEM image of the sample. The dark square on the right supporting arm of the SEM in (a) indicates the approximate location of the FIB-cut, which was performed after the collection of this SEM. The red circle on the top right of the paddle in (a) indicates the approximate laser spot position for the collection of the data shown in Figure 2. Simulated motion corresponding to each resonant frequency is shown at the bottom of (b), (c), and (d), with arrows indicating the motion of each mechanical mode.