HAL Id: hal-01241333
https://hal.sorbonne-universite.fr/hal-01241333
Submitted on 10 Dec 2015
HAL is a multi-disciplinary open access
archive for the deposit and dissemination of
sci-entific research documents, whether they are
pub-lished or not. The documents may come from
teaching and research institutions in France or
abroad, or from public or private research centers.
L’archive ouverte pluridisciplinaire HAL, est
destinée au dépôt et à la diffusion de documents
scientifiques de niveau recherche, publiés ou non,
émanant des établissements d’enseignement et de
recherche français ou étrangers, des laboratoires
publics ou privés.
Distributed under a Creative Commons Attribution| 4.0 International License
physical activity in a cross-sectional survey (the
ACTI-Cités project)
Mehdi Menai, Hélène Charreire, Thierry Feuillet, Paul Salze, Christiane
Weber, Christophe Enaux, Valentina A. Andreeva, Serge Hercberg,
Julie-Anne Nazare, Camille Perchoux, et al.
To cite this version:
Mehdi Menai, Hélène Charreire, Thierry Feuillet, Paul Salze, Christiane Weber, et al.. Walking
and cycling for commuting, leisure and errands: relations with individual characteristics and
leisure-time physical activity in a cross-sectional survey (the ACTI-Cités project). International Journal of
Behavioral Nutrition and Physical Activity, BioMed Central, 2015, 12 (1), pp.150.
�10.1186/s12966-015-0310-5�. �hal-01241333�
R E S E A R C H
Open Access
Walking and cycling for commuting, leisure
and errands: relations with individual
characteristics and leisure-time physical
activity in a cross-sectional survey (the
ACTI-Cités project)
Mehdi Menai
1, Hélène Charreire
1,2, Thierry Feuillet
1, Paul Salze
3, Christiane Weber
3, Christophe Enaux
3,
Valentina A. Andreeva
1, Serge Hercberg
1,4, Julie-Anne Nazare
5, Camille Perchoux
5, Chantal Simon
5and Jean-Michel Oppert
1,6*Abstract
Background: Increasing active transport behavior (walking, cycling) throughout the life-course is a key element of physical activity promotion for health. There is, however, a need to better understand the correlates of specific domains of walking and cycling to identify more precisely at-risk populations for public health interventions. In addition, current knowledge of interactions between domains of walking and cycling remains limited.
Methods: We assessed past-month self-reported time spent walking and cycling in three specific domains (commuting, leisure and errands) in 39,295 French adult participants (76.5 % women) of the on-going NutriNet Santé web-cohort. Multivariate logistic regression models were used to investigate the associations with socio-demographic and physical activity correlates.
Results: Having a transit pass was strongly positively associated with walking for commuting and for errands but was unrelated to walking for leisure or to all domains of cycling. Having a parking space at work was strongly negatively associated with walking for commuting and cycling for commuting. BMI was negatively associated with both walking for leisure and errands, and with the three domains of cycling. Leisure-time physical activity was negatively associated with walking for commuting but was positively associated with the two other domains of walking and with cycling (three domains). Walking for commuting was positively associated with the other domains of walking; cycling for commuting was also positively associated with the other domains of cycling. Walking for commuting was not associated with cycling for commuting.
Conclusions: In adults walking and cycling socio-demographic and physical activity correlates differ by domain (commuting, leisure and errands). Better knowledge of relationships between domains should help to develop interventions focusing not only the right population, but also the right behavior.
Keywords: Walking, Cycling, Active transport, Physical activity, Correlates, Age, Cross-sectional, Web-cohort, Commuting, Leisure, Errands
* Correspondence:jean-michel.oppert@aphp.fr
1
Université Paris 13, Equipe de Recherche en Epidémiologie Nutritionnelle, Centre de Recherche en Epidémiologie et Statistiques, Inserm (U1153), Inra (U1125), Cnam, COMUE Sorbonne Paris Cité, Bobigny, F-93017, France
6Department of Nutrition Pitié-Salpêtrière Hospital (AP-HP), Institute of
Cardiometabolism and Nutrition (ICAN), Université Pierre et Marie Curie-Paris 6, Paris, France
Full list of author information is available at the end of the article
© 2015 Menai et al. Open Access This article is distributed under the terms of the Creative Commons Attribution 4.0 International License (http://creativecommons.org/licenses/by/4.0/), which permits unrestricted use, distribution, and reproduction in any medium, provided you give appropriate credit to the original author(s) and the source, provide a link to the Creative Commons license, and indicate if changes were made. The Creative Commons Public Domain Dedication waiver (http://creativecommons.org/publicdomain/zero/1.0/) applies to the data made available in this article, unless otherwise stated.
Menai et al. International Journal of Behavioral Nutrition and Physical Activity (2015) 12:150
Background
Active transportation is now considered as a key element of physical activity promotion for health [1]. Walking and cycling in everyday life may help to achieve sufficient physical activity for health benefits at the population level [2]. Walking and cycling are relatively easy to include in daily routines and have societal benefits such as positive impact on traffic, air pollution, and greenhouse gas emis-sions [3]. Walking and cycling, like physical activity in general, should be considered as multi-factorial behaviors varying throughout the lifecourse and by domain, such as commuting, leisure or errands [4].
For interventions to attain success in target populations, there is a need to better understand the determinants of adoption and maintenance of walking and cycling [5]. Correlates of active travel include personal, social and environmental factors [6]. There is evidence that gender and having access to a car or being overweight are associ-ated with active travel [7–9]. For age, mixed findings have been reported with null [10, 11] or negative [11–14] asso-ciations with walking or cycling. One possible reason for these inconsistent findings may be related to the fact that very few studies have specifically assessed correlates of walking and cycling by domain, i.e. the different contexts of daily life where physical activity takes place (commut-ing, leisure, and work). Knowledge of domains may help to design interventions and guide public health policies to target at-risk populations.
To date, some studies have explored associations with other types of physical activity such as leisure-time physical activity (LTPA) and overall active trans-portation [11, 15–17], walking [13, 18–21] or cycling [13, 19–22]. For example, in a large cross-sectional survey of 127,610 Canadian adults, Butler et al. found a positive association between walking for transporta-tion (to work, school and errands) and LTPA, and an even stronger association for cycling [13]. Sahlqvist et al. found recently in the iConnect study that a 1-year decrease in cycling for commuting (not for walking) was associated with a decrease in LTPA [19]. A limitation in previous literature is related to heterogeneity in the defin-ition of active transportation variables. This underscores the need for a much more detailed assessment of walking and cycling by domain, to better understand how walking and cycling are integrated into an overall physically active lifestyle. We hypothesize that 1) there are significant posi-tive interrelations between walking and cycling domains and 2) there are significant positive relations between walking and cycling, on one hand, and LTPA on the other. Consequently, the objectives of the present cross-sectional study, in a large sample of French adults, were 1) to identify personal and socio-demographic correlates of walking and cycling according to the different domains (commuting, leisure and errands), and 2) to explore the
interrelationships of these domains as well as associations with LTPA.
Methods Ethics statement
This study was approved by the "Comité National Informatique et Liberté" (CNIL n°908450, n° 909216 and DR-2012-576). The NutriNet-Santé Study (see below) was approved by the Institutional Review Board of the French Institute for Health and Medical Research (IRB Inserm n°0000388FWA00005831). Written informed consent was obtained from all subjects.
Study design and participants
We analyzed cross-sectional data from participants in the NutriNet-Santé Study, a web-based prospective observational cohort launched in France in 2009, focus-ing on the relationship between nutrition and chronic disease risks as well as the determinants of dietary behaviors. Volunteers aged 18 years or older (age range 18–96 years) living in France and having access to the Internet fill in self-administered web-based questionnaires at baseline and then regularly during follow-up using a dedicated, secure website. A detailed description of the NutriNet-Santé study has been published previously [23].
Participants in the present study were subjects from the NutriNet-Santé cohort who completed a questionnaire on physical activity and mobility, administered from February 15 to August 15 2013 (n = 55,694; 48.5 % participation rate). This questionnaire was designed to assess active transport in everyday life over the past four weeks.
From the sample who filled in the physical activity questionnaire, 1730 participants were excluded because of physical limitations to mobility, such as self-reported motor impairments (n = 927) or self-reported limita-tions to walking (item ‘Ability to walk 100 m’ n = 803). Additionally we excluded participants who were preg-nant (n = 730), reported implausible physical activity values (n = 2817), or had missing data regarding the covariates used in multivariable analyses (n = 11,122). Thus, we reached a final sample of 39,295 subjects with a mean ± SD age of 49.1 ± 14.4 years.
Measures
Walking, cycling and other types of physical activity
Habitual physical activity was assessed using a dedicated developed questionnaire, the Sedentary, Transportation and Activity Questionnaire (STAQ). Briefly, the STAQ is based on the Recent Physical Activity Questionnaire (RPAQ) [24], with additional specific items on travel-related activities and sedentary behavior by domain. To assess more pre-cisely transport behaviors (active and passive), subjects were asked to report their travel time for commuting, leisure and errands (defined as non-commuting non-leisure purposes
such as shopping, bringing children to school, going to the movies, etc.) for the past 4 weeks.
Physical activity assessment using the RPAQ has been validated against energy expenditure measurements using the doubly-labelled water [24]. The validity and reliability of the specific questions on travel-related activities have been assessed in 88 subjects aged 20–65 years (article under revision). Briefly, the estimate of active transport time was found significantly correlated with data obtained by a logbook (r = 0.40, mean bias 7.2 %), and reliability was moderate (intra-class coefficient 0.47 for 1-month test-retest).
The travel questions were detailed by type of transporta-tion (car, public transportatransporta-tion, walking, cycling, and other mechanical vehicle) and included the mean number of days per week and the mean duration per day where the particu-lar type of transportation was used. For each type of trans-portation, results were expressed in h/week. Walking and cycling by domain were dichotomized (≥0.5 h/week and≥ 0 h/week, respectively). We chose 0.5 h/week for walking (approximately 5 min/day 6 days/week) to represent a minimum level of walking beyond mandatory steps during daily living at home. When analyses were performed using different thresholds (≥1.0 h/week and ≥ 0.5 h/week for walking and cyc-ling, respectively), similar results were observed (data not shown). There were six outcomes: walking for commuting, walking for leisure, walking for errands, cycling for commuting, cycling for leisure and cycling for errands. For each multivariate model with one of these outcomes, other outcomes were used as covariates. When walking or cycling for commuting was used as covariate, we created three-class variables (e.g. for walking for com-muting: do not work/work but do not perform walking for commuting/work and perform walking for commuting); results for the“do not work” class are not presented.
For domestic physical activity, a unique question was asked about the time spent per week usually doing moderate to vigorous activities such as cleaning the floor, using vacuum or similar activity. Based on the median, this variable was dichotomized as ± 7 h per week (i.e. 1 h/day). LTPA was obtained by summing weekly durations of each activity reported in the leisure section. Walking for leisure and cycling for leisure were not included in the calculation because there were part of the walking and cycling variables. The resulting LTPA variable was categorized based on quartiles: less than 1 h per week (1st quartile), between 1 h and 2 h30 per week (quartiles 2), more than 2 h30 per week (quartile 3–4).
Covariates
Individual and socio-demographic variables were assessed by self-administered questionnaire completed by partici-pants at inclusion. Data included age, gender, weight and
height, educational level (more or less than 2 years of university), household income (0–1,430 Euros/month, 1,430–2,330 Euros/month, 2,330–3,780 Euros/month, more than 3,780 Euros/month, do not know/do not want to respond), smoking status (yes or no), household compos-ition (living alone or in a couple), presence of children at home (aged under 13 years, between 14 and 18 years), self-rated health (poor to average, good to very good) and home address. Age was categorized by 5-year age group for figures and used continuously in other analyses. Body mass index (BMI) was calculated as reported weight (kg) divided by reported height squared (m2).
Weekly number of working hours was asked during the past 4 weeks and the weekly mean duration was computed. Distance to work was estimated based on the frequency and the duration of each type of transport used for com-muting, on the basis of 25 km/h for car, 25 km/h for public transport, 10 km/h for cycling, 4 km/h for walking and 10 km/h for others modes of transportation [25]. The type and amount of physical activity at work was assessed with a 4-category qualitative question [24] (sedentary, standing, manual or heavy manual job) and a binary variable was created (sedentary or standing job, manual and heavy manual job). Parking at work was assessed by a binary vari-able. Sedentary leisure activities were derived from ques-tions asking participants to report hours per day (excluding working hours) usually spent on an average work/non-work day over the past four weeks– watching television, DVDs or other videos; using a computer, a tablet, or playing screen-based video games. The sum of all the mean durations per week of these activities was categorized as between 0 and≤ 2 h per day, between 2 h and 4 h per day and more than 4 h per day.
City density (number of inhabitants/surface) was obtained from the Census databases (www.insee.fr) and categorized as follows: 0–300 people per km2
(rural area), 300–2000 people per km2
and more than 2000 people per km2(high density city).
Statistical analyses
Continuous variables were summarized by means ± stand-ard deviations (SD) and categorical variables by frequencies. Associations between practice of walking or cycling and potential correlates were assessed using multivariate logistic regression models. Results are expressed as odds ratios (OR) with 95 % confidence intervals (CI). We also computed Nagelkerke's R2for each model. We initially identified potential correlates and covariables in models through bivariate analyses and existing literature. Covariates included age, income, self-rated health status, smoking status, leisure screen time, city density, distance to work, and time spent at work. For all analyses, the significance level was set at 0.05 and all tests were two-tailed. All statistical analyses were performed
using SAS software (version 9.3, SAS Institute Inc., Cary, NC, USA).
Results
Characteristics of the study population
Compared to subjects included in the NutriNet-Study but not included in the present analyses, our study population comprised more men (23.5 vs. 21.8 %, p < 0.001), older subjects (49.1 vs. 43.0 years,p < 0.0001), and more subjects with education level of at least 2 years at university (64.3 vs. 57.8 %,p < 0.0001). Subjects were mostly middle-aged, with a majority of women, and two-thirds being highly educated (Table 1). Two-thirds of subjects also reported having a job, which was of a sedentary type for a majority of them. Over-all, walking for commuting, leisure and errands was performed by 26.3 %, 41.9 % and 42.0 % of subjects, respectively. Cycling for commuting, leisure and errands was performed by 7.2 %, 9.7 % and 8.6 % of subjects, respectively.
Walking and cycling across age groups
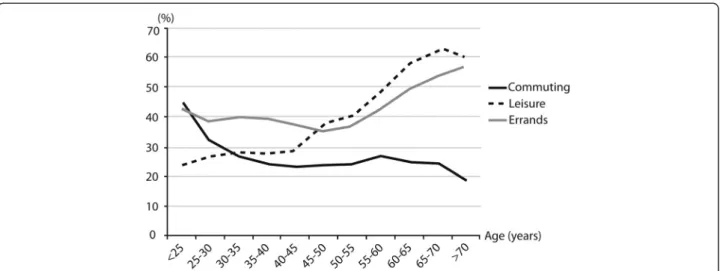
Frequencies of walking for commuting decreased across age groups from < 25 to 30–35 years of age (43.9 to 27.3 % of employed subjects) and remained stable until 65–70 years of age (Fig. 1). They increased continuously for leisure (24.6 % for < 25 to 60.9 % for 65–70 years of age). Frequencies of walking for errands remained stable until 50–55 years of age (41.4 % for < 25 to 35.8 % for 50–55 years of age) and then increased. From < 25 to 65–70 years of age, there was a decrease of cycling for commuting frequencies (from 8.3 to 5.5 %), while it slightly increased for leisure (from 7.4 to 11.4 %) and remained stable for errands (between 9.2 and 8.5 % of subjects) (Fig. 2).
Socio-demographic correlates of walking and cycling by domain
Female gender was positively associated with walking (significantly for leisure and errands) and negatively associated with cycling in the three domains (Table 2). BMI was negatively associated with both walking for leisure and errands, and with cycling in the three domains. Education was negatively associated with walk-ing for commutwalk-ing and cyclwalk-ing for leisure, but positively associated with both walking and cycling for errands. Living with a partner was negatively associated with walking for commuting or errands but positively associ-ated with walking for leisure and cycling for commuting. Having a child under the age of fourteen at home was negatively associated with walking for commuting and for leisure but positively associated with walking for errands and cycling for leisure. Having a transit pass was strongly positively associated with walking for commut-ing or leisure and was not significantly associated with cycling. Having a parking space at work was strongly negatively associated with walking and cycling for com-muting. Having a strenuous job was negatively associ-ated with walking for commuting.
Interrelations between walking and cycling and relations with physical activity
Performing more than 2 h 30 per week of LTPA was negatively associated with walking for commuting and was positively associated with the two other domains of walking and with cycling (all three domains) (Table 3). Walking for commuting was positively asso-ciated with the other domains of walking, and cycling for commuting was also positively associated with other domains of cycling. Walking for commuting was not associated with cycling for commuting. Walking for leisure was positively associated with cycling for leisure, as walking for errands was positively associated with cycling for errands.
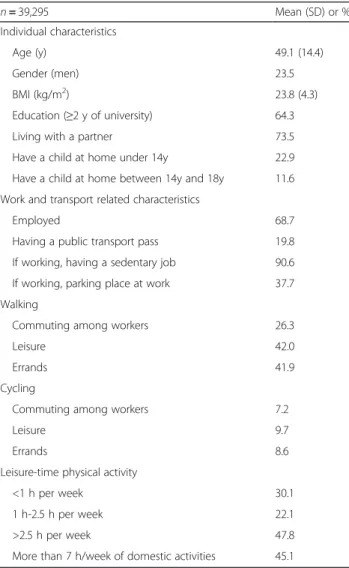
Table 1 Characteristics of study population
n = 39,295 Mean (SD) or % Individual characteristics Age (y) 49.1 (14.4) Gender (men) 23.5 BMI (kg/m2) 23.8 (4.3) Education (≥2 y of university) 64.3 Living with a partner 73.5 Have a child at home under 14y 22.9 Have a child at home between 14y and 18y 11.6 Work and transport related characteristics
Employed 68.7
Having a public transport pass 19.8 If working, having a sedentary job 90.6 If working, parking place at work 37.7 Walking
Commuting among workers 26.3
Leisure 42.0
Errands 41.9
Cycling
Commuting among workers 7.2
Leisure 9.7
Errands 8.6
Leisure-time physical activity
<1 h per week 30.1 1 h-2.5 h per week 22.1 >2.5 h per week 47.8 More than 7 h/week of domestic activities 45.1
Discussion
In a French sample from early adulthood to old age, we showed that the personal and socio-demographic corre-lates of walking and cycling varied by domain (i.e., com-muting, leisure and errands). We observed different trajectories for each domain of walking according to age. More specifically, we observed that walking for commut-ing decreased in early adulthood and remained relatively stable thereafter while walking for leisure and errands increased from mid-adulthood to older age. In contrast, cycling varied less with age and appeared as a more homogeneous construct across the adulthood years. In general, we found more significant correlates for walking than for cycling. There was a consistent pattern of posi-tive associations between all domains of walking and cycling and LTPA, except for a negative relation between walking for commuting and LTPA.
Our first objective was to identify personal and socio-demographic correlates of walking and cycling according to the different domains (commuting, leisure and errands). In particular, we found associations with age, BMI and, to a lesser extent, with education.
The higher frequency of walking for commuting during early adulthood is consistent with a recent study from the U.K. showing that walking to work decreased after age 29 and plateaued thereafter [26]. In another study from the U.S. in women with a mean (SD) age of 43.8 (11.4) years, walking to work at least once per week was negatively associated with age, modeled as continu-ous variable [27]. In contrast with walking for commut-ing, frequencies of other types of walking seemed to increase with age, markedly for walking for leisure. This is in agreement with results found in an U.S. population, in which the mean duration of leisure walking increased
Fig. 1 Percentage of subjects* reporting practice at least 30 min per week of walking in commuting, leisure and errands domain across 5-year age class. *: All the participants were included for walking for leisure and errands. Only the workers were included for walking for commuting
Fig. 2 Percentage of subjects* reporting practice any cycling in commuting, leisure and errands domain across 5-year age class. *: All the participants were included for cycling for leisure and errands. Only the workers were included for cycling for commuting
until 30–64 years of age (compared to age under 18 and 18–29 years) and then decreased [28]. In a study from Australia, leisure-time walking increased until 40–49 years of age (compared to 18–29 and 30–39 years) and then decreased [29]. It is likely that lifestyle changes related to working status explain, at least in part, these trends. In early adulthood, increasing financial possibilities and time constraints would favor car use [30, 31]. Later in life, espe-cially after 60 years of age, empirical studies have shown that retirement was associated with increased LTPA and especially walking for leisure [32, 33].
We found that BMI was significantly negatively associ-ated with all domains of walking and cycling. For walking, this is consistent with the findings of a recent systematic review by Murtagh et al. [34] assessing the effects of walk-ing interventions in previously inactive adults on several risk factors for cardiovascular disease. In that review, 25 studies presented data on body weight and all but one reported a negative treatment effect with a reduction in body weight and BMI. It should be noted that this body of evidence did not include cycling. In a less recent review, including 30 articles published up to October 2010,
Table 2 Relations of walking and cycling domains with individual and socio-demographic characteristics
Walking Cycling Commutinga
(R2= 0.20) Leisure(R2= 0.12) Errands(R2= 0.14) Commuting a
(R2= 0.13) Leisure(R2= 0.11) Errands(R2= 0.16)
OR (95 % CI) OR (95 % CI) OR (95 % CI) OR (95 % CI) OR (95 % CI) OR (95 % CI) Individual and socio-demographic
Gender
Male Ref Ref Ref Ref Ref Ref
Female 1.06 (0.98–1.15) 1.12 (1.07–1.19) 1.08 (1.03–1.15) 0.62 (0.55–0.71) 0.47 (0.43–0.51) 0.77 (0.69–0.85) BMI (kg/m2) 0.99 (0.98–1.00) 0.98 (0.97–0.98) 0.99 (0.98–0.99) 0.96 (0.95–0.98) 0.98 (0.97–0.99) 0.96 (0.95–0.97) Education
<2y of university Ref Ref Ref Ref Ref Ref
≥2y of university 0.86 (0.80–0.93) 0.96 (0.91–1.01) 1.16 (1.11–1.22) 1.08 (0.94–1.25) 0.87 (0.80–0.94) 1.4 (1.27–1.56) Living with a partner
No Ref Ref Ref Ref Ref Ref
Yes 0.89 (0.83–0.97) 1.14 (1.08–1.21) 0.93 (0.88–0.99) 1.26 (1.09–1.45) 1.09 (0.99–1.21) 1.04 (0.93–1.16) Have a child at home under 14y
No Ref Ref Ref Ref Ref Ref
Yes 0.76 (0.70–0.82) 0.68 (0.64–0.72) 1.13 (1.06–1.19) 0.91 (0.80–1.04) 1.22 (1.10–1.34) 0.94 (0.84–1.05) Have a child at home between 14y and 18y
No Ref Ref Ref Ref Ref Ref
Yes 1.04 (0.95–1.14) 0.98 (0.92–1.05) 0.79 (0.74–0.85) 1.05 (0.89–1.23) 0.95 (0.85–1.07) 1.15 (1.01–1.31) Transit pass
No Ref Ref Ref Ref Ref Ref
Yes 4.06 (3.78–4.35) 0.96 (0.90–1.02) 1.32 (1.25–1.40) 0.90 (0.78–1.04) 1.02 (0.91–1.13) 0.94 (0.84–1.05) Work
No NR Ref Ref NR Ref Ref
Yes NR 1.12 (0.77–1.64) 1.34 (0.92–1.95) NR 0.42 (0.27–0.67) 2.61 (1.60–4.25) Parking at work No Ref NR NR Ref NR NR Yes 0.53 (0.50–0.57) NR NR 0.77 (0.68–0.86) NR NR Strenuous job No Ref NR NR Ref NR NR Yes 0.82 (0.73–0.92) NR NR 1.01 (0.82–1.23) NR NR
Models were adjusted for age, income, health perception, smoking status, leisure screen-time, city density population. Models with commuting as outcome were additionally adjusted on distance to work and time spent at work. Models with leisure and errands as outcome were additionally adjusted on working status NR not relevant
a
Wanner et al. found that 83 % of studies investigating the association between active transport and body weight re-ported at least some associations in the expected direction such as lower body weight [35].
More recently, in a nationally representative survey of U.K. residents (n = 12,796), Laverty et al. found negative associations for walking and cycling to work, assessed separately, with both lower BMI and likelihood of over-weight or obesity [26]. Our data extend these observations to the three domains of walking and cycling under study. Such data appear in line with the health benefits expected from increased walking and cycling in general and espe-cially for cardiovascular health outcomes [36, 37].
In line with our findings, in the study by Laverty et al., a negative association between education and walk-ing to work was reported [26]. Another findwalk-ing in our study was the positive association between education and both walking and cycling for errands. There is, however, no other study to which we could compare these data. Previous studies that examined education in relation with walking and cycling were focused on leisure or commuting, with overall mixed findings [13, 16, 26, 28, 29, 38, 39].
Our second research objective was to explore the interrelationships of walking and cycling domains as well as associations with LTPA.
Table 3 Interrelations between walking and cycling domains and relations with other types of physical activity
Walking Cycling
Commutinga Leisure Errands Commutinga Leisure Errands OR (95 % CI) OR (95 % CI) OR (95 % CI) OR (95 % CI) OR (95 % CI) OR (95 % CI) Individual and socio-demographic
Leisure-time physical activity
<1 h per week Ref Ref Ref Ref Ref Ref
1 h–2 h30 per week 0.96 (0.89–1.03) 1.23 (1.16–1.30) 1.11 (1.05–1.17) 1.26 (1.10–1.45) 1.54 (1.39–1.71) 1.51 (1.34–1.70) >2 h30 per week 0.89 (0.82–0.96) 1.53 (1.44–1.62) 1.14 (1.08–1.21) 1.49 (1.28–1.72) 1.80 (1.62–2.00) 1.88 (1.66–2.12) Domestic activities
<7 h per week Ref Ref Ref Ref Ref Ref
≥7 h per week 0.98 (0.92–1.05) 1.29 (1.23–1.35) 1.15 (1.09–1.20) 0.88 (0.79–0.99) 1.07 (0.99–1.16) 0.93 (0.85–1.02) Walking
Commuting
No NR Ref Ref Ref Ref Ref
Yes NR 1.12 (1.06–1.20) 2.37 (2.23–2.53) 1.02 (0.89–1.17) 0.82 (0.73–0.93) 0.72 (0.64–0.82) Leisure
No Ref NR Ref Ref Ref Ref
Yes 1.15 (1.08–1.23) NR 2.02 (1.93–2.12) 0.81 (0.71–0.91) 1.98 (1.83–2.14) 0.66 (0.60–0.73) Errands
No Ref Ref NR Ref Ref Ref
Yes 2.41 (2.26–2.57) 2.02 (1.96–2.12) NR 0.72 (0.64–0.81) 0.77 (0.71–0.84) 3.12 (2.85–3.43) Cycling
Commuting
No Ref Ref Ref NR Ref Ref
Yes 1.01 (0.88–1.16) 0.83 (0.74–0.93) 0.65 (0.61–0.76) NR 1.58 (1.38–1.80) 16.09 (14.23–18.19) Leisure
No Ref Ref Ref Ref NR Ref
Yes 0.81 (0.72–0.91) 1.94 (1.80–2.10) 0.78 (0.72–0.84) 2.06 (1.79–2.37) NR 10.89 (9.89–11.98) Errands
No Ref Ref Ref Ref Ref NR
Yes 0.76 (0.66–0.86) 0.65 (0.59–0.71) 2.97 (2.71–3.25) 14.77 (13.09–16.68) 10.69 (9.71–11.77) NR
Models were adjusted for age, income, health perception, smoking status, leisure screen-time, city density population. Models with commuting as outcome were additionally adjusted on distance to work and time spent at work. Models with leisure and errands as outcome were additionally adjusted on working status. NR: not relevant
a
Analyses were performed among workers only
An important finding in this study was that, except for walking for commuting, all domains of walking and cycling were positively associated with LTPA. Several studies have found positive associations between aggre-gated active transportation indicators and LTPA [15, 16]; however, data on walking or cycling examined separately are scarce. Recently, in the EPIC-Norfolk cohort, Sahlqvist et al. [22] found positive associations between leisure-time and utility cycling with LTPA, which is consistent with our results. For walking, detailed data on associations between specific domains and LTPA are lacking. Based on a large sample of Canadian adults, Butler et al. [13] reported a positive association between walking more than 6 h per week to work, school or errands and an LTPA index, in women only. If confirmed, the negative associ-ation between walking for commuting and LTPA found in this study could be an interesting extension of knowledge, suggesting that most, but not all, types of walking and cycling behaviours are part of an active lifestyle as indi-cated by higher levels of LTPA.
For walking and cycling separately, each domain was positively associated with the other domains studied (i.e., commuting, leisure, and errand). These results are in line with data from the CARDIA study where active commuting (walking and cycling taken together) was positively associated with walking for leisure, with significant ORs ranging from 1.96 to 5.62 [15]. The stronger associations found between cycling and walking may indicate that cycling represents a more homogeneous behavior (cyclists are involved in two or more domains) compared to walking. This suggests that interventions focused on one specific domain of cycling may help develop new healthy behaviors in the other domains.
Strengths and limitations
Strengths of this study include a large sample size allowing us assessment of walking and cycling practice across age groups in three different domains (commuting, leisure, errands) as well as interrelations between these domains. Some limitations must be noted, however. Missing values conducting a participant to be excluded from analyses were probably not missing at random, leading to a potential bias. Measures of walking and cycling were self-reported, which might introduce misclassification bias mostly because of documented over-reporting of physical activity [40]. Esti-mates of self-reported physical activity duration are subject to recall errors, social desirability bias and difficulties with correctly estimating the amount of individual walking and cycling behaviors. Whereas objective measures could provide more accurate data on activity patterns, subjective measures remain important because they provide domain-specific information [41]. Physical activity and travel behav-ior over the past four weeks were assessed over a period of 6 months and we did not take into account possible
seasonal variation. Our sample included proportionally more women and more individuals of high educational levels, as observed in general in volunteer-based studies [42] and participant behaviors were only assessed during half a year. Moreover, validation of the questionnaire was performed in a population aged from 20 to 65 years, which is different from our population study (age range 18–98 years), and domestic physical activities were assessed by only one single question. For these reasons extrapolation of these findings must be done cautiously. Finally, the cross-sectional design of this study does not allow causal inter-pretations of the results.
Conclusions
In this study, we showed that walking and cycling patterns across age groups and their socio-demographic/physical activity correlates may differ by domain, including com-muting, leisure and errands. Related public health implica-tions point to the need for intervenimplica-tions that take into account the age group of the target population. Interven-tions promoting walking for commuting would be prob-ably most relevant for young workers. LTPA was a strong correlate of walking and cycling. Although cause and effect relationships cannot be inferred from cross-sectional data, it shows that walking and cycling are indeed an integral part of an active lifestyle. Hence, promoting walking and cycling could provide health benefits through enhanced physical activity in general.
Competing interests
The authors declare that they have no competing interests. Authors’ contributions
Conceived and designed the experiments: JMO CS HC CW CE SH. Performed the experiments: HC JMO SH. Analyzed the data: MM. Wrote the paper: MM JMO. Involved in interpreting results and editing the manuscript: MM HC TF PS CE VAA SH CS JAN CP CS JMO. All authors read and approved the final manuscript. Acknowledgements
This work is part of the ACTI-Cités project (coordinator: JM Oppert) carried out with financial support from the French National Cancer Institute (Institut National du Cancer, INCa) through the Social sciences and humanities and public health programme (2011-1-PL-SHS-10).
The NutriNet-Santé cohort study is funded by the following public institutions: Ministère de la Santé, Institut de Veille Sanitaire (InVS), Institut National de la Prévention et de l’Education pour la Santé (INPES), Fondation pour la Recherche Médicale (FRM), Institut National de la Santé et de la Recherche Médicale, Institut National de la Recherche Agronomique (INRA), Conservatoire National des Arts et Métiers (CNAM) and Paris 13 University. Menai Mehdi was funded by a grant from Fondation Le Roch - Les Mousquetaires.
The funding sources played no role in the design and conduct of the study; the collection, management, analysis and interpretation of the data; or the preparation, review, and approval of the manuscript by coauthors.
The authors thank Younes Esseddik, Paul Flanzy, Mohand Ait Oufella, Yasmina Chelghoum, and Than Duong Van (computer scientists), Florence Charpentier (dietitian), Elise Martin (communication assistant), Nathalie Arnault, Véronique Gourlet, Fabien Szabo, Laurent Bourhis, and Stephen Besseau (statisticians), and Rachida Mehroug (logistics assistant) for their technical contribution to the NutriNet-Santé study.
Study registration: The NutriNet-santé study was registered under the EudraCT number 2013-000929-31.
Author details
1
Université Paris 13, Equipe de Recherche en Epidémiologie Nutritionnelle, Centre de Recherche en Epidémiologie et Statistiques, Inserm (U1153), Inra (U1125), Cnam, COMUE Sorbonne Paris Cité, Bobigny, F-93017, France.
2Department of Geography, Lab-Urba, Urbanism Institute of Paris, Paris-Est
Créteil University, Paris, France.3Laboratoire Image, Ville et Environnement, Université de Strasbourg, Strasbourg, France.4Department of Public Health,
Hôpital Avicenne (AP-HP), Bobigny, France.5CARMEN, Inserm U1060, Université de Lyon 1, Inra U1235, Lyon, France.6Department of Nutrition
Pitié-Salpêtrière Hospital (AP-HP), Institute of Cardiometabolism and Nutrition (ICAN), Université Pierre et Marie Curie-Paris 6, Paris, France.
Received: 8 July 2015 Accepted: 2 December 2015
References
1. Population-based approaches to increasing levels of physical activity. Geneva: World Health Organization; 2007.
2. Shephard RJ. Is active commuting the answer to population health? Sports Med. 2008;38(9):751–8.
3. Communities CE. Green Paper. From the Commission to the Council, the European Parliament, the European Economic and Social Committee and the Committee of the egions. Adapting to Climate Change in Europe– Options for EU Action. Brussels: Commission of the European Communities; 2007. 4. Allender S, Hutchinson L, Foster C. Life-change events and participation in
physical activity: a systematic review. Health Promot Int. 2008;23(2):160–72. doi:10.1093/heapro/dan012.
5. Biddle SJ, Fuchs R. Exercise psychology: A view from Europe. Psychology of Sport and Exercise. 2009;10(4):410–9.
6. Panter JR, Jones A. Attitudes and the environment as determinants of active travel in adults: what do and don't we know? J Phys Act Health. 2010;7(4): 551–61.
7. Heesch KC, Sahlqvist S, Garrard J. Gender differences in recreational and transport cycling: a cross-sectional mixed-methods comparison of cycling patterns, motivators, and constraints. Int J Behavioral Nutrition and Physical Activity. 2012;9:106. doi:10.1186/1479-5868-9-106.
8. Laverty AA, Palladino R, Lee JT, Millett C. Associations between active travel and weight, blood pressure and diabetes in six middle income countries: a cross-sectional study in older adults. Int J Behavioral Nutrition and Physical Activity. 2015;12(1):65. doi:10.1186/s12966-015-0223-3.
9. Ogilvie D, Mitchell R, Mutrie N, Petticrew M, Platt S. Personal and environmental correlates of active travel and physical activity in a deprived urban population. Int J Behavioral Nutrition and Physical Activity. 2008;5:43. doi:10.1186/1479-5868-5-43. 10. de Bruijn GJ, Kremers SP, Singh A, van den Putte B, van Mechelen W. Adult
active transportation: adding habit strength to the theory of planned behavior. Am J Prev Med. 2009;36(3):189–94. doi:10.1016/j.amepre.2008.10.019. 11. Jurj AL, Wen W, Gao YT, Matthews CE, Yang G, Li HL, et al. Patterns and
correlates of physical activity: a cross-sectional study in urban Chinese women. BMC Public Health. 2007;7:213. doi:10.1186/1471-2458-7-213. 12. Adams J. Prevalence and socio-demographic correlates of "active transport"
in the UK: analysis of the UK time use survey 2005. Prev Med. 2010;50(4): 199–203. doi:10.1016/j.ypmed.2010.01.006.
13. Butler GP, Orpana HM, Wiens AJ. By your own two feet: factors associated with active transportation in Canada. Can J Public Health. 2007;98(4):259–64. 14. Ogilvie F, Goodman A. Inequalities in usage of a public bicycle sharing
scheme: socio-demographic predictors of uptake and usage of the London (UK) cycle hire scheme. Prev Med. 2012;55(1):40–5. doi:10.1016/j.ypmed. 2012.05.002.
15. Gordon-Larsen P, Boone-Heinonen J, Sidney S, Sternfeld B, Jacobs Jr DR, Lewis CE. Active commuting and cardiovascular disease risk: the CARDIA study. Arch Intern Med. 2009;169(13):1216–23. doi:10.1001/archinternmed. 2009.163.
16. Hu G, Pekkarinen H, Hanninen O, Yu Z, Tian H, Guo Z, et al. Physical activity during leisure and commuting in Tianjin, China. Bull World Health Organ. 2002;80(12):933–8.
17. Rombaldi AJ, Menezes AM, Azevedo MR, Hallal PC. Leisure-time physical activity: association with activity levels in other domains. J Phys Act Health. 2010;7(4):460–4.
18. Hallal PC, Azevedo MR, Reichert FF, Siqueira FV, Araujo CL, Victora CG. Who, when, and how much? Epidemiology of walking in a middle-income country. Am J Prev Med. 2005;28(2):156–61. doi:10.1016/j.amepre.2004.10.012.
19. Sahlqvist S, Goodman A, Cooper AR, Ogilvie D. Change in active travel and changes in recreational and total physical activity in adults: longitudinal findings from the iConnect study. Int J Behavioral Nutrition and Physical Activity. 2013;10:28. doi:10.1186/1479-5868-10-28.
20. Silverwood RJ, Nitsch D, Pierce M, Kuh D, Mishra GD. Characterizing longitudinal patterns of physical activity in mid-adulthood using latent class analysis: results from a prospective cohort study. Am J Epidemiol. 2011;174(12):1406–15. doi:10.1093/aje/kwr266.
21. Yang L, Panter J, Griffin SJ, Ogilvie D. Associations between active commuting and physical activity in working adults: cross-sectional results from the Commuting and Health in Cambridge study. Prev Med. 2012;55(5): 453–7. doi:10.1016/j.ypmed.2012.08.019.
22. Sahlqvist S, Goodman A, Simmons RK, Khaw KT, Cavill N, Foster C, et al. The association of cycling with all-cause, cardiovascular and cancer mortality: findings from the population-based EPIC-Norfolk cohort. BMJ Open. 2013; 3(11):e003797. doi:10.1136/bmjopen-2013-003797.
23. Hercberg S, Castetbon K, Czernichow S, Malon A, Mejean C, Kesse E, et al. The Nutrinet-Sante Study: a web-based prospective study on the relationship between nutrition and health and determinants of dietary patterns and nutritional status. BMC Public Health. 2010;10:242. doi:10.1186/1471-2458-10-242. 24. Besson H, Brage S, Jakes RW, Ekelund U, Wareham NJ. Estimating physical
activity energy expenditure, sedentary time, and physical activity intensity by self-report in adults. Am J Clin Nutr. 2010;91(1):106–14. doi:10.3945/ajcn. 2009.28432.
25. Le Jeannic T, Armoogum J, Bouffard-Savary E, Couderc C, Courel J, Delisle F et al. Enquête nationale transports et déplacements. La Revue du CGDD; 2008. http://www.statistiques.developpement-durable.gouv.fr/transports/trv/ deplacement-mobilite/mobilite-reguliere-locale.html. Accessed 11 November 2015.
26. Laverty AA, Mindell JS, Webb EA, Millett C. Active travel to work and cardiovascular risk factors in the United Kingdom. Am J Prev Med. 2013; 45(3):282–8. doi:10.1016/j.amepre.2013.04.012.
27. Bopp M, Kaczynski AT, Campbell ME. Social ecological influences on work-related active commuting among adults. Am J Health Behav. 2013;37(4): 543–54. doi:10.5993/ajhb.37.4.12.
28. Agrawal AW, Schimek P. Extent and correlates of walking in the USA. Transp Res Part D: Transp Environ. 2007;12(8):548–63.
29. Ball K, Timperio A, Salmon J, Giles-Corti B, Roberts R, Crawford D. Personal, social and environmental determinants of educational inequalities in walking: a multilevel study. J Epidemiol Community Health. 2007;61(2): 108–14. doi:10.1136/jech.2006.048520.
30. Prillwitz J, Harms S, Lanzendorf M. Impact of life-course events on car ownership. Transportation Research Record. J Transp Res Board. 2006; 1985(1):71–7.
31. Yamamoto T. The impact of life-course events on vehicle ownership dynamics: The cases of france and Japan. IATSS Res. 2008;32(2):34–43. 32. Menai M, Fezeu L, Charreire H, Kesse-Guyot E, Touvier M, Simon C, et al.
Changes in sedentary behaviours and associations with physical activity through retirement: a 6-year longitudinal study. PLoS ONE. 2014;9(9): e106850. doi:10.1371/journal.pone.0106850.
33. Touvier M, Bertrais S, Charreire H, Vergnaud AC, Hercberg S, Oppert JM. Changes in leisure-time physical activity and sedentary behaviour at retirement: a prospective study in middle-aged French subjects. Int J Behavioral Nutrition and Physical Activity. 2010;7:14. doi:10.1186/1479-5868-7-14.
34. Murtagh G, O Connell J, O Connell E, Tallon E, Watson C, Gallagher J, et al. Importance of risk factor management in diabetic patients and reduction in Stage B heart failure. QJM. 2015;108(4):307–14. doi:10.1093/qjmed/hcu189. 35. Wanner M, Gotschi T, Martin-Diener E, Kahlmeier S, Martin BW. Active
transport, physical activity, and body weight in adults: a systematic review. Am J Prev Med. 2012;42(5):493–502. doi:10.1016/j.amepre.2012.01.030. 36. Hamer M, Chida Y. Active commuting and cardiovascular risk: a
meta-analytic review. Prev Med. 2008;46(1):9–13. doi:10.1016/j.ypmed.2007.03.006. 37. Oja P, Titze S, Bauman A, de Geus B, Krenn P, Reger-Nash B, et al. Health
benefits of cycling: a systematic review. Scand J Med Sci Sports. 2011;21(4): 496–509. doi:10.1111/j.1600-0838.2011.01299.x.
38. Hearst MO, Sirard JR, Forsyth A, Parker ED, Klein EG, Green CG, et al. The relationship of area-level sociodemographic characteristics, household composition and individual-level socioeconomic status on walking behavior among adults. Transp Res A Policy Pract. 2013;50:149–57. doi:10.1016/j.tra. 2013.01.006.
39. Panter J, Griffin S, Dalton AM, Ogilvie D. Patterns and predictors of changes in active commuting over 12 months. Prev Med. 2013;57(6):776–84. doi:10.1016/j.ypmed.2013.07.020.
40. Shephard RJ. Limits to the measurement of habitual physical activity by questionnaires. Br J Sports Med. 2003;37(3):197–206. discussion. 41. Ainsworth B, Cahalin L, Buman M, Ross R. The current state of physical
activity assessment tools. Prog Cardiovasc Dis. 2015;57(4):387–95. doi:10.1016/j.pcad.2014.10.005.
42. Kesse-Guyot E, Peneau S, Mejean C, Szabo de Edelenyi F, Galan P, Hercberg S, et al. Profiles of organic food consumers in a large sample of French adults: results from the Nutrinet-Sante cohort study. PLoS One. 2013;8(10): e76998. doi:10.1371/journal.pone.0076998.
• We accept pre-submission inquiries
• Our selector tool helps you to find the most relevant journal
• We provide round the clock customer support
• Convenient online submission
• Thorough peer review
• Inclusion in PubMed and all major indexing services
• Maximum visibility for your research Submit your manuscript at
www.biomedcentral.com/submit