HAL Id: halshs-02515994
https://halshs.archives-ouvertes.fr/halshs-02515994
Submitted on 23 Mar 2020
HAL is a multi-disciplinary open access
archive for the deposit and dissemination of
sci-entific research documents, whether they are
pub-lished or not. The documents may come from
teaching and research institutions in France or
abroad, or from public or private research centers.
L’archive ouverte pluridisciplinaire HAL, est
destinée au dépôt et à la diffusion de documents
scientifiques de niveau recherche, publiés ou non,
émanant des établissements d’enseignement et de
recherche français ou étrangers, des laboratoires
publics ou privés.
What lessons can be learned from capital income tax
reforms?
Laurent Bach, Antoine Bozio, Brice Fabre, Arthur Guillouzouic, Claire Leroy,
Clément Malgouyres
To cite this version:
Laurent Bach, Antoine Bozio, Brice Fabre, Arthur Guillouzouic, Claire Leroy, et al.. What lessons
can be learned from capital income tax reforms?. 2019. �halshs-02515994�
IPP Policy Briefs # 46 October 2019 Laurent Bach Antoine Bozio Brice Fabre Arthur Guillouzouic Claire Leroy Clément Malgouyres www.ipp.eu
The Institut des Politiques Publiques (IPP) has been developed through a scientific partner-ship between the Paris School of Economics (PSE) and the Centre for Research in Eco-nomics and Statistics (CREST). IPP’s aim is to
INCOME TAX REFORMS?
The abolition of the flat-rate withholding tax (prélèvement forfaitaire libératoire - PFL) in 2013 and the introduction of the unique flat tax (prélèvement forfaitaire unique - PFU) in 2018 are two important–and contrary–capital income tax reforms. The first aimed to “restore tax justice” while the second aimed to “promote private investment”. Using the tax data of households and companies, we evaluate the impact of the 2013 reform and present preliminary findings regarding the impact of the 2018 reform. We find raising cap-ital income taxes to have a strong negative impact on dividends received by households, and no impact on other types of income (pay, capital gains and other capital income). Using company data, we identify the mechanism explaining this decrease in dividends received: companies directly controlled by natural persons residing in France reduced or stopped the distribution of dividends between 2013 and 2017. We observe an increase in the financial assets held by these companies, an increase in equity capital and a decrease in net result, but no effect on investment. The implications of these findings are major: the 2013 reform led to a net loss in tax receipts but had no negative impact on investment. Based on data from commercial court registries, there was a 15.3% increase in dividends paid in 2018, attributable to the unique flat tax reform. This increase in the distribution of dividends, parallel to the decrease in 2013, will lead to greater tax receipts than initially anticipated. However, in light of the effects of the 2013 reform, it appears unlikely that this reform will have a positive effect on private investment.
The 2013 reform abolishing the flat-rate withholding tax led to a 40% decrease in declared dividends, but no change in other types of household income.
Companies controlled directly by natural persons stopped the distribution of dividends and accumulated more financial assets. We also observe an increase in equity and a decrease in net result.
The 2013 reform did not have negative effects on investment. The finding that dividend taxation does not affect investment is corroborated by studies of American and Swedish data. The 2013 reform projected e400 million in tax receipts, but after factoring in the observed
be-havioural reactions, it led to a loss ofe900 million in income tax and social security contribution receipts.
The introduction of the unique flat tax in 2018 led to a 15% increase in dividends paid. If social security contributions are included, the unique flat tax would result in a cost to the public finances ofe400 million in 2018, compared to e900 million if behavioural reactions are not factored in.
In light of the effects measured in 2013, the unique flat tax reform is unlikely to lead to an increase in private investment.
IPP Policy Brief # 46
What lessons can be learned from capital income tax reforms?
When François Hollande announced the measure of abol-ishing the flat-rate withholding tax as part of his pro-gramme, the aim was to “restore tax justice” by taxing cap-ital income like earned income according to the progres-sive income tax schedule. In 2017, Emmanuel Macron’s programme announced a measure to implement a unique flat tax of 30% in order to “promote private investment”. What can be said of the concrete implementation of these objectives?
Thanks to high-quality administrative data made available to researchers by the French General Directorate of Public Finances (Direction générale des Finances publiques -DGFiP), it is now possible to evaluate the impact of these reforms. We present here the summary results of a first study based on the tax data of households and companies, commissioned by the Finance Committee of the French Senate.
2013 and 2018 reforms
In 2012, French taxpayers had the choice, for the taxa-tion of capital income, between being taxed according to the progressive income tax schedule–the default option– and being taxed at a fixed rate with the flat-rate withhold-ing tax. The option was only advantageous for taxpaywithhold-ing households in higher income tax brackets.
In 2013, the flat-rate withholding tax option was abol-ished and capital income (dividends and interest) were once again taxed according to the income tax schedule. This increased the top marginal rate of tax on dividends by 2.5 per cent between 2012 and 2013, from 57.6% to 60.1%. In 2018, the unique flat tax was introduced by the Finance Law for 2018, at the rate of 12.8%, which, when combined with the social security contributions of 17.2%, raised the rate to 30%. This lowered the top marginal tax rate by 6.8 per cent, from 60.1% in 2017 to 53.3% in 2018 (see Box1).
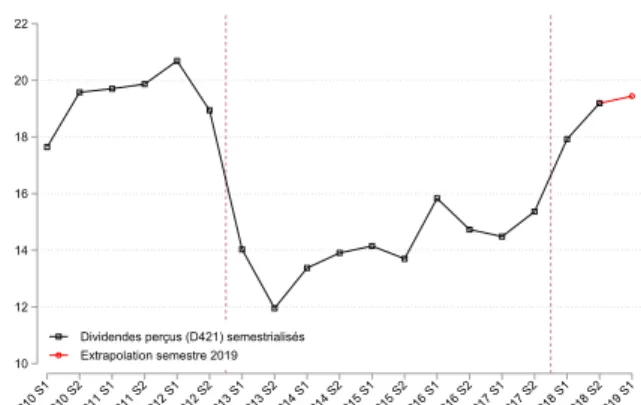
Graph1presents the aggregate data from the national ac-counts available up to the first half of 2019. We observe a massive drop in total dividends received by households in 2013, the first year in which this income was taxed ac-cording to the income tax schedule (decrease of e13.6 billion from the previous year), and a sharp rise in 2018, the first year affected by the introduction of the unique flat tax (increase of e7.3 billion). Changes in dividends depend first and foremost on company profits, which vary considerably according to the economic situation, and it is impossible to draw conclusions on the impact of the tax reforms based solely on these changes in the economic
context.
Figure 1: Changes in dividends received by households – national accounts 10 12 14 16 18 20 22 2010 S12010 S22011 S12011 S22012 S12012 S22013 S12013 S22014 S12014 S22015 S12015 S22016 S12016 S22017 S12017 S22018 S12018 S22019 S1
Dividendes perçus (D421) semestrialisés Extrapolation semestre 2019
Source: National accounts, INSEE; authors’ calculation for 2019.
Impact evaluation methodology
To evaluate the impact of the capital income tax reforms, a counterfactual scenario must be established, i.e., the case of households or companies not affected by the reforms, in order to estimate the causal effect of these reforms sep-arate from the economic situation. Access to individual data makes it possible to use this type of methodology.
The data used
This study is based on new data. We use the data from the panel of income tax returns available to researchers since July 2019. The data provide all of the information pertain-ing to all tax households subject to income tax. Because each tax household is represented by an identifier that remains the same year to year, the tax households can be monitored over time. This access is obtained through the procedures of the Statistical Confidentiality Commit-tee and the technical resources of the Centre for Secure Access to Data (CASD), ensuring strict compliance with the protection of personal data.
In addition to household tax data, we also use exhaus-tive data from company tax files provided by the DGFiP, INSEE data on the earnings of the self-employed (self-employment database), data on company accounts from the commercial court registries, information on financial relations between companies, and business data on the composition of their shareholder bodies.
Lastly, we use the TAXIPP microsimulation model devel-oped at the IPP. This model simulates the entire French tax
The decade from 2008 to 2018 was characterised by numerous dividend tax reforms.
2008 reform.. The introduction of flat-rate withholding tax for
dividends offered the option of taxation at a flat rate of 18%, which, when combined with the social security contributions of 11% and the corporate tax rate of 33.3%, brought the top marginal rate to 52.6%.
2011 and 2012 increases in flat-rate withholding tax In 2011
and 2012, the rate of social security contributions rose from 12.1% to 15.5%, and the flat-rate withholding tax rate went from 18% to 21%. Thus, the top marginal rate of tax on dividends (with the flat-rate withholding tax) rose 4.2 per cent over this period, from 53.4% to 57.6%.
2013 reform. With the abolition of the flat-rate withholding tax,
dividends were once again taxed according to the progressive income tax schedule, with a new 45% tax bracket. The top marginal rate of tax on dividends rose 2.5 per cent between 2012 and 2013, from 57.6% to 60.1%.
2018 reform. Flat-rate taxation of dividends was reintroduced in
2018 with the creation of the unique flat tax at 12.8%, which, when combined with the social security contributions of 17.2%, brought the rate to 30%. This reform constitutes the largest vari-ation in dividend taxes over the decade. The top marginal tax rate decreased 6.8 per cent in 2018, from 60.1
Marginal tax rate of dividends
Création du PFL (18%) Hausse du taux sup. à 41% PFL à 19% PFL à 21% Création de la tranche à 45% Suppression du PFL Créationdu PFU 50 52 54 56 58 60 62 64
Taux marginal (en pourcentage)
2007 2008 2009 2010 2011 2012 2013 2014 2015 2016 2017 2018 Taxation forfaitaire
Taxation barème
Notes: For a given test case, the graph shows the changes in the marginal rate of tax on dividends for two options: either declaring dividends to be taxed accord-ing to the progressive income tax schedule, or the flat-rate withholdaccord-ing tax not subject to income tax. In both cases, the marginal rate includes corporate tax at the standard rate. The test case shown corresponds to a household whose net taxable income places it in the 45% tax bracket, but which is not subject to the exceptional contribution on high income. Sources: IPP schedules; TAXIPP 1.0.
Box 1: Dividend tax reforms (2008-2018)
Box 1: Dividend tax reforms (2008-2018)
and social security system applied to administrative data, and can be used to precisely identify the impact on each French household of different variations in capital income taxes.1
The difference in differences method
The method used to determine the causal impact of the 2013 reform consists in comparing two groups of tax households or companies, before and after the reform. One group, said to have been “treated”, contains taxpay-ers liable to be affected by the reform, whereas the control group is made up of taxpayers who are not affected. This technique, called the difference in differences method, is based on comparing the difference between the treat-ment and control groups before and after the reform. To check the method’s relevance for drawing robust conclu-sions, it must be verified that the two groups follow simi-lar trend lines before the reform and only diverge after its implementation.
With the household tax data, we utilise the fact that a pro-portion of the households in the higher income tax
brack-1Documentation on the TAXIPP model is available on the IPP
web-site:https://www.ipp.eu/methodes/taxipp-outils/.
ets had not chosen the flat-rate withholding tax option for their dividends. As they were taxed according to the income tax schedule before and after the reform, these households are not affected by the tax change. Con-versely, the households that did opt for flat-rate with-holding tax before the reform saw their rate of tax on dividends increase after the flat-rate withholding tax was abolished.
The company tax data does not tell us which shareholders were taxed according to which system (the flat-rate with-holding tax or income tax schedule) before the reform. However, we can distinguish between companies wholly-owned by natural persons in 2011–and thus liable to be affected by the change in capital income tax–and those owned by legal persons or with a minority of natural-person shareholders unable to directly decide how profits are distributed. We apply the same difference in differ-ences methodology to these two groups of companies.
Taking account of the other 2013 reforms
The 2013 reform that abolished the flat-rate withhold-ing tax option was concomitant with other tax changes. The introduction of 75% tax on remuneration for work in
IPP Policy Brief # 46
What lessons can be learned from capital income tax reforms?
excess ofe1 million was studied by Guillot (2019), who shows the significant optimisation effects brought about by the reform. Also introduced in 2013 was an anti-abuse clause concerning managing directors of limited liability companies (SARL) in which they hold a majority stake, re-quiring their dividends to be taxed as pay. Boissel and Matray (2019) reveal a sharp decrease in dividends paid by these companies2.
In this study, we aim to isolate the effect of the abolition of final taxation of source (the flat-rate withholding tax) from other tax reforms, e.g., by excluding from our sample lim-ited liability companies in which the managing directors hold a majority stake, and by excluding households having opted for the tax provisions reserved for said managing di-rectors. It is important to note, however, that the multiple reforms implemented in 2013 may have been perceived as a package or based on announcements made during the 2012 presidential campaign, and therefore may also play a role in the effects measured in this study.
Evaluation of the 2013 reform
Measuring the impact on household income
Based on the exhaustive income tax statement data, we estimate the impact of applying the schedule for capital income to declared income. To obtain comparable groups of taxpayers, we consider a sample of high-income house-holds regularly receiving significant dividends before the reform. Graph2ashows the change in dividends received by the households in the treatment and control groups. The upward trend is similar in both groups before the reform but diverges sharply after it, with a more signifi-cant decrease in the treatment group, i.e., for households which before 2013 had opted for the flat-rate withholding tax. Graph 2bshows the estimated difference in differ-ences corresponding to the previous graph. We obtain a strongly negative impact of the 2013 reform on dividends, with a 40% decrease in declared dividends.
2Other studies are also in progress to evaluate the 2013 reforms,
no-tably those by Aghion et al. (2019) and Lefèbvre et al. (2019).
Figure 2: Impact of the 2013 reform on household income
(a) Evolution of perceived dividends in treatment and control groups -4 -3 -2 -1 0 Log. dividendes 2008 2009 2010 2011 2012 2013 2014 2015 2016 2017 Traitement Contrôle
(b) Impact estimates – perceived dividends
-1.25 -1 -.75 -.5 -.25 0 .25 .5
Coef. log. dividendes
2008 2009 2010 2011 2012 2013 2014 2015 2016 2017
(c) Impact estimates – other capital income
-1.25 -1 -.75 -.5 -.25 0 .25 .5
Coef. log. revenus des valeurs mobilières hors dividendes
2008 2009 2010 2011 2012 2013 2014 2015 2016 2017
Notes: The estimated difference in differences compares households receiving dividends in 2012, according to whether they opted for flat-rate withholding tax (treatment group) or taxation according to the income tax schedule (control group).
Sources: POTE panel study files, 2008-2017.
Performing the same estimate on other types of declared household income (pay, capital gains, and other income from securities), we find no impact of the reform in these cases. Graph2cshows the impact on interest income or other fixed-yield income, for which no effect is detected.
“The abolition of flat-rate withholding tax led to a 40% de-crease in dividends received by households, but no varia-tion in other types of income, pay or other capital income.” It is important to note that our control group also saw a decrease in dividends received, reflecting possible
rect effects of the reform–a tax household in the control group may in fact hold shares in companies for which the majority of the shareholders are affected by the reform– or the impact of other measures introduced, such as the 45% tax bracket. Our measurement of the reaction of treated households does not take account of these other effects, which may also affect declared income.
Understanding dividends’ strong reaction to
taxes: contribution of company data
Thus, dividends received by households dropped signifi-cantly as a result of the 2013 reform. Understanding the mechanism behind this massive drop is essential in order to be able to draw conclusions on the effects of other tax reforms. From a theoretical perspective, households may react to a raise in capital tax by decreasing their savings ratio, by changing the composition of their assets, or, as shareholders, by impacting the profit distribution policy. Based on the company tax data, using the difference of differences method, we estimate the impact of applying the capital income tax schedule to dividends paid and companies’ room for margin in decision-making. We de-fine the treatment group as all companies wholly-owned by natural persons in 2011, and the control group as all companies with mixed ownership3.
Graph3ashows the change in dividends paid in our treat-ment and control groups. The trends are parallel before the reform, and in 2013, a clear break in trend can be seen solely in the treatment group. The difference of differ-ences estimation is shown in graph3b. The ratio of divi-dends paid to equity goes down by around 1.6 cents (per euro of equity) in the treatment group, i.e. 20.7% of the pre-reform average. A significant part of this effect comes from the probability of paying dividends which decreases by 7 per cent in the treatment group (i.e. 17% lower than the pre-form average). The estimated effect on compa-nies is lower than for households because only a portion of the companies in the treatment group are actually af-fected by the reform.
3Companies in which no legal-person shareholder holds more than
95% of the shares, and in which any natural-person shareholders collec-tively own less than 50% of the capital.
Figure 3: Impact of the 2013 reform in company accounts
(a) Dividends paid by treatment vs control group
.06 .08 .1 .12
Dividendes par euro de capitaux propres
2008 2009 2010 2011 2012 2013 2014 2015 2016 Traitement Contrôle
(b) Impact estimates – dividends paid
-.02 -.01 0 .01 .02 Coefficient 2008 2009 2010 2011 2012 2013 2014 2015 2016
(c) Impact estimates – investment
-.06 -.04 -.02 0 .02 .04 .06 Coefficient 2008 2009 2010 2011 2012 2013 2014 2015 2016
Notes: For panels a) and b), the variable studies is the amount of dividends paid divided by the company’s level of equity in 2011. For panel c), investment corresponds to the variation in tangible and intangible assets.
Sources: BIC-RN, FDG, LIFI, DADS Postes, Self-employment database files.
“The 2013 reform led to a sharp decrease in dividends paid by companies wholly-owned by natural persons, but had no negative impact on investment.”
Graph3cshows the effect of the 2013 reform on com-pany investment: there is no apparent negative im-pact. This finding contradicts traditional economic theory which posits that companies’ marginal investments are fi-nanced by issuing new shares, and should therefore be negatively impacted by the taxation of dividends. These findings on French data are however similar to findings in other countries where dividend tax reforms have been in-troduced, such as the 2003 reform in the United States
IPP Policy Brief # 46
What lessons can be learned from capital income tax reforms?
(Yagan, 2015) or Sweden’s 2006 reform (Alstadsæter et al., 2017).
To understand all of the ways in which companies reacted to the 2013 reform, we estimate the impact of the reform on the different components of company accounts.
Figure 4: Breakdown of the impact of the 2013 reform on company accounts 0,0 0,5 1,0 1,5 2,0 2,5 3,0 3,5 4,0 Ressources Emplois Baisse des dividendes Emission de fonds propre Dette Dépenses discrétionnaires Baisse du résultat net Actifs financiers
Notes: This graph shows the regression coefficients of the double difference esti-mates for each company accounts variable. These coefficients are interpreted as the effects of the 2013 reform in cents per euro of equity in 2011.
Sources: BIC-RN, FDG, LIFI, DADS Postes, Self-employment database files.
Graph4shows these effects, distinguishing between im-pacts on company resources (cash inflow) and on employ-ment (use of funds). In terms of resources, in addition to the decrease in dividends paid, we find a positive ef-fect on company equity, suggesting that their sharehold-ers also transferred psharehold-ersonal resources to their compa-nies. In terms of employment, we find a negative impact on the net result, suggesting higher intermediate con-sumption, which may be the result of either intangible in-vestments or additional personal spending. Lastly, there is an increase in company assets (liquid and other finan-cial assets), suggesting a form of “encapsulation” of undis-tributed profits.
Introduction of the unique flat tax in
2018: what effects can be expected?
A first ex post evaluation
Analysing the impact of introducing the unique flat tax is limited by the available data: we have access to tax data only up to 2016. We therefore use the data from the commercial court registries for the years 2017 and 2018. Moreover, a single year of post-reform decrease
is not enough to detect certain potential effects of the re-form.
Figure 5: Impact of introducing the unique flat tax on distribution of company dividends
-.03 -.02 -.01 0 .01 Coefficient 2008 2010 2012 2014 2016 2018
Notes: The graph shows the regression coefficients obtained using the difference of differences dynamic, taking as the dependent variable the dividends paid per euro of fixed equity in 2011. All companies in the treatment group or the control group are companies that were present in 2011 and 2012 and have fiscal years ending on 31 December. Companies included in the treatment group were wholly-owned by natural persons in 2011 and in 2016.
Sources: Registry of trade and companies, BIC-RN, FDG, LIFI, DADS Postes, Self-employment database files.
Nevertheless, based on the available data for 2018, we find a positive causal effect of the reform on the distri-bution of dividends. Graph 5 illustrates this rise in divi-dends paid in 2018 for the sample of companies present in 2011 and also affected by the 2013 reform. We find a significant rise in both the proportion of companies pay-ing dividends (+3.5 per cent) and the both amount paid (+6 cents per euro of results). This rise in dividends is associated with a decrease in company assets, suggest-ing that the reform stimulated the reallocation of capital into the economy, with affected companies reducing their cash situation.
What lessons can be learned?
The first takeaway from this study is that there are strong behavioural responses to dividend taxes. The feedback channel is primarily in the name of tax optimisation: tax-payers affected by the rise in dividend taxes preferred to stop distributing their companies’ profits to avoid the higher taxes between 2013 and 2017.
“The strong behavioural responses to dividend taxes are primarily in the name of tax optimisation.”
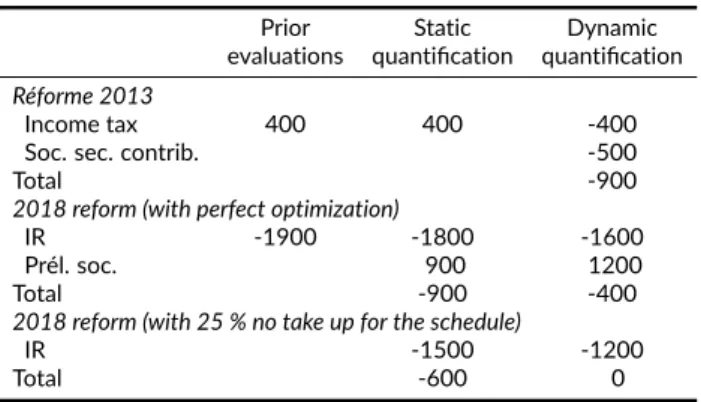
These optimisation behaviours had significant effects on tax receipts. Table1compares static estimates to dynamic
A growing gap between tax on dividends and wages. The graph
opposite shows the change in the top marginal rate of tax on wages and dividends, factoring in all contributions. Throughout the entire period, tax on wages (including retirement contribu-tions) is significantly higher than tax on dividends. If retirement contributions are considered deferred wages, the rate of tax on wages is close to the taxation of dividends up to 2017. The introduction of the unique flat tax leads to a greater difference in the taxation of the two forms of income, which goes from -1.7 to +6.4 per cent. The scheduled decrease in corporate tax up to 2022 will further increase this difference, bringing it to 10.1 per cent.
The Nordic countries’ experience. The introduction of a flat-rate
withholding tax on capital income in the 1990s led to multiple studies revealing the resulting conversion of earned income into dividends (Alstadsæter and Jacob, 2016; Harju and Matikka, 2016).
Impact of the 2013 reform. We estimate the impact of raising the
tax on dividends (relative to pay) in 2013, but detect no effect of pay being substituted for dividends. This finding can be explained by the fact that, from a fiscal perspective, the incentive to provide compensation in the form of pay–which is taxed at a higher rate– remains low in the French context.
Taux marginal d’imposition des dividendes et des salaires
PFL à 19% PFL à 21% Création de la tranche à 45% Suppression du PFL Création du PFU 35 40 45 50 55 60 65 70 75 80
Taux marginal (en pourcentage)
2008 2010 2012 2014 2016 2018 2020 2022
Dividendes
Salaires (hors cotis. retraites) Salaires
Notes: The marginal rates shown are applied to super-gross income. They corre-spond to the case of an executive with annual taxable income between four and eight times the social security ceiling. The marginal rate on dividends includes corporate tax, social security contributions and income tax (assuming that the person elects the flat-rate withholding tax option). The marginal rate on pay in-cludes social security contributions and income tax. The projections for 2019 to 2022 are calculated based on the announced corporate tax rates and the as-sumption that the rest of the tax conditions remain unchanged.
Sources: IPP schedule: TAXIPP 1.0.
Box 2: Income shifting phenomena
Box 2: Income shifting phenomena
estimates, i.e. taking account of behavioural responses measured ex post. Whereas on the static estimate, the 2013 reform should have generated e400 million in in-come tax receipts, factoring in behavioural responses pro-duces a negative estimate ofe400 million. Including the impact of social security contributions brings the estimate to -e900 million. Conversely, the rise in dividend distri-bution in 2018 following introduction of the unique flat tax lowers the tax’s estimated cost to the public finances. Combining the impact on receipts from income tax and social security contributions, we find a cost to the public finances ofe400 million, compared to e900 million in the static estimate. This estimate does not take into account future effects on other tax bases such as earned income and capital gains, the effects of which remain uncertain at present (see Box2).
A second type of behavioural response liable to affect re-ceipts from the unique flat tax is the taxpayers’ choice of option. The choice of making the unique flat tax the de-fault option could lead to a large number of taxpayers not choosing the tax schedule, even though it would likely be to their advantage. If we make the assumption that 25% of taxpayers liable to benefit from choosing the tax sched-ule stay with the default option of the unique flat tax,
then, according to our estimates, the introduction of the unique flat tax would be neutral for the public finances. The final lesson from this study concerns the real eco-nomic effects, beyond tax optimisation behaviours. The finding that raising taxes on capital income in 2013 did not affect investments, confirming similar effects on Ameri-can and Swedish data, implies that introducing preferen-tial taxation of capital income is unlikely to have positive effects on private investment. The future tax data for 2018 and 2019 will provide more substantive information on this question.
Authors
Laurent Bach, Head of the “Companies” programme at
IPP, assistant professor at ESSEC Business School.
Antoine Bozio, Director of IPP, associate professor at PSE
and lecturer at EHESS.
Brice Fabre, Head of the “Taxation” programme at IPP. Arthur Guillouzouic, Economist at IPP.
Claire Leroy, Economist at IPP.
IPP Policy Brief # 46
What lessons can be learned from capital income tax reforms?
Table 1:Tax receipts of capital income tax reforms (in millions of euros)
Prior Static Dynamic
evaluations quantification quantification
Réforme 2013
Income tax 400 400 -400
Soc. sec. contrib. -500
Total -900
2018 reform (with perfect optimization)
IR -1900 -1800 -1600
Prél. soc. 900 1200
Total -900 -400
2018 reform (with 25 % no take up for the schedule)
IR -1500 -1200
Total -600 0
Notes: This table shows the estimated tax receipts of each reform studied (with a negative figure representing a budgetary cost to the public finances). The dynamic quantification was produced using TAXIPP 1.0, based on impact estimates carried out for each reform. The quantification of social security contributions for the 2018 reform only takes into account variations in social security contributions associated with capital income subjected to the unique flat tax, as income tax. Forms of capital income not subject to income tax (e.g. life insurance) are not taken into account. The quantification “with perfect optimisation” assumes that households choose the optimal option between being taxed according to the tax schedule or the unique flat tax. The quantification with 25% non-election of the tax schedule assumes that 25% of households that would benefit from choosing to be taxed according to the tax schedule do not choose this option. Source: Prior evaluations of the 2013 draft budget law (PLF), p.39; Prior evaluations of the 2018 draft budget law (PLF), p.103; TAXIPP 1.0 for the static and dynamic quantifications. The prior evaluation estimates correspond to long-term effects of the reforms and may differ from the associated effects the year the reform is introduced.
Reference study
This policy paper is based on a study published in French in the form of an IPP Report and an academic working paper in English:
Bach, Laurent, Antoine Bozio, Brice Fabre, Arthur Guillouzouic, Claire Leroy, and Clément Malgouyres (2019a). “Évaluation d’impact de la fiscalité des dividendes.” Rapport IPP 25.
Bach, Laurent, Antoine Bozio, Brice Fabre, Arthur Guillouzouic, Claire Leroy, and Clément Malgouyres (2019b). “Follow the Money! Combining Household and Firm-Level Evidence to Unravel the Tax Elasticity of Dividends.” Document de travail PSE.
Other references
Aghion, Philippe, Vlad Ciornohuz, Maxime Gravoueille, and Stephanie Stantcheva (2019). “Reforms and Dy-namics of Income: Evidence Using New Panel Data.” mimeo Harvard et Collège de France.
Alstadsæter, Annette and Martin Jacob (2016). “Dividend Taxes and Income Shifting.” The Scandinavian Journal of Economics 118.4, pp. 693–717.
Alstadsæter, Annette, Martin Jacob, and Roni Michaely (2017). “Do dividend taxes affect corporate invest-ment?” Journal of Public Economics 151, pp. 74–83. Boissel, Charles and Adrien Matray (2019). “As Uncertain
as Taxes: Taxing Entrepreneurs in France.” mimeo HEC-Princeton.
Guillot, Malka (2019). “Who Paid the 75% Tax on Million-aires? Optimization of Salary Incomes and Incidence in France.” mimeo ETH Zürich.
Harju, Jarkko and Tuomas Matikka (Aug. 2016). “The elas-ticity of taxable income and income-shifting: what is “real” and what is not?” International Tax and Public Fi-nance 23.4, pp. 640–669.
Lefèbvre, Marie-Noëlle, Étienne Lehmann, and Michaël Sicsic (2019). “Evaluation de la mise au barème des revenus du capital : premiers résultats.” Travail en cours – CRED-TEPP.
Yagan, Danny (2015). “Capital tax reform and the real economy: The effects of the 2003 dividend tax cut.” American Economic Review 105.12, pp. 3531–63.