HAL Id: inserm-01493136
https://www.hal.inserm.fr/inserm-01493136
Submitted on 21 Mar 2017
HAL is a multi-disciplinary open access
archive for the deposit and dissemination of
sci-entific research documents, whether they are
pub-lished or not. The documents may come from
teaching and research institutions in France or
abroad, or from public or private research centers.
L’archive ouverte pluridisciplinaire HAL, est
destinée au dépôt et à la diffusion de documents
scientifiques de niveau recherche, publiés ou non,
émanant des établissements d’enseignement et de
recherche français ou étrangers, des laboratoires
publics ou privés.
Prenatal and post-natal cost of small for gestational age
infants: a national study
Alicia Marzouk, Antoine Filipovic-Pierucci, Olivier Baud, Vassilis Tsatsaris,
Anne Ego, Marie-Aline Charles, François Goffinet, Danièle Evain-Brion,
Isabelle Durand-Zaleski
To cite this version:
Alicia Marzouk, Antoine Filipovic-Pierucci, Olivier Baud, Vassilis Tsatsaris, Anne Ego, et al.. Prenatal
and post-natal cost of small for gestational age infants: a national study. BMC Health Services
Research, BioMed Central, 2016, 17 (1), pp.221. �10.1186/s12913-017-2155-x�. �inserm-01493136�
R E S E A R C H A R T I C L E
Open Access
Prenatal and post-natal cost of small for
gestational age infants: a national study
Alicia Marzouk
1,2*, Antoine Filipovic-Pierucci
1, Olivier Baud
2,3, Vassilis Tsatsaris
2,4, Anne Ego
5, Marie-Aline Charles
2,10,
François Goffinet
2,6, Danièle Evain-Brion
2and Isabelle Durand-Zaleski
1,2,7,8,9Abstract
Background: Small for gestational age (SGA) infants are at increased risk for preterm birth morbidities as well as a range of adverse perinatal outcomes that result in part from associated premature birth. We sought to evaluate the costs of SGA versus appropriate for gestational age (AGA) infants in France from pregnancy through the first year of life and separate the contributions of prematurity from the contribution of foetal growth on costs.
Methods: This is a cross-sectional population-based study using national hospital discharge data from French public and private hospitals. SGA infants were defined as newborns with a birth weight below the 10th percentile of French intrauterine growth curves adjusted for foetal sex. AGA infants were defined as newborns with a birth weight between the 25th and the 75th. All births were selected between January 1st, 2011 and December 31st, 2011. Costs were calculated from the hospital perspective for both mothers and children using their diagnostic related group and the French national cost study. Hospital outcomes were extracted from the database and compared by gestational age and mode of delivery.
Results: Of 777,720 total births in 2011, 84,688 SGA births (10.9%) and 395,760 AGA births (50.8%) were identified. After adjustment for gestational age, the cost for an SGA infant was€2,783 higher than for an AGA infant. The total maternal and infant hospital cost of SGA in France was estimated at 23% the total cost for deliveries. The high cost is explained by higher complication rates, more frequent hospital readmissions and longer lengths of stay.
Conclusions: Being small for gestational age is an independent contributor to 1-year hospital costs for both mothers and infants.
Keywords: Small for gestational age, Database, Economic cost, Prematurity Background
Small for gestational age (SGA) infants are defined by a birth weight lower than the 10th percentile for a given gestational age. SGA infants are at increased risk for pre-term birth morbidities as well as a range of adverse peri-natal outcomes that result in part from associated premature birth. In adulthood, conditions such as meta-bolic syndrome, diabetes and hypertension develop more often in individuals born SGA regardless of whether the birth was preterm. Although the health sequelae of SGA are well-documented, relatively little is known about their economic consequences either in early or later life
[1]. Morbidity and mortality related to SGA creates a burden for both families and the health care system.
Several national and international studies have ad-dressed the cost of preterm birth; however, few have es-timated the cost of SGA separately from the cost of prematurity [2–6]. A Canadian study suggested that gestational age was a better predictor of cost than fetal growth: premature SGA babies cost at birth was $109,286 versus $85,103 for premature non-SGA ba-bies, while the average cost of full term SGA baby was about twice the cost of a full term non-SGA baby [2]. The intricacy of the relationship between prematurity and SGA contributes to the difficulty of distinguishing those two pathologies in the current literature [3, 4, 7]. Such a distinction, however, would allow better assess-ment of the medical and economic consequences of SGA * Correspondence:[email protected]
1URC ECO, Hôtel Dieu 1 Place du Parvis de Notre Dame, 75004 Paris, France 2PREMUP Foundation, Paris, France
Full list of author information is available at the end of the article
© The Author(s). 2017 Open Access This article is distributed under the terms of the Creative Commons Attribution 4.0 International License (http://creativecommons.org/licenses/by/4.0/), which permits unrestricted use, distribution, and reproduction in any medium, provided you give appropriate credit to the original author(s) and the source, provide a link to the Creative Commons license, and indicate if changes were made. The Creative Commons Public Domain Dedication waiver (http://creativecommons.org/publicdomain/zero/1.0/) applies to the data made available in this article, unless otherwise stated.
during the neonatal period, childhood and throughout life and help to focus research priorities on early identification of at-risk foetuses.
Our objective was to estimate the additional hospital cost associated with SGA infants from pregnancy through the first year of life and to separate the contri-butions of prematurity from the contribution of SGA on costs.
Methods
We used data from the 2011 and 2012 French national hospital claims database (Programme de Médicalisation des Systèmes d’Information; PMSI), which collects linked, anonymised medical records of all French inpatient and day case admissions in both public and private hospitals. Maternal and newborn records are linked at the national level. Such administrative databases have been previ-ously used to estimate costs and outcomes of preterm infants [4, 8, 9].
Population
We extracted the records of all infants born in metro-politan France in public and private hospitals from January 1, 2011 to December 31, 2011. Hospitalisations during the first year of life were identified by record linkage. Selection of the population was based on the Diagnostic Related Group (DRG), weight and gesta-tional age in addition to diagnoses, procedures and ad-ministrative information.
Exclusion criteria were multiple pregnancies, stillbirths (because postnatal costs would be non-existent), prob-lems in the anonymisation process, unclassifiable DRGs, congenital or chromosomal abnormality and absence of data about the weight, sex and gestational age.
We defined subgroups by gestational age (in com-pleted weeks): [22–28[ (from 22 to 28 not included), [28–32[, [32–37[, [37–39[ and [39–43[. Births before 37 weeks were considered preterm. Within each class of gestational age we classified newborns into SGA and AGA. SGA infants were defined as having birthweights below the 10th percentile of the French intrauterine growth curve adjusted for foetal sex. [10] AGA infants were defined as having birthweights between the 25th and the 75th percentiles of the same growth curve. We chose this definition for the control group in order to re-duce the variability in practice patterns and costs that would occur in the range approaching pathological con-ditions. These reference curves were recently developed using the representative sample of births from the French Perinatal Survey (FPS) 2010. Initially proposed by Gardosi in the 1990s, they are based on a modelisa-tion of intrauterine growth and foetal weight. SGA thresholds are individually defined according to foetal and maternal physiological factors influencing growth.
This definition of SGA births is currently supported by several international guidelines for screening and man-agement of SGA births. Due to a lack of data about ma-ternal height, weight and parity in the French hospital discharge database, we applied the model adjusted for foetal sex. [10–12] Mothers were identified in the data-base by linkage to the newborn hospital records. Data analysis was authorized by the French data protection authority (CNIL authorization number: 1606292 v 1). Outcomes
Type of delivery and complications were identified by the International Classification of Diseases, tenth revi-sion (ICD-10) and procedures codes. Mortality was de-fined as death during the index hospitalisation or during the first year of life and excluded stillbirths. Deaths were identified using the discharge status; in-hospital death during the first year was identified by record linkage. The mortality information provided by DRGs was veri-fied via a national standard procedure with linkage to national death registries [13–15].
Hospital resources and costs
A summary of all hospital inpatient service utilisation from the day of birth through the first year of life was compiled for all study infants. Record linkage between newborns and mothers was used to identify hospital ad-missions during pregnancy and delivery-related costs.
Data extracted included mode of delivery and type of neonatology unit, date of each admission, length of stay, procedures performed and ICD-10 codes. The total time infants and mothers spent in the hospital was calculated by summing the lengths of stay of successive admissions (including day cases) over a 1-year period. Hospital costs were calculated from the health insurance perspective [16]. Ambulatory expenses are not included in the dis-charge database. The total cost of deliveries in France and the SGA share of this cost was also estimated. All costs are in 2015€.
Statistical analysis
Maternal and neonatal characteristics, resource utilisa-tion (length of stay, use of intensive care, readmission) and costs were summarised by gestational age and com-pared between SGA and AGA infants using Pearson’s Chi-squared test and Wilcoxon’s test for qualitative and quantitative variables respectively. All tests were two-sided, and p-values lower than 0.05 were considered statistically significant. Determinants of cost variations between the two groups were studied according to gesta-tional age. Results are presented in means and standard deviations (SD); because of the skewed distribution of costs we also reported medians and interquartile ranges (IQR). The excess mortality was calculated by dividing
the mortality rate of the SGA group by the mortality rate of the AGA group in each gestational age class. Cost dif-ferences and their standard deviations were calculated using 1,000 bootstrap replications. All analyses were per-formed with SAS version 9.3 (SAS Institute, Cary, NC).
Results
Population
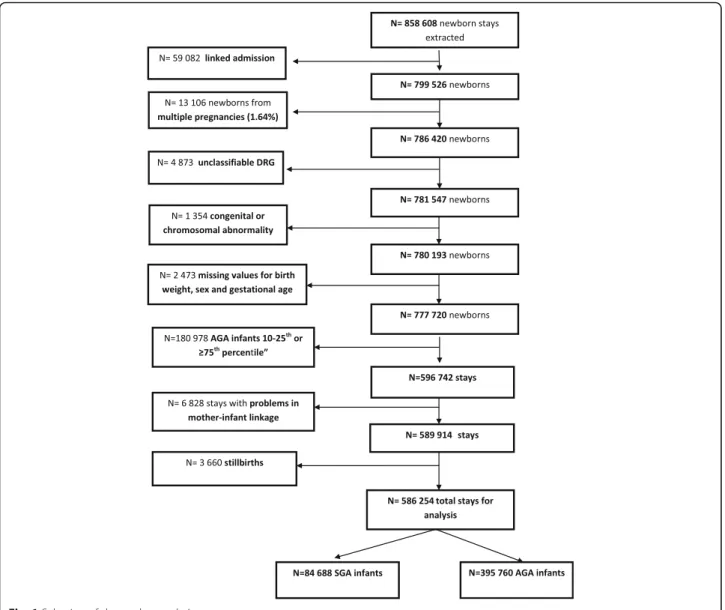
A total of 777,720 births and 858,608 admissions were identified nationally We excluded N = 59,082 linked ad-missions, N = 13,106 multiple pregnancies, N = 4,873 un-classifiable DRGs, N = 1,354 congenital or chromosomal abnormalities, N = 2,473 missing values for weight and gestational age, N = 180,978 non-SGA or -AGA births, N= 6,828 stays with problems in mother-infant record linkage and N = 3,660 stillbirths (Fig. 1). After applying the exclusion criteria, 84,688 SGA births (10.9% of total births) and 395,760 AGA births (51.8% of total births)
remained for the analyses. There were 3,660 stillbirths, 2,069 in the SGA group (1.8% of total SGA births) ver-sus 1,591 in the AGA group (0.3% of total AGA births).
Population characteristics are presented in Table 1. Preterm birth was reported for 11,097 individuals (13.1%) in the SGA group and 22,627 individuals (5.7%) in the AGA group (gestational age < 37 weeks). The average age of mothers was 28.9 (SD = 5.9) years in the SGA group and 29.1 (SD = 5.7) years in the AGA group (p < 0.001). The proportion of deliveries in public hospi-tals was higher in the SGA group (64,117 births, 75.7% versus 282,180 births, 71.3%).
Outcomes
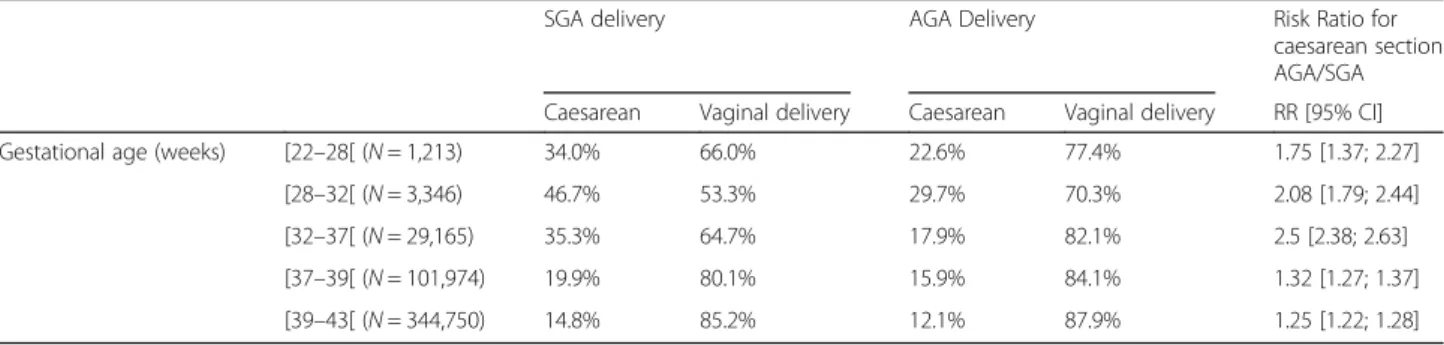
Caesarean section delivery was performed for 17.8% of the SGA mothers versus 13.5% of the AGA mothers. The rate of caesarean section was consistently higher in SGA versus AGA births for all gestational ages, with the
highest excess rate in the [28–32[ weeks gestational age group and lowest in the [37–39] weeks gestational age group (Table 2).
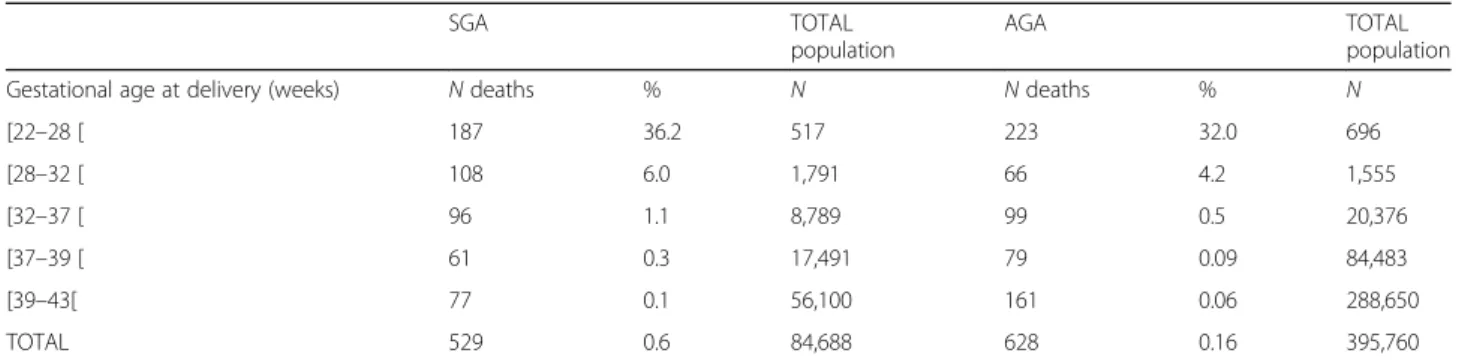
Mortality during the first year of life was higher in SGA infants with 529 deaths (0.60%) versus 628 deaths (0.16%) in AGA, p < 0.001. Mortality was highest in the [22–28[ weeks gestational age group (Table 3) regardless of birth weight. After stratification by gestational age, we found that the excess mortality of SGA was the lowest between 22 and 28 weeks of gestation and increased twofold after 37 weeks (Fig. 2).
Hospital resources and costs Mothers
Hospital admission during the prenatal period occurred in 23.6% mothers in the SGA group versus 19.6% in the AGA group. The average length of prenatal stay was 2.3 (SD = 5.9, median = 0 and IQR = [0;2]) days in the SGA group versus 1.8 (SD = 5.3, median = 0 and IQR = [0;1]) days in the AGA group (p < 0.001). The average length of post-partum hospitalisation was higher in the SGA
group, 5.9 (SD = 4.7, median = 5 and IQR = [4;6]) days versus 4.9 (SD = 3.4, median = 4 and IQR = [4;5]) days (p < 0.001).
The average pregnancy hospital costs were€868 (SD =€1,975, median = €0 and IQR = [€0; €932]) and €655 (SD =€1,736, median = €0 and IQR = [€0; €746]) in the SGA and AGA groups respectively for all mothers. The average delivery costs were €2,563 (SD = €1,443, median =€2,418 and IQR = [€2,033; €2,806]) and €2,357 (SD =€917, median = €2,076 and IQR = [€2,033; €2,418]) in the SGA and AGA groups respectively. The total aver-age pre- and post-natal cost for mothers was higher in the SGA group €3,431 (SD = €2,637; median = €2,689 and IQR = [€2,123–€3,738]) versus €3,012 (SD = €2,138; me-dian =€2,418; IQR = [€2,033–€3,127]) in the AGA group (p < 0.001). After stratifying by gestational age, the average total cost was higher in the SGA than in the AGA infants in all age groups (Table 4).
Infants
The 84,688 SGA births had 1.3 hospital admissions/in-fant during the first year, with a readmission rate of 16.4%, while the 395,760 AGA births had 1.2 admission/ infant and a 12.9% readmission rate. There were also more emergency hospital transfers in the SGA group than in the AGA group (8 vs. 3.6%) and a higher propor-tion of infants transferred to intensive care during the initial or subsequent admissions (22.5% versus 8.3%, p < 0.001). The excess transfer and readmission rate was greater for SGA infants with preterm birth (31.3% versus 25.3% in preterm AGA, p < 0.001) than for full term births (14.2% versus 12.2% for term AGA, p < 0.001).
The average length of stay for the initial hospitalisation was 7 days (median = 4 and IQR = [4;6]) in the SGA group versus 4.6 days (median = 4 and IQR = [3;5]) in the AGA group (p < 0.001) with an average length of stay in intensive care of 3.4 days (median = 0 and IQR = [0;0]) versus 0.7 day (median = 0 and IQR = [0;0]) (p < 0.001). The average total length of stay during the first year was 7.8 days (median = 3 and IQR = [2;7]) versus 5.1 days (median = 3 and IQR = [2;6]), (p < 0.001).
Table 1 Characteristics of the population at birth in small and average for gestational age infants, and risk ratios between groups
SGA
N = 84,688 AGAN = 395,760 Risk RatioAGA/SGA N % N % RR [CI 95%] Sex Male 42,646 50.36 200,653 50.70 Female 42,042 49.64 195,107 49.30 0.99 [0.97; 1.01] Gestational age <37 weeks 11,097 13.10 22,627 5.72 0.53 [0.52; 0.53] Delivery Caesarean 15,074 17.8 53,428 13.5 Vaginal delivery 69,614 82.2 342,332 86.5 1.39 [1.35; 1.41] ICU admission YES 18,320 21.63 28,485 7.20 0.31 [0.31; 0.32]
ICU Intensive Care Unit; SGA Small for Gestational Age; AGA Appropriate for Gestational Age
Table 2 Type of delivery section according to gestational age in SGA and AGA infants
SGA delivery AGA Delivery Risk Ratio for caesarean section AGA/SGA Caesarean Vaginal delivery Caesarean Vaginal delivery RR [95% CI] Gestational age (weeks) [22–28[ (N = 1,213) 34.0% 66.0% 22.6% 77.4% 1.75 [1.37; 2.27]
[28–32[ (N = 3,346) 46.7% 53.3% 29.7% 70.3% 2.08 [1.79; 2.44] [32–37[ (N = 29,165) 35.3% 64.7% 17.9% 82.1% 2.5 [2.38; 2.63] [37–39[ (N = 101,974) 19.9% 80.1% 15.9% 84.1% 1.32 [1.27; 1.37] [39–43[ (N = 344,750) 14.8% 85.2% 12.1% 87.9% 1.25 [1.22; 1.28]
SGA Small for Gestational Age; AGA Appropriate for Gestational Age
The average cost of the initial hospitalisation was €2,948 (SD =€7,292; median =€903; IQR = [€903; €1,699]) in the SGA group and €1,328 (SD = €3,053; median =€903; IQR = [823; 903]) in the AGA group. The average costs by infant of all readmissions were €1,229 (SD = €6,167, median = €0 IQR = [€0; €0]) and €486 (SD = €3,245, median = €0 IQR = [€0; €0]) respect-ively. The total average cost for infants was€4,178 (SD = €10,711 median €1,205 IQR = [€903; €2,486]) in the SGA group and €1,814 (SD = €4,996; median = €903; IQR = [€903; €1,506]) in the AGA group. All cost differences were significant (p < 0.001) (Table 4). Medians and IQR at 0 are explained by situations were more than 75% was not hospitalized, and thus had a cost at 0.
Total cost
The total average cost for infants and mothers from the beginning of pregnancy through the first year of life was €2,783 higher in the SGA group than in the AGA group: €7,609 (SD = €14,041, median = €4,213 IQR = [€2,252; €7,666]) and €4,826 (SD = €6,255, me-dian =€3,070 IQR = [€1,817; €5,422]) in the SGA and AGA groups respectively.
After stratifying newborns by gestational age, the average total cost for infants was higher in the SGA group
than in the AGA group for all age groups. The highest cost difference was found in the [32-37 [gestational age group (N = 29,165 6%) (Fig. 3). The cost difference de-creased with increasing gestational age (Fig. 3 and Table 4).
The total cost of pre-and post-partum (1 year) hospital admissions for SGA in France were €638 million. The additional cost for SGA compared to AGA was €1,478 million of which one-third (€493 million) was spent on preterm and two-thirds (€985 million) on full term SGA infants.
The total cost from pregnancy through the first year of life of all deliveries in France was €2,756 billion for 830,000 yearly births: SGA newborns represented 10.9% of total deliveries and 23% of total costs.
Discussion
Main findings
While there is published evidence on the economic consequences of preterm birth in several countries, the impact of being small for gestational age has seldom been assessed. Our main findings are that, of the total 779,376 births in France, the 84,688 SGA births cost on average €7,609 per infant (median = €4,213) from preg-nancy to 1 year of age, or €2,783 more in average than AGA infants; SGA infants represented 23% of total delivery costs.
Regardless of the term, compared to AGA infants, SGA infants had longer hospital stays at delivery, were more likely to be admitted to an intensive care unit and were more likely to be hospitalised during the first year of life, resulting in higher costs. The mothers of SGA infants were also more likely to be hospitalised during pregnancy and had longer delivery stays. Total costs were highest for infants born between 22 to 28 weeks of gestation, and excess costs were highest for infants born between 32 to 37 weeks of gestation. After 37 weeks of gestation, the cost difference decreased as the gesta-tional age increased. By contrast, the excess mortality increased when gestational age increased and was Table 3 SGA and AGA total 1-year mortality by gestational age (stillbirths excluded)
SGA TOTAL
population
AGA TOTAL
population Gestational age at delivery (weeks) N deaths % N N deaths % N
[22–28 [ 187 36.2 517 223 32.0 696 [28–32 [ 108 6.0 1,791 66 4.2 1,555 [32–37 [ 96 1.1 8,789 99 0.5 20,376 [37–39 [ 61 0.3 17,491 79 0.09 84,483 [39–43[ 77 0.1 56,100 161 0.06 288,650 TOTAL 529 0.6 84,688 628 0.16 395,760
SGA Small for Gestational Age; AGA Appropriate for Gestational Age
Fig. 2 Excess mortality for SGA infants compared to AGA infants by to gestational age
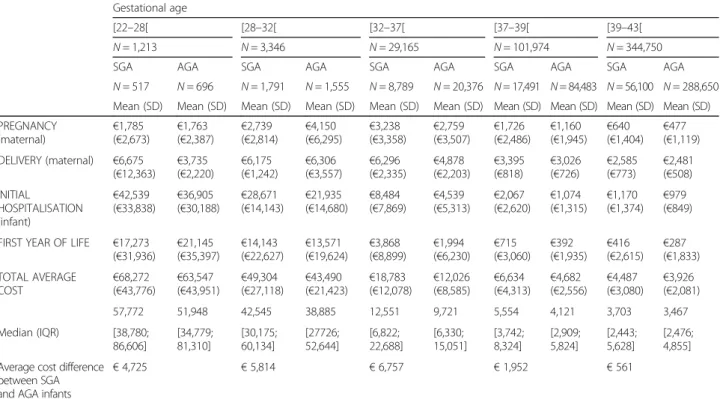
Table 4 Pregnancy to one year hospitalisation costs: mean (standard deviation), by gestational age for SGA and AGA infants Gestational age
[22–28[ [28–32[ [32–37[ [37–39[ [39–43[ N = 1,213 N = 3,346 N = 29,165 N = 101,974 N = 344,750 SGA AGA SGA AGA SGA AGA SGA AGA SGA AGA N = 517 N = 696 N = 1,791 N = 1,555 N = 8,789 N = 20,376 N = 17,491 N = 84,483 N = 56,100 N = 288,650 Mean (SD) Mean (SD) Mean (SD) Mean (SD) Mean (SD) Mean (SD) Mean (SD) Mean (SD) Mean (SD) Mean (SD) PREGNANCY (maternal) €1,785 (€2,673) €1,763 (€2,387) €2,739 (€2,814) €4,150 (€6,295) €3,238 (€3,358) €2,759 (€3,507) €1,726 (€2,486) €1,160 (€1,945) €640 (€1,404) €477 (€1,119) DELIVERY (maternal) €6,675 (€12,363) €3,735(€2,220) €6,175(€1,242) €6,306(€3,557) €6,296(€2,335) €4,878(€2,203) €3,395(€818) €3,026(€726) €2,585(€773) €2,481(€508) INITIAL HOSPITALISATION (infant) €42,539 (€33,838) €36,905 (€30,188) €28,671 (€14,143) €21,935 (€14,680) €8,484 (€7,869) €4,539 (€5,313) €2,067 (€2,620) €1,074 (€1,315) €1,170 (€1,374) €979 (€849) FIRST YEAR OF LIFE €17,273
(€31,936) €21,145 (€35,397) €14,143 (€22,627) €13,571 (€19,624) €3,868 (€8,899) €1,994 (€6,230) €715 (€3,060) €392 (€1,935) €416 (€2,615) €287 (€1,833) TOTAL AVERAGE COST €68,272(€43,776) €63,547(€43,951) €49,304(€27,118) €43,490(€21,423) €18,783(€12,078) €12,026(€8,585) €6,634(€4,313) €4,682(€2,556) €4,487(€3,080) €3,926(€2,081) 57,772 51,948 42,545 38,885 12,551 9,721 5,554 4,121 3,703 3,467 Median (IQR) [38,780; 86,606] [34,779; 81,310] [30,175; 60,134] [27726; 52,644] [6,822; 22,688] [6,330; 15,051] [3,742; 8,324] [2,909; 5,824] [2,443; 5,628] [2,476; 4,855] Average cost difference
between SGA and AGA infants
€ 4,725 € 5,814 € 6,757 € 1,952 € 561
Fig. 3 Hospital costs difference between SGA and AGA births according to gestational age
higher in late preterm and term infants than in infants at 28–36 weeks gestation.
Several reasons may explain this finding: the out-come difference for pre-term births may be driven mostly by gestational age rather than foetal growth, thus reducing the relative effect of SGA. Additionally, the absence of early diagnosis may have led to sub-optimal obstetrical and neonatal management, which in turn may have resulted in low costs but poor outcome.
Strength and limitations
The strength of our study lies in the fact that we have an exhaustive French hospital database with record linkage over a 2-year period. Non-hospital births and births with coding errors or imperfect linkage were excluded; the initial dataset comprised 779,376 births of the 792,996 live births registered. Hospital costs were calculated ac-cording to national French health insurance references. We also included maternal costs, which are seldom re-ported in perinatal economic studies.
Although the discharge database was initially devel-oped as a tool for assessing funding related to medical activities in public and private hospitals, the main variables used in this study were recently found to be robust when compared with national vital statistics data [13] and to a national perinatal survey [10].
Furthermore, reporting of the variables in our study (length of stay, intensive care utilisation, birth weight, gestational age, mortality) are legally binding on hospitals and subject to controls. We chose‘hyper normal’ infants for the comparator group but estimated the average neo-natal cost for the population with the full dataset.
The main limitation was that our study considered only hospital costs. Moreover, the 1-year time horizon is too short to fully capture the economic consequences of SGA birth. The long term health impacts have been documented, and their costs will be assessed in future cohort studies.
Interpretation
Other studies of preterm infants compared to full term infants found both higher mortality and complication rates [17], higher service utilisation and costs [4, 8] and an inverse relationship between gestational age and costs [6–8, 16]. The total costs of preterm infants in our study are comparable to those reported in countries with de-veloped neonatal intensive care units [3, 4, 8, 9]. Full re-suscitation is not standard in France before 24 weeks of gestation; palliative care is provided to infants born earl-ier. Thus costs in the 22–28 weeks gestational age group may be even higher in countries were full resuscitation is standard care. Lim found that on average the cost of SGA infants was twice the cost of AGA infants [2]. This
cost difference is higher than in our study but used a dif-ferent costing methodology. In contrast to the Canadian study [2], we found that the difference between AGA and SGA hospital costs was strongly related to gesta-tional age, decreasing monotonously from 28 to 32 weeks gestational age to term infants. The rates of caesarean sections in both preterm and SGA in Canada were markedly lower (6–13%) than in France [2, 18]. The most recently published cost study of preterm infants in the East Midlands reports birth to discharge hospital costs comparable to ours, with the same association be-tween costs and gestational age [6].
Conclusion
We found that being SGA predicted high hospital costs regardless of gestational age. The additional cost of SGA births was explained by higher complication rates, more frequent hospital readmissions and longer lengths of stay. SGA appears to be an independent contributor to high hospital costs in the short term. This data could be used in models to predict the costs associated with SGA [19].
Abbreviations
AGA:Appropriate for gestational age; CNIL: Commission nationale de l’informatique et des libertés; DRG: Diagnostic Related Group; ICD-10: International Classification of Diseases 10th Revision; IQR: Inter-Quartile Range; PMSI: Programme de Médicalisation des Systèmes d’Information; SD: Standard Deviation; SGA: Small for Gestational age
Acknowledgements
We would like to thank Karen BERG BRIGHAM for her constructive comments on the draft manuscript.
Funding
PREMUP foundation, a non-profit organisation. AM, OB, VT, MAC, FG, and IDZ are members of the PREMUP foundation. DEB is the director of the PREMUP foundation.
Availability of data and material
PMSI (Programme de Médicalisation des Systèmes d’Information) individual-level data are only available for French institutions having a SIRET (Système d’identification du répertoire des établissements) identification number. Institutions from other countries can ask for access at the following email address: [email protected].
Authors’ contributions
AM and AFP performed the data analysis, interpreted the results and drafted the manuscript. IDZ and DEB contributed to the study design; data analysis and interpretation reviewed and revised the manuscript. OB, VT, AE, MAC and FG contributed to the study design, the data interpretation and critical revision of the manuscript. All authors read and approved the final version. Competing interests
The authors declare that they have no competing interests. Consent for publication
Not applicable.
Ethics approval and consent to participate Not applicable.
Publisher’s Note
Springer Nature remains neutral with regard to jurisdictional claims in published maps and institutional affiliations.
Author details
1URC ECO, Hôtel Dieu 1 Place du Parvis de Notre Dame, 75004 Paris, France. 2PREMUP Foundation, Paris, France.3Robert Debré hospital, Paris, France,
Inserm U1141, Paris Diderot University, Paris, France.4Port-Royal maternity, DHU Risk in Pregnancy, Cochin Broca Hôtel-Dieu hospital, INSERM Unité 1139, Paris-Descartes University, Paris, France.5Grenoble Alpes University,
TIMC-IMAG, CNRS, Grenoble, France.6Obstetrical, Perinatal and Pediatric
Epidemiology Research Team (EPOPé), Research Center for Epidemiology and Biostatistics Sorbonne Paris Cité (CRESS), Paris Descartes University, Paris, France.7AP HP Henri Mondor hospital, Créteil, France.8INSERM UMRS 1123
(ECEVE), Paris, France.9Paris Est university, Créteil, France.10INSERM U1153,
Early origin of the child’s health and development team (ORCHAD), Research Center for Epidemiology and Biostatistics Sorbonne Paris Cité (CRESS), Paris Descartes University, Paris, France.
Received: 25 August 2016 Accepted: 11 March 2017 References
1. McIntire DD, Bloom SL, Casey BM, Leveno KJ. Birth weight in relation to morbidity and mortality among newborn infants. N Engl J Med. 1999; 340(16):1234–8.
2. Lim G, Tracey J, Boom N, Karmakar S, Wang J, Berthelot J-M, et al. CIHI survey: Hospital costs for preterm and small-for-gestational age babies in Canada. Healthc Q Tor Ont. 2009;12(4):20–4.
3. Mangham LJ, Petrou S, Doyle LW, Draper ES, Marlow N. The cost of preterm birth throughout childhood in England and Wales. Pediatrics. 2009;123(2): e312–27.
4. Russell RB, Green NS, Steiner CA, Meikle S, Howse JL, Poschman K, et al. Cost of hospitalization for preterm and low birth weight infants in the United States. Pediatrics. 2007;120(1):e1–9.
5. Petrou S, Khan K. Economic costs associated with moderate and late preterm birth: primary and secondary evidence. Semin Fetal Neonatal Med. 2012;17(3):170–8.
6. Khan KA, Petrou S, Dritsaki M, Johnson SJ, Manktelow B, Draper ES, et al. Economic costs associated with moderate and late preterm birth: a prospective population-based study. BJOG Int J Obstet Gynaecol. 2015; 122(11):1495–505.
7. Petrou S, Eddama O, Mangham L. A structured review of the recent literature on the economic consequences of preterm birth. Arch Dis Child Fetal Neonatal Ed. 2011;96(3):F225–32.
8. McLaurin KK, Hall CB, Jackson EA, Owens OV, Mahadevia PJ. Persistence of morbidity and cost differences between late-preterm and term infants during the first year of life. Pediatrics. 2009;123(2):653–9.
9. Clements KM, Barfield WD, Ayadi MF, Wilber N. Preterm birth-associated cost of early intervention services: an analysis by gestational age. Pediatrics. 2007;119(4):e866–74.
10. Ego A, Prunet C, Lebreton E, Blondel B, Kaminski M, Goffinet F, et al. Customized and noncustomized French intrauterine growth curves. I -Methodology. J Gynecol Obstet Biol Reprod (Paris). 2015;45(2):155–64. 11. Ego A. Definitions: small for gestational age and intrauterine growth
retardation. J Gynécologie Obstétrique Biol Reprod. 2013;42(8):872–94. 12. Royal College of Obstetricians and Gynaecologists (RCOG).
Small-for-Gestational-Age Fetus, Investigation and Management (Green-top Guideline No. 31). Lond UK [Internet]. 2013. Available at: https://www.rcog.org.uk/en/ guidelines-research-services/guidelines/gtg31/.
13. Soilly AL, Lejeune C, Quantin C, Bejean S, Gouyon JB. Economic analysis of the costs associated with prematurity from a literature review. Public Health. 2014;128(1):43–62.
14. Soilly A, Bismuth M, QuAntin C, Peyron C, Gouyon J. Validité et enjeux du codage PMSI des séjours de courte durée en néonatalogie, chez les nouveau-nés de faible poids de naissance. J d’Économie Médicale. 2005;28(8):311–28.
15. DREES. Le nouveau suivi de la mortinatalité en France depuis 2012. Etudes et résultats I n°901. 2014.
16. Guide méthodologique à destination des établissements de santé. HAS Haute Autorité de Santé. 2014.
17. Ancel P-Y, Goffinet F, the EPIPAGE-2 Writing Group, Kuhn P, Langer B, Matis J, et al. Survival and Morbidity of Preterm Children Born at 22 Through 34 Weeks’ Gestation in France in 2011: Results of the EPIPAGE-2 Cohort Study. JAMA Pediatr. 2015;169(3):230–8.
18. Monier I, Blondel B, Ego A, Kaminiski M, Goffinet F, Zeitlin J. Poor effectiveness of antenatal detection of fetal growth restriction and consequences for obstetric management and neonatal outcomes: a French national study. BJOG Int J Obstet Gynaecol. 2014;122(4):518–27.
19. Tsatsaris V, Agman A. Conséquences microéconomiques du retard de croissance intra-utérin. In: Le Retard de Croissance Intra-Utérin. Collection Pratique En Gynécologie-Obstétrique. Issy-les-Moulineaux: Elsevier Masson, DL; 2012.
• We accept pre-submission inquiries
• Our selector tool helps you to find the most relevant journal
• We provide round the clock customer support
• Convenient online submission
• Thorough peer review
• Inclusion in PubMed and all major indexing services
• Maximum visibility for your research Submit your manuscript at
www.biomedcentral.com/submit