HAL Id: hal-01784477
https://hal.archives-ouvertes.fr/hal-01784477
Submitted on 3 May 2018
HAL is a multi-disciplinary open access archive for the deposit and dissemination of sci-entific research documents, whether they are pub-lished or not. The documents may come from teaching and research institutions in France or abroad, or from public or private research centers.
L’archive ouverte pluridisciplinaire HAL, est destinée au dépôt et à la diffusion de documents scientifiques de niveau recherche, publiés ou non, émanant des établissements d’enseignement et de recherche français ou étrangers, des laboratoires publics ou privés.
for establishing network regulation models in
high-throughput screenings
Claire Rioualen, Quentin da Costa, Bernard Chetrit, Emmanuelle
Charafe-Jauffret, Christophe Ginestier, Ghislain Bidaut
To cite this version:
Claire Rioualen, Quentin da Costa, Bernard Chetrit, Emmanuelle Charafe-Jauffret, Christophe Ginestier, et al.. HTS-Net: An integrated regulome-interactome approach for establishing network regulation models in high-throughput screenings. PLoS ONE, Public Library of Science, 2017. �hal-01784477�
HTS-Net: An integrated regulome-interactome
approach for establishing network regulation
models in high-throughput screenings
Claire Rioualen1,2,3,4, Quentin Da Costa1,2,3,4, Bernard Chetrit1,2,3,4, Emmanuelle Charafe-Jauffret1,2,3,4, Christophe Ginestier1,2,3,4, Ghislain Bidaut1,2,3,4*
1 Aix-Marseille Univ, Marseille, France, 2 Inserm, U1068, Centre de Recherche en CanceÂrologie de Marseille, Marseille, France,3 Institut Paoli-Calmettes, Marseille, France, 4 CNRS, UMR7258, Centre de Recherche en CanceÂrologie de Marseille, Marseille, France
*ghislain.bidaut@inserm.fr
Abstract
High-throughput RNAi screenings (HTS) allow quantifying the impact of the deletion of each gene in any particular function, from virus-host interactions to cell differentiation. However, there has been less development for functional analysis tools dedicated to RNAi analyses. HTS-Net, a network-based analysis program, was developed to identify gene regulatory modules impacted in high-throughput screenings, by integrating transcription factors-target genes interaction data (regulome) and protein-protein interaction networks (interactome) on top of screening z-scores. HTS-Net produces exhaustive HTML reports for results naviga-tion and exploranaviga-tion. HTS-Net is a new pipeline for RNA interference screening analyses that proves better performance than simple gene rankings by z-scores, by re-prioritizing genes and replacing them in their biological context, as shown by the three studies that we reanalyzed. Formatted input data for the three studied datasets, source code and web site for testing the system are available from the companion web site athttp://htsnet.marseille. inserm.fr/. We also compared our program with existing algorithms (CARD and hotnet2).
Introduction
In vitro functional studies using RNA interference (RNAi) screening libraries have recently
dramatically improved in throughput speed, quality and genomic coverage with the advent of powerful biochemical methods for perturbing genes transcriptional mechanisms. RNAi screenings and the construction of associated genome-wide small interfering RNA (siRNA) libraries allowed a refined understanding of gene function at the genomic scale. In parallel, the improvement of analytical microscopy and the development of high-content screening tools (HCS) have allowed scientists to access multi-parametric analyses at a single-cell level. Together, these technologies charted the way to high-throughput screenings (HTS) with sophisticated cellular read-outs at the genomic scale. The hits detected by such assays can quickly link single proteins to a studied phenotype/function [1][2].
a1111111111 a1111111111 a1111111111 a1111111111 a1111111111 OPEN ACCESS
Citation: Rioualen C, Da Costa Q, Chetrit B, Charafe-Jauffret E, Ginestier C, Bidaut G (2017) HTS-Net: An integrated regulome-interactome approach for establishing network regulation models in high-throughput screenings. PLoS ONE 12(9): e0185400.https://doi.org/10.1371/journal. pone.0185400
Editor: Enrique Hernandez-Lemus, Instituto Nacional de Medicina Genomica, MEXICO Received: May 9, 2017
Accepted: September 12, 2017
Published: September 26, 2017
Copyright:© 2017 Rioualen et al. This is an open access article distributed under the terms of the
Creative Commons Attribution License, which permits unrestricted use, distribution, and reproduction in any medium, provided the original author and source are credited.
Data Availability Statement: All relevant data and HTS-Net program code source are available from the companion web sitehttp://htsnet.marseille. inserm.fr.
Funding: Institut National du Cancer (FR) grant INCA_5911 to Christophe Ginestier and Ghislain Bidaut funded the project.
Competing interests: The authors have declared that no competing interests exist.
Primary data analysis such as normalization [3], quality assessment, and hits selection [4] is well addressed in the literature, and stable software have started to emerge. While classic statis-tics are widely used for reporting hits values (z-scores, signal-to-noise ratios), new statisstatis-tics were proposed, such as the strictly standardized mean difference (SSMD) measurement [5]. Goktug and colleagues [6] proposed an integrated system, GUITar, to perform primary analy-sis and hits selection in a user-friendly environment. However, a simple list of hit genes fails to describe accurately enough the complex biological processes that can be triggered by RNAi experiments.
Since a cell function originates from several interactions built among gene networks, sophisticated network-based approaches are needed to decipher these interactions, and under-stand how they affect the biological system. Indeed, network analyses avoid pre-defined gene sets or pathways and rather identify new pathways that are of interest on the given biological phenomenon from a gene interaction map. It allows the potential discovery of pathways that play a role in the studied cellular function, as the analysis expands from background knowl-edge to uncharted groups of genes. Integration of gene scores and interaction data also allows to lower the noise, that is, to reduce false-positive/false-negative rates, for instance in the search of a gene signature, as it provides an additional level of validation [7]. In the case of a therapeutic target search, it allows to identify a subnetwork rather that an isolated protein and to be more specific. This kind of approach has been applied successfully using gene expression data for tumor classification [7], [8], prediction of drug response [9], and tumor stratification from variants identified with next-generation sequencing data [10].
Gonzalez & Zimmer [11] were among the pioneers of network-based approaches for RNAi screenings analyses. They developed a method based on co-clustering that was applied to the discovery of host factors of the Hepatitis C Virus (HCV). They identified deregulated modules by calculating a distance matrix among all genes, combining the RNAi score and the shortest path that separates them in an interactome map. They then performed average linkage cluster-ing. Clusters were formed and their size was controlled using an FDR approach. The advantage of their method is that it avoids interactome search heuristics. However, it uses p-values from the RNAi score, which are not always available. Also, there is a difficulty in finding modules of interest in the clustering tree.
Since this study, other algorithms were also proposed for network analysis of RNAi screen [12,13,14,15,16,17,18,19] and recently, two programs were developed, that optimize RNAi screen analysis: HotNet2 and CARD. HotNet2 (HotNet diffusion-oriented subnetworks) [20] is a network analysis program initially designed for discovery of genes and pathways signifi-cantly mutated in cancer. The authors performed a pan-cancer analysis using a huge dataset from The Cancer Genome Atlas, and found 16 mutated pathways that comprise known cancer signaling pathways as well as pathways that are less known for their involvement in cancer. This network approach helps identify rare combinations of mutations. HotNet2 uses a heat diffusion process to assess simultaneously the local genes mutations and local topology. Hot-Net2 starts with initial mutation frequency represented under the form of heat. It then under-goes a heat diffusion process where the heat is diffused among neighbors in the network. An exchanged heat matrix is computed and then so-called ‘hot’ subnetworks are identified. It is also possible to provide the program with a gene score of any type (such as Z-score from RNAi screens) that will be converted into heat and therefore use it for other analysis type. The statis-tical test provided determines the significance on the combined number and size of subnet-works found.
Dutta [21] proposed CARD, an interactive web-based application dedicated specifically to the analysis of RNAi screenings. It features an extended pipeline, from fully featured data nor-malization with per-plate quality control, to advanced functional network analysis. CARD
features a separate program for each functionality, which potentially allows to process quality control, basic functionalities, and high-level network analyses separately. The program RNAi-Cut is the first step for network analyses. It combines screening data and PPI data by calculat-ing the probability for an identified hit to have a higher connectivity than what is expected by chance. It helps the user setting a cutoff on z-scores for the gene hits for the following steps of the analysis. The Network analysis of screen hits comes after. The algorithm works by mapping genes into a PPI network (interactome) to identify connections between hits candidates. This step allows the inclusion of connectors to hits, that have a lower z-score but are nevertheless pertinent for the analysis. The CARD application also allows looking for enrichment of screen hits with canonical pathways and GOING terms.
In this paper, we present a new method called HTS-Net, a substantial adaptation and improvement of the Interactome-Transcriptome Integration (ITI) algorithm [7], that is specif-ically tailored for RNAi screenings network analyses. The ITI algorithm was rewritten in order to optimize the subnetworks detection, by investigating all of the seed’s neighboring nodes, rather than extending the subnetworks from one particular neighbor. Moreover, we integrated regulation data into the framework, rather than just investigating PPIs. Indeed, a recurrent limitation of previously cited methods is their sole reliance on PPI data, which is not adapted to understand regulation mechanisms. Our method works by discovering subnetworks with a search heuristics that works in parallel on a PPI network and a regulation network (TF-DNA interaction). In practice, we superimpose RNAi-based gene scores on the interaction and the regulation maps separately. Each one of them is then searched for high scoring areas. The identified regions of interest, the so-called subnetworks, are extracted and reported. We then merge the obtained modules to form meta-subnetworks that incorporate regulation informa-tion and PPIs. This approach allows reprioritizing genes by replacing hits into their biological context, which includes their physical interactors and their regulators. We performed our anal-ysis on state-of-the-art PPI and regulation databases, and proved its usefulness on three RNAi screen datasets. In each analysis, we reported newly found markers, GO enrichments and com-parison with the original analyses. We also compared our method to other existing algorithms. The program was made available to the community through the HTS-Net (High-Throughput Screening-Network) Mobyle server (http://htsnet.marseille.inserm.fr/).
Material and methods
The HTS-Net algorithm works as follows. RNAi data is obtained under the form of a list of gene scores (resulting from siRNA assays, shRNAi assays. . .). Two networks are built, interac-tome (PPI) and regulome (TF-genes interactions). Gene z-scores are superimposed on each map separately. Then, network regions (subnetworks) with high scores are identified and sta-tistically validated by comparison with a null score distribution. Subnetworks identified in interactome and regulome maps are then merged using common genes, yielding meta-subnet-works with high z-scores.
Network Data Collection
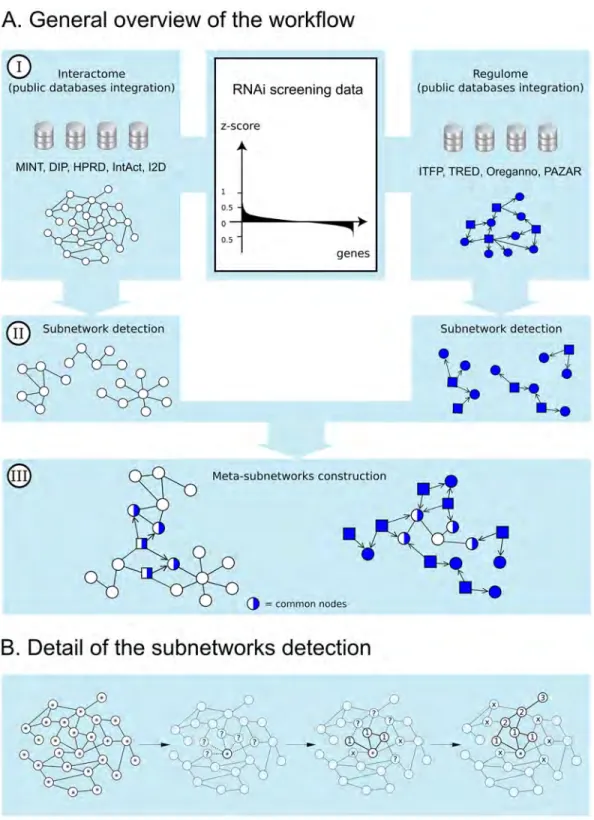
The discovery of new pathways heavily relies on the coverage, quality, and nature of the net-work map. We decided to process protein-protein interaction data and TF-gene regulation data separately. Thus, we built two networks by aggregation of several databases: an interac-tome and a so-called “regulome” (Fig 1).
PPI databases mainly contain data generated by high-throughput methods (Y2H, mass spectrometry, protein microarray) aggregated to “low throughput” data (manually curated data from the literature). In order to build our human interactome, we downloaded, parsed
Fig 1. HTS-Net framework. Fig 1A shows the general framework. HTS-Net has been organized in 3 steps of (I) data gathering for the interactome (white) and the regulome (blue) (II) subnetworks detection (performed separately in regulome and interactome) and (III) regulome-interactome subnetworks integration into meta-subnetworks. TF are represented as squares and their interactions are marked as directed. Fig 1B shows details of subnetworks detection. Each node of the network (here, the interactome) is used as a seed for the algorithm. Its neighbors are aggregated if they increase the temporary subnetwork score over a threshold th. If they don't, the path is closed. Once all neighbors have been either explored or rejected, the subnetwork is complete.
and merged all of the interactions found in major databases: the Database of Interacting Pro-teins (DIP) [22], the Human Protein Reference Database (HPRD) [23], the Interologous Inter-action Database (I2D) [24], IntAct [25], the Molecular INTeraction database (MINT) [26] and Human ProteinPedia [27]. A total of 14,423 genes and 171,146 interactions were gathered in the interactome network.
TF-TF interactions were gathered from TRANSFAC, from the atlas of combinatorial tran-scriptional regulation by Ravasi and colleagues [28], the interactions predicted by Mysˇičkova´ and Vingron [29], and those predicted by Yu and colleagues [30]. These were included in the interactome.
Large-scale regulation databases contain predicted human transcription factors (TF) regu-lation for tissue-specific sets of genes. ITFP (the Integrated Platform of mammalian Transcrip-tion Factors) reports 4,105 putative TFs and 69,496 potential TF-target pairs for human [31]. TRED (the Transcriptional Regulatory Elements Database) reports 7,479 targets genes [32]. TRANSFAC, a commercial database, reports 707 TF and 8,712 TF-genes pairs [33]. ORe-gAnno, the open-access community-driven resource for regulatory annotation, reports 465 TFs and 3,853 genes using a community annotation system [34]. The PAZAR database of gene regulatory information reports 1,284 regulated genes for 708 TFs [35]. A total of 9,755 genes and 68,703 interactions were mapped in the regulome network.
For both networks, all protein identifiers were mapped to Entrez GeneID accession num-bers using correspondence tables downloaded from NCBI FTP site (date: November 5th, 2014). The transcription factors from these databases were annotated as such in both the inter-actome and the regulome.
Subnetworks detection with HTS-Net
HTS-Net subnetwork scores are formally defined as the average z-score value for all genes belonging to this subnetwork, as follows:
SðsnÞ ¼X
g2sn
z scoreðgÞ
wheresn is the current subnetwork, S(sn) its score, g the current gene, z-score(g) the z-score corresponding to the current gene. For each studied dataset, the complete set of z-scores mea-sured from the screening was investigated by HTS-Net as shown inFig 1. In each network (interactome or regulome,Fig 1A) every node is tested as a putative seed (Fig 1B). We decided to use identical algorithm for the two networks. Even if only a part of the regulome is acting as regulators we test all genes, even regulated genes, for potential seeds. This allows the detection of subnetworks with regulated genes having high z-scores, that will include transcription factors that may be characterized by a lower score. On the other hand, this allows the identifi-cation of lower-score regulated genes all regulated by a common transcription factor charac-terized by a high score.
From all seeds, the neighbors are then tested independently. This means that each neighbor of the first layer is tested for score improvement independently and flagged as kept or removed in the current subnetwork. A node is kept if its inclusion allows the increase the subnetwork score over an improvement score thresholdth.
Then, neighbors that are improving the subnetwork score are added simultaneously and the new subnetwork score is computed. The neighbors of the kept nodes are then explored recursively, layer after layer, in a breadth-first manner. This approach is a strong improvement over the one developed in ITI, which was biased with the order of neighbors’ exploration.
The improvement thresholdth has a somewhat limited impact on the number of subnet-works and genes (Fig 2). By varyingth between 0 (less stringent) to 0.1 (more stringent) the number of subnetwork is slightly increased from 60 to 110. This is an opposite behavior to what is intuitively expected. However, a lowerth value diminishes the overall relevance of the subnetworks produced, which are filtered out later with the statistical validation. The same phenomenon is observed with the genes, which vary from 160 to 190 for ath value on the range 0–0,1. For most analyses, we therefore adopted a threshold of 0,05, which is a good com-promise between obtaining a number of subnetworks too large for further analysis and a too stringent approach.
In the set of identified subnetworks, there can be high rates of overlap between nodes. It is caused by the fact that every node in the interactome and the regulome is used as a seed by the algorithm: two distant seeds can have a pool of high-scoring genes in common. Before process-ing with statistical validation, redundant subnetworks should be filtered out, dependprocess-ing on their respective sizes and scores. All the subnetworks are compared by pairs. We compute the proportion of nodes in subnetwork A that are also found in subnetwork B (first overlap), and vice versa (second overlap). If the two overlaps are above a specific rate (80% by default), the
Fig 2. Analysis of HTS-Net parameters impact. We analyzed the impact of several parameters on the number of subnetworks, genes and meta-subnetworks in Chia's dataset (Chia et al., 2010). We tested the impact of minimum score improvement threshold th over the number of subnetworks and genes, the impact of a type II p-value on the number of subnetworks, and the impact of the interactome-regulome common protein threshold on the number of meta-subnetworks.
subnetwork with a lower score is discarded. If only one overlap is above 80%, it is likely that there is a difference in subnetwork size. If the smaller one has a lower score than the bigger one, it is discarded. If it has a higher score, both subnetworks are kept. We made this choice in order to avoid discarding large subnetworks, and possibly losing relevant information. After this filtering step, the remaining subnetworks are considered for statistical validation.
Statistical validation
In order to assess the statistical significance of the detected subnetworks, their scores are com-pared against three distributions of subnetwork scores randomly generated, following the strategy described by Garcia and colleagues (Garcia et al., 2012). The first distribution is obtained by shuffling the scores of the genes resulting from the RNAi screening before detect-ing the subnetworks. A p-value is then computed by compardetect-ing the scores of the detected sub-networks with the scores of this random distribution. This p-value I enforces the link between the RNAi z-scores and the subnetworks, and shows the relevance of associating HTS and work approaches. The p-value II is obtained by detecting subnetworks on randomized net-work data: all the edges of the netnet-works (interactome and regulome independently) are randomly mixed, keeping only the degree of each node. This second p-value enforces the link between the subnetworks and the global network. The p-value III shows the statistical signifi-cance of the algorithm by comparing the subnetworks against randomly generated subnet-works of the same size, regardless of the RNAi scores and network topology.
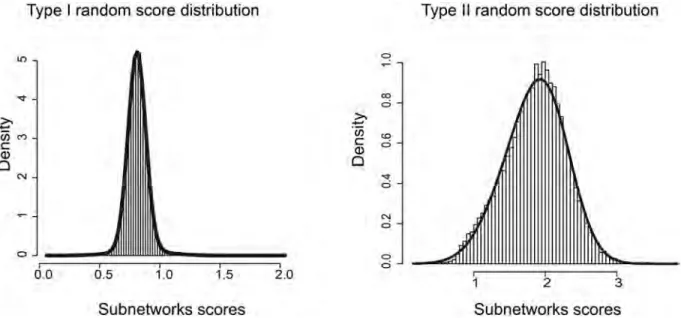
These three distributions are fitted with a Gaussian mixture distribution (Fig 3) (R package
nor1mix). The selection of the subnetworks is then made by thresholding all p-values at a
sta-tistically significant level, after Bonferroni correction has been applied for multiple testing. In both the interactome and the regulome, final subnetworks are retained if the three p-values are significant. The p-values retained for the three analyses are shown inTable 1. We decided to set these thresholds so that we have a similar order of magnitude for the number of subnet-works to process in each dataset and network. For instance, setting up a p-value of 1e-2 for the
Fig 3. Null score distribution. Examples of Type I and Type II null score distribution obtained with HTS-Net for the Chia dataset (histogram). The distributions are fitted with a Gaussian Mixture model (thick black line).
dataset from Chia et al. yields 766 subnetworks for the regulome.Fig 2Cshows that the num-ber of subnetworks increases exponentially when the p-value II threshold is increased. Similar results are obtained with p-value of type I and III. Setting p-values to a strongly significant 1x10⁻⁴ gave us a reasonable amount of subnetworks in the case of Chia’s dataset. Differences in subnetworks number are due to differences in datasets topology, and the correlation between HTS z-scores and network. As in any algorithm based on a heuristics, parameters are chosen through analysis of several datasets.
Regulome and interactome subnetworks integration
In order to identify pathways of regulation involving multiple regulation levels (for instance regulome subnetworks regulating several PPI subnetworks), HTS-Net features an integration step to combine interactome-based subnetworks with regulome-based subnetworks by finding common proteins among the two subnetworks types. We examined individually all regulome subnetworks and all interactome subnetworks and connected subnetworks that presented a minimum ofn common nodes, yielding meta-subnetworks (Fig 1). This value depends on the convergence of subnetworks and is dataset-specific.
We studied the variation of the number of obtained meta-subnetworks versus the common protein threshold (Fig 2D). The number of meta-subnetworks is greatly affected by the num-ber of common proteinsn between regulome and interactome, from around 200 meta-subnet-works obtained for 1 common protein to 0 for 6 common proteins. This reveals the modular nature of regulome and interactome subnetworks which are linked by a limited number of proteins. For Chia’s dataset, we observe a break in the curve decrease around 4 proteins, which gave a manageable number of 12 meta-subnetworks.
Table 1gives an overview of all the parameters chosen for each analysis.
Online reports and subnetworks databases
The heterogeneous nature of data sources, the complex conversion of gene IDs and the overall structure complexity of the newly generated data necessitate an advanced visualization system in order to properly interpret the nature of subnetworks. In particular, several interaction types as well as several network types (interactome, regulome) must be accordingly visualized, and compared to known biology. The HTS-Net screening pipeline features an advanced reporting mechanisms allowing subnetworks visualization while taking into account several network types and various interaction types (PPI, gene regulation).
Table 1. Choice of the parameters and obtained scores for the three analyses. Dataset th P-value of type I, II and III.
(interactome, regulome) # Subnetworks(interactome, regulome) Range of interactomescores Range of regulomescores n (# Meta-subnetworks)
Chia 0.05 5x10⁻³; 1x10⁻² 134; 130 2.79; 3.54 2.19; 2.69 4 (12)
Tai 0.05 5x10⁻³; 5x10⁻³ 32; 28 6.17; 9.06 4.23; 5.67 2 (48)
Wolf 0.05 5x10⁻²; 1x10⁻² 178; 54 0.91; 1.15 0.80; 0.97 3 (136)
The columns are describing the following sets of parameters: th is the improvement score threshold. It was set to 0.05 for each dataset. P-values of type I,II and III are described in the 2.4 section. The same value was chosen for the three p-values in the interactome and in the regulome, independently. The range of interactome and regulome scores corresponds to the maximum and minimum subnetwork scores obtained after statistical validation for both networks. n is the threshold of common nodes that was used for combining regulome and interactome networks The corresponding number of meta subnetworks is shown within parenthesis.
All detected subnetworks are plotted using GraphViz package (AT&T Research) and the web report design was done with KickStart 0.99 (HTML5+CSS3). Using this interface, all sub-networks can be investigated and compared. All genes are also listed and connected to their respective subnetworks. NCBI links and GO enrichment analyses are provided. Further analy-sis with Cytoscape is straightforward, as all subnetworks are generated using the standard Net-work Nested File format. All the data is available as a flat file for further analysis from the HTS-Net companion web site.
GO enrichment statistics
Genes were annotated with Gene Ontology (GO). GO enrichment analysis was performed for each dataset by standard hypergeometric testing associated with a Benjamini-Hotchberg multiple testing correction (FDR = 5%) [36]. Gene Ontology enrichment of all subnetworks for the three tested datasets are available as an Excel file made available asS1 Fileand from the HTS-Net web site (http://htsnet.marseille.inserm.fr/supplementary-data.html). Results from the GO enrichment analysis are discussed in the results section for the three analyzed datasets.
Public data sources
In order to evaluate the capacity of our HTS-Net pipeline to identify gene networks of interest, we reanalyzed three published RNAi screenings datasets: the dataset published by Chia and colleagues [37], the dataset published by Wolf and colleagues [38], and the dataset published by Tai and colleagues [39].
Chia and colleagues [37] set up an RNAi screen to determine genes that sign for human embryonic stem cell (hESC) identity. First, they engineered a cell line model, H1 hESC [40], by introducing a GFP reporter construct driven by the POU5F1 upstream regulatory region. POU5F1 expression can be considered as a marker of undifferentiated hESC. This cell line model was screened against a library of 21,212 human genes in duplicate. The mean of the two z-scores for GFP fluorescence reduction (Fav) and Nuclei number reduction (Nav) were calcu-lated. The authors found all genes with a Fav_score >2 to be potential candidate determinants of hESC identity, which gave a total of 566 genes. They then performed a secondary screening on the 200 most highly ranked genes.
The second dataset reanalyzed concerns a study by Wolf and colleagues [38] where they tested the ability of breast cancer stem cell (CSC) population (CD44+CD24-/low) to form mammospheres (a functional surrogate marker of the CSC self-renewal ability) after short-hairpin RNA interference assay (shRNAi) to identify breast CSC key regulators on 5,045 genes. They compared this analysis with the same cells cultured in adherent conditions (cul-ture condition allowing cell differentiation) to eliminate shRNAi without breast CSC-specific effect. Wolf et al. initially selected 1,051 genes with a p-value <0.01 on the adherent z-score to assess genes impairing cell growth. Then they performed an enrichment analysis on a set of 392 genes specific to mammosphere formation, to verify a p-value <0.01 on the mammo-sphere z-score and a p-value >0.1 on the adherent z-score to enforce CSC specificity. They then focused the analysis on autophagy genes ATG4A and ATG4B, with respective z-scores of 0.51 and 0.11.
The last dataset reanalyzed is the one from Tai et al. [39], who screened for host proteins involved in HCV replication using the Huh7/Rep-Feo subgenomic genotype replicon cell line. This replicon encodes the HCV non-structural proteins that mediate viral transcription as well as a firefly fusion protein used for signal quantification. This cell line was screened against 21,094 siRNAs targeting the whole human genome in duplicate.
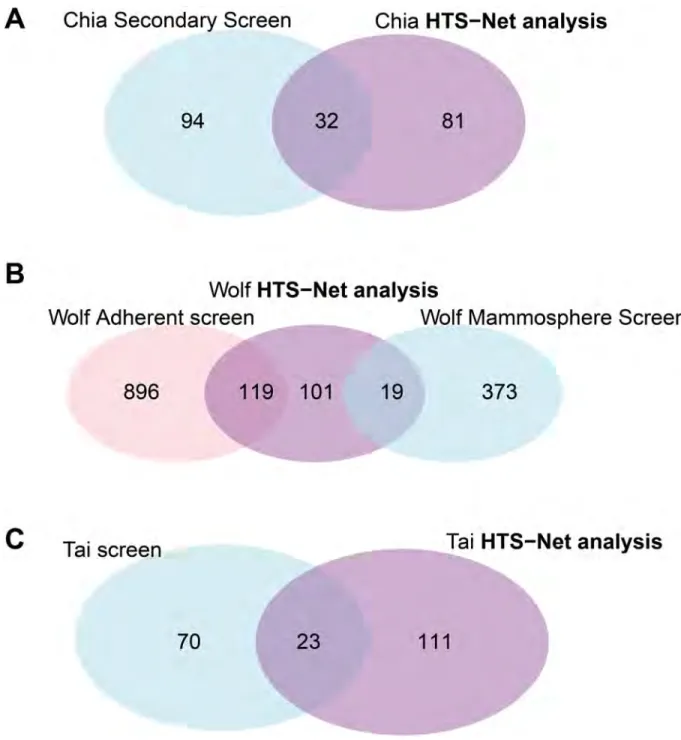
The web-based report (companion web site) shows how the significant genes and their associated networks stand among the genes and z-scores previously detected by the original analyses.Fig 4shows overlap (Venn diagrams) between the original analyses and genes identi-fied with HTS-Net and are commented in the Results section.
Fig 4. Overlaps of genes between different algorithms and HTS-Net. The figure shows Venn diagrams of the different overlaps obtained between HTS-Net runs on Chia, Wolf and Tai datasets and runs of other algorithms by the original authors. The A Venn diagram shows the overlap between the Chia secondary screen and the HTS-Net analysis. The B Venn diagram shows the overlap between the Wolf Adherent-enriched screen, the Wolf Mammosphere enriched screen and the corresponding HTS-Net analysis. The C Venn diagram shows the overlap between the Tai original screen and the HTS-Net analysis.
Comparison with Hotnet2 and CARD programs on the Tai dataset
We compared HTS-Net with three other programs, Hotnet2, CARD and Gonzales & Zim-mers’s method on Tai’s dataset. The choice for the Tai’s dataset was motivated by the fact that Gonzales & Zimmer do not provide source code or program but published an analysis of Tai’s dataset in their publication, so this was a good basis of comparison. Hotnet2 is pro-vided under source code. We therefore installed the code in a Linux machine, and compiled it after installing along all dependencies. We then ran it with the HPRD [23] network after generating corresponding influences matrices for the networks (matrices that measures how the heat will propagate within the network). The HPRD network was chosen since it is distributed along with the program source code and is well integrated with it. The program runs with two parameters, Beta and Delta. Beta is a network heat diffusion parameter that sets how a node value interferes with its neighbors. We left it at its default value. Delta is the edge weight and has an impact on the detected subnetwork sizes. After running, the program proposes several values on the range [2,45x10⁻³–4,92x10⁻³] and we chose Delta = 2,44x10⁻³which gave reasonable subnetworks number and size (288 subnetworks, p = 0.46). We used the subnetwork export function to obtain a gene list comparable with other pipelines.
CARD being accessible as a web service, we registered an account and formatted Tai’s data to the CARD Format. Chrome 44 is officially recommended, but we were able to run it with the more recent version 55. There was no way to directly provide normalized RNAi data, so we provided randomized identifiers for plate, as this information was not available for the dataset analyzed, and loaded the data by specifying no normalization, so that we kept the previ-ously normalized data. Then, we identified hits using RNAiCut to determine optimal level of significance for z-score. The maximum log(p-value) occurs at 2,786 (p-value = 0,004).
We then started the network analysis with this setting. We selected all networks available in the system, HPRD, Bind and BioGRID. We downloaded the resulting gene list as a CSV file in order to compare results with other pipelines.
For Gonzales & Zimmer’s method, the code was not available, so we re-used the analysis of Tai data provided in the corresponding article.
Results
A new pipeline for deciphering regulation and interactions impacted by
HT screens
We are proposing the HTS-Net pipeline for the network analysis of large-scale (up to genome-wide) RNAi screenings adapted to various experimental settings. The pipeline is maintained and accessible through a locally-deployed Mobyle portal [41] available athttp://htsnet. marseille.inserm.fr/. A tutorial is available from the same URL. Analyses can be conducted as soon as the data is normalized and properly formatted to HTS-Net, under the form of a 2-col-umn tab-delimited file: the first col2-col-umn contains gene identifiers (Entrez Gene), and the sec-ond column contains associated z-scores from the screening. If multiple replicates exist, they must be averaged or combined to a single score, as HTS-Net is not designed to work with mul-tiple scores simultaneously. Additional information must be provided, that is, the organism studied and the p-values for scoring. An archive is then generated that contains the analysis report in HTML format compatible with any standard web browser.
In order to understand the results obtained from the HTS-Net pipeline, we compared genes identified by HTS-Net with genes originally published. We also produced GO enrichment analysis for genes that are in common between HTS-Net and the original publication and
genes that have been specifically identified with one of the two methods (see support data on companion web site).
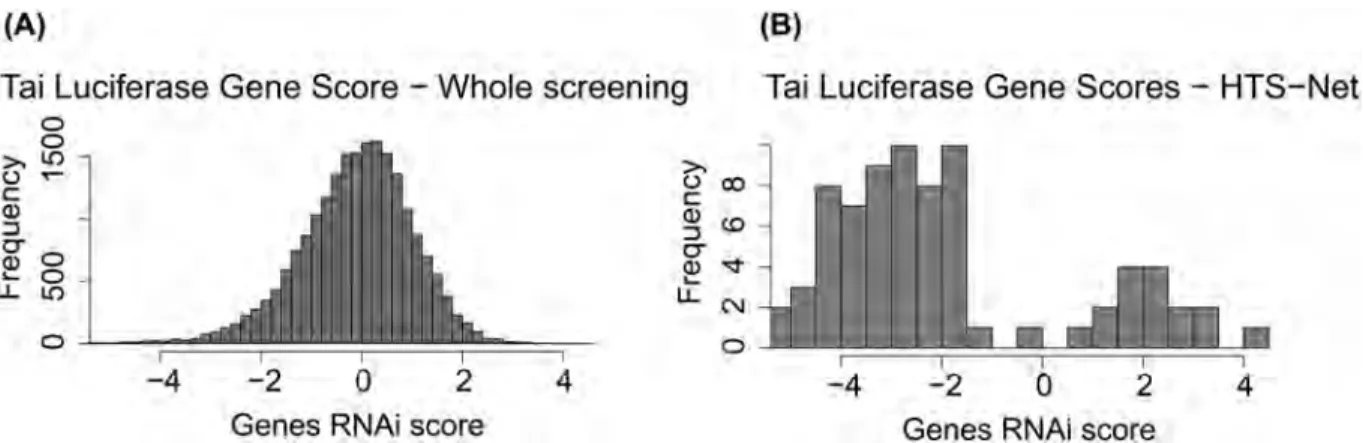
Fig 5shows the distribution of z-scores for the Tai Luciferase dataset along the distribution of score for genes identified with HTS-Net. These distributions show that HTS-Net is less stringent with genes that have a low score but connected to important networks, and that would have been discarded by a classical analysis based solely on z-score statistics.
Network analysis of human embryonic cell differentiation determinants
(Chia et al.)
We pursued the analysis made by Chia et al. with the Fav value, as in the original paper, and fed it to the HTS-Net pipeline as a gene score. The minimal score increase thresholdth was fixed to 0.05. 21,023 genes were mapped to the interactome and the regulome, in order to detect subnetworks playing a role in differentiation. We performed an HTS-Net analysis with a p-value cutoff of 5x10⁻³for the interactome analysis and a p-value cutoff of 1x10⁻²or the reg-ulome analysis in order to obtain comparable number of subnetworks for the two networks while keeping a statistically significant score. HTS-Net was set up to detect genes with highly negative z-scores, as in the original publication. We respectively obtained 134 interactome and 130 regulome subnetworks that were integrated into 12 meta-subnetworks after performing integration on a threshold of 4 common nodes. These were comprised of 294 genes for the interactome, 330 genes for the regulome, and 113 genes after identification of meta-subnet-works. There are 32 genes found common between the 113 genes identified by HTS-Net and the 126 genes identified by Chia (Fig 4A).
Chia focused on transcriptional regulators PRDM14, NFRKB and YAP1. All were found present in high-scoring subnetworks. PRDM14 was found in 7 regulome subnetworks. The base regulome subnetwork related to PRDM14 has a score of 2.412. NFRKB was detected in 48 interactome subnetworks, 3 regulome subnetworks and retained in 3 meta-subnetworks. The best NFRKB-related interactome subnetwork score was 3.11. YAP1 was detected in 94 interac-tome subnetworks and 12 meta-subnetworks. The best YAP1-related subnetwork score was 3.54.
Thanks to the HTS-Net pipeline, we were able to identify other interesting genes from this dataset. Several genes from the Polycomb Repressive Complex 2 (PRC2) were highly ranked by HTS-Net but left apart by Chia’s method. These chromatin regulators are known best for their function in establishing and maintaining epigenetic memory during development. The
Fig 5. Z-Score distribution of RNAi screening for the Tai dataset (A) versus distribution of genes detected by HTS-Net (B). This plot shows that several genes are retained by HTS-Net are below the score retained by typical analysis.
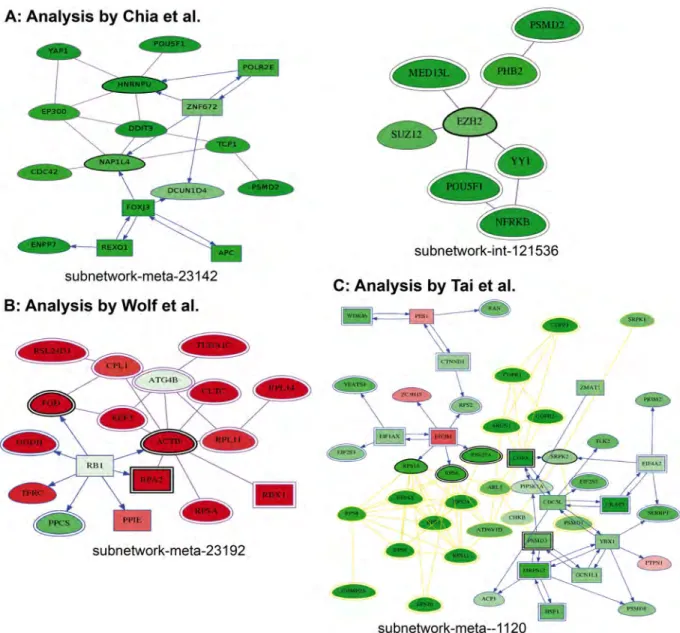
gene EZH2, known for playing a role in embryonic stem cell self-renewal by maintaining cellu-lar identity [42], has a screening score of -1.631 and was not retained by Chia. It was detected by HTS-Net to be present in 2 interactome subnetworks and 5 regulome subnetworks. It was found in subnetworks int-snw-2146 as the seed, interacting with another PRC2 member, SUZ12, and with a number of other genes detected by Chia and colleagues (Fig 6A). SUZ12 is involved in cellular differentiation and has been found involved in the progression of a num-ber of cancers [43]. It was also found in subnetwork int-snw-121536 with AEBP2 as the seed, also having a score lower than Chia’s cutoff. AEBP2 is required for optimal enzymatic activity of the PRC2 complex [44]. In subnetwork int-snw-54857, several genes identified by Chia are
Fig 6. Examples of networks detected in each analysis. 6A: Chia analysis. EZH2 deregulated interactome subnetworks are shown. Darker green correspond to higher z-score. 6B: Wolf analysis. The Meta subnetwork related to ATG4B is shown. Red = more elevated in mammosphere (meaning silenced in adherent), green = more elevated in Adherent (meaning silenced in mammosphere, as expected for ATG4B). 6C: Tai analysis showing the interactions of PIP5K1A including OPA, PSMD1 and the ribosomal machinery (red = negative z-score corresponding to HCV machinery inhibition, green = positive z-score).
present (YAP1; NFRKB) but the subnetwork seed GDPD2 and the gene HEXDC were specifi-cally identified by HTS-Net. GDPD2 codes for an enzyme that may play a role in osteoblast differentiation [45]. Parameters for HTS-Net analyses reported in this paper were summarized inTable 1.
The GO enrichment analysis (see supplementary data) for genes found with HTS-Net and genes found in Chia’s secondary screening showed several GO terms having a specific enrichment found only in HTS-Net analysis (See supplementary GO table on the HTS-Net web site). General processes were detected by both approaches, such as ‘gene expression’ and ‘protein binding’. However, specific processes were detected as highly significant by HTS-Net, such as ‘viral process’ (16 genes– 9 found by Chia et al.). Genes located in the cytosol (38 genes– 26 found by Chia et al.) are also more enriched. HTS-Net identified ‘Cop9 signalosome’ (6 genes, 2 by Chia et al), as well as genes from the mediator complex (5 genes, and none by Chia et al.). HTS-Net also identified ‘poly(A) RNA binding’ (27 genes— only 17 found by Chia et al.). Other specific enrichments found in Chia’s secondary screen-ing were detected at the limit of significance at FDR 0.05 by HTS-Net, such as ‘oligodendro-cyte development’, ‘cellular response to stimulus’ and processes related to ‘negative
regulation of transcription’ and ‘negative regulation of translational initiation in response to stress’.
Network analysis of mammosphere formation (Wolf et al.)
Wolf’s shRNAi assay was performed on 5,045 genes that we reanalyzed with HTS-Net. These genes reported in the supplementary material were converted to 4,948 Entrez Gene identifiers to ensure HTS-Net compatibility.
We setup an integrated HTS-Net analysis with both the mammosphere-enriched and the adherent-enriched screening data. In order to select subnetworks differentially affected in the two conditions, we computed the ratios mammosphere/adherent for each gene knockdown, and fed it to HTS-Net with a improvement threshold th = 0.05 and p-values of 0.05 for the interactome search and 0.01 for the regulome search. Absolute value for ratio is used in order to detect both mammosphere-specific networks and adherent-specific networks in a single HTS-Net run.
The HTS-Net approach identified 239 genes, organized in 136 meta-subneworks, 178 inter-actome subnetworks and 54 regulome subnetworks, and allowed an integrated analysis of mammosphere-enriched cells and adherent cells. The Venn diagram (Fig 4B) reveals that we mainly detected adherent-specific genes, as the adherent z-score tends to be higher than the mammosphere z-score.
The ATG4A gene was not detected by HTS-Net, but ATG4B was detected as seed of a subnetwork globally over-expressed in mammosphere-enriched cells (int-snw-23192, score = 0.993), while ATG4B was itself under-expressed. Importantly, if ATG4B has a quite large degree (number of connected nodes) of 159 in our interactome, it has been specifically added in a single subnetwork. Interactome subnetwork int-snw-23192 was connected to regu-lome subnetwork reg-snw-2958 to form a regulated structure found in meta-subnetwork meta-reg-snw-23192 (Fig 6B) and a larger structure, meta-reg-snw-2958, composed of 31 sub-networks. Meta-reg-snw-23192 contains 18 genes including TP53, a number of genes modu-lating microtubules (TUBA1C and ACTB), and genes involved in elongation (EEF2). Other proteins involved in ribosomes are present in this subnetwork.
We found that a large number of the 239 genes detected by HTS-Net have been previously detected as adherent, while only five were identified in mammosphere-enriched cells. This observation is due to the fact that we set up our HTS-Net analysis to detect larger log2
(mammosphere/adherent) ratios in absolute value, and that a larger number of genes have a higher expression for adherent cells screen. When analyzing GO terms enrichment, we found that a number of other functions related to cell cycle and cell differentiation were also detected specifically by HTS-Net, for instance, the GO term ‘mitotic cell cycle’ (present in 32/415 genes detected by HTS-Net and 15/515 genes in original publication), the GO term ‘DNA damage response, signal transduction by p53 class mediator resulting in cell cycle arrest’ (13/68 genes with HTS-Net, while 1/68 genes in original publication).
Network analysis of HCV host cofactor replication (Tai et al.)
Two analyses were previously performed with this dataset: the original from Tai and colleagues and a network-based analysis from Gonzalez & Zimmer [11], which gives the opportunity to make comparisons and understand advantages and limitations of each approach. We per-formed an analysis with HTS-Net, as reported in this section.
HTS-Net mapped 17,695 knockdowns to Entrez Gene identifiers, 12,906 genes to the inter-actome and 8,990 genes to the regulome. 141 genes were retained as significant both in interac-tome and regulome networks and were found in respectively 32 and 28 corresponding
subnetworks, and 55 meta-subnetworks. Of the 141 genes identified with HTS-Net, 23 were common with the set published by Tai.
All studies identified genes in the COPI coat. These ranked high in the screening and were also favored in the clustering analysis. We identified a number of genes that are part of this complex with HTS-Net, including COPA, COPB1, COPB2, COPG1, and COPZ1. COPI coat activity was confirmed by Tai and colleagues to be required for HCV replication. CDC42, highly ranked in the screening, was also detected with HTS-Net, which binds to coatomer. Tai and Gonzalez also reported CDC42.
Some genes were reported specifically by HTS-Net. Among them, we found BRCA2, tran-scription factor known for its role in genome stability and which acts as a predisposition gene in breast and ovarian cancers. A large number of genes related to ribosomal machinery are also reported by HTS-Net (e.g. RPS11, RPS13 and others).
We focused the analysis on meta-reg-snw-7133. This meta-subnetwork resulted from the aggregation of 10 subnetworks and contains a number of regulatory elements. Its center is materialized by interactome subnetwork int-snw-7133 itself regulated by EIF3M, present in three regulome subnetworks. This transcription factor is required for protein synthesis but is also known to be a homolog of Tango7 in drosophila, implicated in Golgi transport [46]. While having a score relatively high (4.41), these genes were not originally detected by Tai et al. as top-scoring genes. As a TF, this could represent a valuable HCV target.
Tai did not initially retain PIP5K1A, which has a mildly significant z-score (-1.820). Nevertheless, it belongs to several high-scoring meta-subnetworks (best meta subnetwork score = 4.751). We found this kinase in a single interactome subnetwork, interacting with COPA, PSMD1 and the ribosomal machinery (Fig 6C) and four meta-subnetworks.
HACD3 (PTPLAD1, BIND1) was also specifically found by HTS-Net. It is a regulator of the viral replication [47]. Tai did not identify this gene because of its lower score (0.875), but its mechanism of action has been shown with HTS-Net. This gene is present in two meta-subnet-works through its presence as the seed of a regulatory subnetwork (reg-snw-51495), which has a high score (4.504).
We also looked for GO enrichment of HTS-Net subnetworks. Among them, int-snw-4381 is significantly enriched for the GO terms ‘viral transcription’ (p = 2.07x10⁻²⁷) and ‘viral life cycle’ (p = 2.95x10⁻²⁷) genes. GO enrichment of all genes identified with HTS-Net is provided as supplementary material.
Comparison of HTS-Net with existing algorithms
In order to understand the differences and common points of HTS-Net with existing
approaches, we performed a complete analysis of the Tai dataset with three approaches: analy-sis program by Gonzales & Zimmer [11], specifically designed for RNAi, the general-purpose network analysis program HotNet2 [20] and the CARD suite [21]. We specifically used the Tai dataset since the analysis by Gonzales & Zimmer’s method was only available for this dataset. Lists of hits identified by each method are provided as supplementary material Excel file on the HTS-Net Web site and asS2 File. Key results of the comparison are reported inTable 2. Venn diagrams comparing the overlap among methods are shownFig 7.
HTS-Net. The running time was 20 minutes when running the parallelized code version
on our local cluster. The public web site run is 1h48 minutes.
HTS-Net allowed the identification of PIP5K1A as hit. Neither Tai nor Gonzalez found this gene in their analyses. Interestingly, it was previously found to be implicated in HCV virus host entry and replication [48]. Other specific findings are detailed section 3.4.
Gonzales & Zimmer. Gonzales & Zimmer’s method yielded 128 genes. The number of
clusters is not described, but the authors merged them all in one single network. The calculat-ing cost was not specified. Gonzales detected 23 genes initially found by Tai, while 46 genes were also detected by HTS-Net (Fig 7A), showing a closer topology with HTS-Net had also 23 genes common with the set published by Tai. EIF3M has a score relatively high (4.41), but was not originally identified as hits by Tai et al.; it was identified by Gonzalez and HTS-Net. As a TF, this could represent a valuable HCV target.
CARD. Using the RNAiCut and Network analysis modules from CARD, we obtained 119
genes (on 3 subnetworks) for network of hits genes (score greater that 2.786) and 493 genes with non hits (z-score lower than 1.0). The system allows downloading networks of hits. We then proceeded with the functional analysis of the obtained genes for comparison with other methods. The running time was about 40 minutes for RNAiCut and a few seconds for Network analysis.
The use of CARD on the Tai dataset revealed 19 genes already detected by Tai, and 61 genes were common with HTS-Net result (Fig 7B). Among them was found NCOA6, a scriptional coactivator that can interact with nuclear hormone receptors to enhance their tran-scriptional activator functions. COPA, COPB1, COPB2, COPZ1, the coatomer protein
Table 2. Comparison between HTS-Net and Gonzales & Zimmer's method, CARD and HotNet2.
Method Type Interactome Statistical
validation Cost value/subnetwork score Specificities Diskfootprint Running timewith default parameters. HTS-Net Web server
+Source code executable
HPRD, BIND, DIP, I2D,IntAct, MINT, ProteinPedia, TRED, ITFP, TRANSFAC (internal use only), OregAnno, PAZAAR
Topology of gene
network Maximisation ofsubnetwork score Triple statisticalvalidation, regulation analysis on regulome
500Mo 1h48
Gonzales &
Zimmer Not provided STRING Co clustering onnetwork proximity and score
Maximisation of
subnetwork score Approach based onclustering Unknown Unknown CARD Web Server HPRD, BIND, BioGrid Number and size
of subnetworks Gene connectivity Complete web serverthat includes low-level RNAi data processing
Unknown 40minutes HotNet2 Source code to
be installed HPRD, iRefIndex Number and sizeof subnetworks Diffusion andmaximization of subnetwork score
Initially designed for
mutation analysis. 60Go 40+ hours This table summarizes scores and statistical testing method provided that details are found in each method's original publication.
Fig 7. Measure of overlaps between Tai, HTS-Net and other methods. Overlaps between Tai's initially detected hits, HTS-Net analysis, and other methods are represented under the form of Venn diagrams. In Fig 7A is shown the overlap with Gonzales & Zimmer's method, in Fig 7B is shown the overlap with CARD and in Fig 7C is shown the overlap with HotNet2.
complex subunit alpha, beta 1, beta 2 and zeta1 were identified by CARD. Tai initially detected them as primary hits, and their important role for protein trafficking was detailed in their pub-lication. However, HTS-Net and Gonzales’s method were also able to detect these genes of importance. SERBP1 was identified, also identified by HTS-Net, together with ribosomal pro-teins and EIF3M, known to interact with the hepatitis C virus internal ribosomal entry site (IRES) [49]. RAN (RAS-related nuclear protein) was detected by all methods with the excep-tion of HotNet2. It is a small GTP binding protein belonging to the RAS superfamily that is essential for the translocation of RNA and proteins through the nuclear pore complex and known to be an HCV antibody [50].
HotNet2. We performed a run after establishing influences matrices for HPRD networks
plus 100 random influences matrices for statistical analysis, and computing heat matrix for the Tai dataset after appropriate data formatting. After run, HotNet2 returned 4 analyses with 4 different Delta values. Changing Delta had a large impact on the size and number of the sub-networks found. In order to obtain a reasonable subnetwork size, we chose delta = 0,0244, that yielded 36 subnetworks of size 5 or more. The running time was 40h 45min to generate influ-ence matrices for HPRD network (this step is done only once) and 12min 32sec for the Hot-Net2 run itself, using 4 cores.
There were only 4 genes in common between Hotnet2 and HTS-Net, while no genes initially detected by Tai (Fig 7C). This can be due to the different metric, which was initially designed for mutations and that gives higher weight to network connections with the heat diffusion process. Also, the program only included HPRD in its current distribution, which may be another limiting factor. HotNet2 makes possible to include new interactomes, but the computational cost of calculating influence matrices is prohibitive on our local setting.
We examined results for the top-scoring subnetwork. It contains PPP1CB, which is an inter-esting hit, although not found by other programs, since it has been found in the first 40 up-reg-ulated genes in HCV-related Hepatocellular carcinoma (HCC) samples analyzed by De Giorgi and colleagues [51]. However, none of the strong hits initially identified by Tai were found.
Discussion
We developed a new tool, HTS-Net, which uses a systems biology algorithm for the unbiased identification of potential candidates in RNAi screenings. HTS-Net replaces genes in their interaction and regulatory context to discover modules of interacting genes that are biologi-cally relevant to the experiment. We demonstrated the usefulness of our approach on three biological applications: regulation of human embryonic stem cells (Chia et al., 2010)[39] differ-entiation of breast cancer stem cells [38], and identification of human host-HCV regulators (Tai et al., 2009). [37]
Chia et al. built an RNAi screen for the identification of hESC identity. Our approach allowed identifying a number of genes that were not previously found by Chia. Among them, we identified PRC2 as master regulator of hESC differentiation.
Wolf et al. built an RNAi screening to identify key regulators of breast cancer stem cells (CSC) behavior. The re-analysis with HTS-Net allowed identifying the role of the autophagy regulator ATGA4 in the maintenance of the CSC subpopulation. While HTS-Net did not iden-tify ATG4A to have a role in CSC behavior, we were able to ideniden-tify ATG4B and its interacting neighbors.
The Tai analysis dealt with the identification of human host proteins that interact with and support HCV replication. We compared results of the original publication and a re-analysis of these data by Gonzalez. All studies identified genes in the COPI coat, but our method was spe-cifically able to identify kinases such as PIP5K1A.
The comparison with other reference programs on the Tai dataset shows that HTS-Net was able to retrieve a large number of hits identified in the original publication while identifying new hits not identified by other network approaches. HTS-Net offers a more complete biologi-cal environment for RNAi hits by using regulatory data. To some extent, HTS-Net was closer to other network approaches than Tai (larger overlap). This is due to general similarities in network analysis that are able to include hits having lower scores but higher connectivities. HTS-Net had closer results with CARD and Gonzales & Zimmer, while HotNet2 gave distant results, which may be due to the fact that this is not a method specifically designed for RNAi analysis. In terms of hardware, HTS-Net is provided under source code and cluster implemen-tation, or can be used as a web service, requiring no installation but with a longer running time. CARD is a web-only service, while HotNet2 requires local installation. Gonzales & Zim-mer did not provide web service or source code.
Conclusion
We are proposing the pipeline HTS-Net, a network-based RNAi analysis pipeline, for the anal-ysis of RNAi screening data. The pipeline is available from our Mobyle server, and was tested with three datasets and compared with other networks-based approaches, some specifically designed for RNAi screening analyses (CARD) [21], Gonzales & Zimmer’s approach [11], and other for general-purpose analysis (HotNet2) [20].
Our approach showed many advantages when compared with other methods. It has similar (Gonzales) or more (CARD, Hotnet2) genes found in common with the Tai analysis, which means that fundamental biological information is retrieved, while keeping the ability of dis-covering new hits of interest. The production of exhaustive reports allows causal exploration of gene networks, since regulatory data is included in the pipeline, feature not proposed by other software (with the exception of HotNet2). Running time stays reasonable on a web server, and fast execution can be provided when needed by local installation and run on a Linux server or cluster.
The HTS-Net algorithm avoids defining a hard cutoff on individual genes, allows bypassing the limitations of traditional analyses and unravels key components for the studied systems, such as master genes regulators. Our approach is a first answer to deciphering the regulatory complexity of studied systems in RNAi screenings. Possible improvements include taking into account the interaction quality when building subnetworks, by introducing weighted ver-tices reflecting the nature of the interactions and the biological evidence that supports it. As genome-wide experimental setups such as the one presented here are becoming commonplace, tools such as HTS-Net will be more and more useful to carry advanced analytics.
Supporting information
S1 File. Gene Ontology terms enrichment table for HTS-Net runs for Wang, Tai and Wolf datasets. This file contains Gene Ontology terms enrichment information for the 3 HTS-Net
runs studied in this paper (Wang, Tai and Wolf datasets) along with count of terms and statis-tics. Significant GO terms enrichment (using hypergeometric statistical test along a Benja-mini-Hotchberg correction fixed at an FDR of 5%) are highlighted in yellow.
(XLSX)
S2 File. Genes reported as targets for the Tai dataset. This file lists genes detected as targets
in the original Tai publication, by Gonzales’s method, and HTS-Net, Hotnet2 and CARD algo-rithms.
Acknowledgments
This work has been supported by the French Institut National du Cancer grant INCA_5911 to CG and GB.
Author Contributions
Conceptualization: Claire Rioualen, Quentin Da Costa, Emmanuelle Charafe-Jauffret,
Chris-tophe Ginestier, Ghislain Bidaut.
Data curation: Claire Rioualen, Quentin Da Costa, Ghislain Bidaut.
Formal analysis: Claire Rioualen, Quentin Da Costa, Emmanuelle Charafe-Jauffret,
Chris-tophe Ginestier, Ghislain Bidaut.
Funding acquisition: Christophe Ginestier, Ghislain Bidaut. Investigation: Christophe Ginestier.
Methodology: Claire Rioualen, Quentin Da Costa, Bernard Chetrit, Christophe Ginestier,
Ghislain Bidaut.
Project administration: Emmanuelle Charafe-Jauffret, Christophe Ginestier, Ghislain Bidaut. Resources: Bernard Chetrit.
Software: Claire Rioualen, Quentin Da Costa, Bernard Chetrit, Ghislain Bidaut. Supervision: Emmanuelle Charafe-Jauffret, Christophe Ginestier, Ghislain Bidaut. Validation: Claire Rioualen, Ghislain Bidaut.
Visualization: Claire Rioualen.
Writing ± original draft: Claire Rioualen, Ghislain Bidaut.
Writing ± review & editing: Quentin Da Costa, Bernard Chetrit, Christophe Ginestier.
References
1. Mohr SE, Perrimon N. RNAi screening: new approaches, understandings, and organisms. Wiley Inter-discip Rev RNA. 2012; 3: 145±158.https://doi.org/10.1002/wrna.110PMID:21953743
2. Mohr SE, Smith JA, Shamu CE, NeumuÈller RA, Perrimon N. RNAi screening comes of age: improved techniques and complementary approaches. Nat Rev Mol Cell Biol. 2014; 15: 591±600.https://doi.org/ 10.1038/nrm3860PMID:25145850
3. Mpindi J-P, Potdar S, Bychkov D, Saarela J, Saeed K, Wennerberg K, et al. Impact of normalization methods on high-throughput screening data with high hit-rates and drug testing with dose-response data. Bioinforma Oxf Engl. 2015;https://doi.org/10.1093/bioinformatics/btv455PMID:26254433 4. Zhang XD, Yang XC, Chung N, Gates A, Stec E, Kunapuli P, et al. Robust statistical methods for hit
selection in RNA interference high-throughput screening experiments. Pharmacogenomics. 2006; 7: 299±309.https://doi.org/10.2217/14622416.7.3.299PMID:16610941
5. Zhang XD. A pair of new statistical parameters for quality control in RNA interference high-throughput screening assays. Genomics. 2007; 89: 552±561.https://doi.org/10.1016/j.ygeno.2006.12.014PMID:
17276655
6. Goktug AN, Ong SS, Chen T. GUItars: a GUI tool for analysis of high-throughput RNA interference screening data. PloS One. 2012; 7: e49386.https://doi.org/10.1371/journal.pone.0049386PMID:
23185323
7. Garcia M, Millat-Carus R, Bertucci F, Finetti P, Birnbaum D, Bidaut G. Interactome-transcriptome inte-gration for predicting distant metastasis in breast cancer. Bioinforma Oxf Engl. 2012; 28: 672±678.
8. Gu J, Chen Y, Li S, Li Y. Identification of responsive gene modules by network-based gene clustering and extending: application to inflammation and angiogenesis. BMC Syst Biol. 2010; 4: 47.https://doi. org/10.1186/1752-0509-4-47PMID:20406493
9. Dao P, Wang K, Collins C, Ester M, Lapuk A, Sahinalp SC. Optimally discriminative subnetwork mark-ers predict response to chemotherapy. Bioinformatics. 2011; 27: i205±i213.https://doi.org/10.1093/ bioinformatics/btr245PMID:21685072
10. Hofree M, Shen JP, Carter H, Gross A, Ideker T. Network-based stratification of tumor mutations. Nat Methods. 2013; 10: 1108±1115.https://doi.org/10.1038/nmeth.2651PMID:24037242
11. Gonzalez O, Zimmer R. Contextual analysis of RNAi-based functional screens using interaction net-works. Bioinformatics. 2011; 27: 2707±2713.https://doi.org/10.1093/bioinformatics/btr469PMID:
21835772
12. Wang L, Tu Z, Sun F. A network-based integrative approach to prioritize reliable hits from multiple genome-wide RNAi screens in Drosophila. BMC Genomics. 2009; 10: 220.https://doi.org/10.1186/ 1471-2164-10-220PMID:19435510
13. Szklarczyk D, Franceschini A, Wyder S, Forslund K, Heller D, Huerta-Cepas J, et al. STRING v10: pro-tein-protein interaction networks, integrated over the tree of life. Nucleic Acids Res. 2015; 43: D447± 452.https://doi.org/10.1093/nar/gku1003PMID:25352553
14. Bankhead A, Sach I, Ni C, LeMeur N, Kruger M, Ferrer M, et al. Knowledge based identification of essential signaling from genome-scale siRNA experiments. BMC Syst Biol. 2009; 3: 80.https://doi.org/ 10.1186/1752-0509-3-80PMID:19653913
15. Murali TM, Dyer MD, Badger D, Tyler BM, Katze MG. Network-based prediction and analysis of HIV dependency factors. PLoS Comput Biol. 2011; 7: e1002164.https://doi.org/10.1371/journal.pcbi. 1002164PMID:21966263
16. Gitter A, Bar-Joseph Z. Identifying proteins controlling key disease signaling pathways. Bioinforma Oxf Engl. 2013; 29: i227±236.https://doi.org/10.1093/bioinformatics/btt241PMID:23812988
17. Amberkar SS, Kaderali L. An integrative approach for a network based meta-analysis of viral RNAi screens. Algorithms Mol Biol AMB. 2015; 10: 6.https://doi.org/10.1186/s13015-015-0035-7PMID:
25691914
18. Wilson JL, Dalin S, Gosline S, Hemann M, Fraenkel E, Lauffenburger DA. Pathway-based network modeling finds hidden genes in shRNA screen for regulators of acute lymphoblastic leukemia. Integr Biol Quant Biosci Nano Macro. 2016; 8: 761±774.https://doi.org/10.1039/c6ib00040aPMID:27315426 19. Tuncbag N, Gosline SJC, Kedaigle A, Soltis AR, Gitter A, Fraenkel E. Network-Based Interpretation of
Diverse High-Throughput Datasets through the Omics Integrator Software Package. PLoS Comput Biol. 2016; 12: e1004879.https://doi.org/10.1371/journal.pcbi.1004879PMID:27096930
20. Leiserson MDM, Vandin F, Wu H-T, Dobson JR, Eldridge JV, Thomas JL, et al. Pan-cancer network analysis identifies combinations of rare somatic mutations across pathways and protein complexes. Nat Genet. 2015; 47: 106±114.https://doi.org/10.1038/ng.3168PMID:25501392
21. Dutta B, Azhir A, Merino L-H, Guo Y, Revanur S, Madhamshettiwar PB, et al. An interactive web-based application for Comprehensive Analysis of RNAi-screen Data. Nat Commun. 2016; 7: 10578.https:// doi.org/10.1038/ncomms10578PMID:26902267
22. Salwinski L, Miller CS, Smith AJ, Pettit FK, Bowie JU, Eisenberg D. The Database of Interacting Pro-teins: 2004 update. Nucleic Acids Res. 2004; 32: D449±451.https://doi.org/10.1093/nar/gkh086PMID:
14681454
23. Keshava Prasad TS, Goel R, Kandasamy K, Keerthikumar S, Kumar S, Mathivanan S, et al. Human Protein Reference DatabaseÐ2 009 update. Nucleic Acids Res. 2009; 37: D767±772.https://doi.org/ 10.1093/nar/gkn892PMID:18988627
24. Brown KR, Jurisica I. Unequal evolutionary conservation of human protein interactions in interologous networks. Genome Biol. 2007; 8: R95.https://doi.org/10.1186/gb-2007-8-5-r95PMID:17535438 25. Kerrien S, Aranda B, Breuza L, Bridge A, Broackes-Carter F, Chen C, et al. The IntAct molecular
inter-action database in 2012. Nucleic Acids Res. 2012; 40: D841±846.https://doi.org/10.1093/nar/gkr1088
PMID:22121220
26. Licata L, Briganti L, Peluso D, Perfetto L, Iannuccelli M, Galeota E, et al. MINT, the molecular interaction database: 2012 update. Nucleic Acids Res. 2012; 40: D857±861.https://doi.org/10.1093/nar/gkr930
PMID:22096227
27. Kandasamy K, Keerthikumar S, Goel R, Mathivanan S, Patankar N, Shafreen B, et al. Human Protein-pedia: a unified discovery resource for proteomics research. Nucleic Acids Res. 2009; 37: D773±781.
28. Ravasi T, Suzuki H, Cannistraci CV, Katayama S, Bajic VB, Tan K, et al. An atlas of combinatorial tran-scriptional regulation in mouse and man. Cell. 2010; 140: 744±752.https://doi.org/10.1016/j.cell.2010. 01.044PMID:20211142
29. MysÏičkovaÂA, Vingron M. Detection of interacting transcription factors in human tissues using predicted DNA binding affinity. BMC Genomics. 2012; 13 Suppl 1: S2. https://doi.org/10.1186/1471-2164-13-S1-S2PMID:22369666
30. Yu X, Lin J, Zack DJ, Qian J. Computational analysis of tissue-specific combinatorial gene regulation: predicting interaction between transcription factors in human tissues. Nucleic Acids Res. 2006; 34: 4925±4936.https://doi.org/10.1093/nar/gkl595PMID:16982645
31. Zheng G, Tu K, Yang Q, Xiong Y, Wei C, Xie L, et al. ITFP: an integrated platform of mammalian tran-scription factors. Bioinforma Oxf Engl. 2008; 24: 2416±2417.https://doi.org/10.1093/bioinformatics/ btn439PMID:18713790
32. Jiang C, Xuan Z, Zhao F, Zhang MQ. TRED: a transcriptional regulatory element database, new entries and other development. Nucleic Acids Res. 2007; 35: D137±D140.https://doi.org/10.1093/nar/gkl1041
PMID:17202159
33. Matys V, Kel-Margoulis OV, Fricke E, Liebich I, Land S, Barre-Dirrie A, et al. TRANSFAC and its module TRANSCompel: transcriptional gene regulation in eukaryotes. Nucleic Acids Res. 2006; 34: D108±110.
https://doi.org/10.1093/nar/gkj143PMID:16381825
34. Griffith OL, Montgomery SB, Bernier B, Chu B, Kasaian K, Aerts S, et al. ORegAnno: an open-access community-driven resource for regulatory annotation. Nucleic Acids Res. 2008; 36: D107±113.https:// doi.org/10.1093/nar/gkm967PMID:18006570
35. Portales-Casamar E, Arenillas D, Lim J, Swanson MI, Jiang S, McCallum A, et al. The PAZAR database of gene regulatory information coupled to the ORCA toolkit for the study of regulatory sequences. Nucleic Acids Res. 2009; 37: D54±60.https://doi.org/10.1093/nar/gkn783PMID:18971253
36. Ochs MF, Peterson AJ, Kossenkov A, Bidaut G. Incorporation of gene ontology annotations to enhance microarray data analysis. Methods Mol Biol Clifton NJ. 2007; 377: 243±254.https://doi.org/10.1007/ 978-1-59745-390-5_15PMID:17634621
37. Chia N-Y, Chan Y-S, Feng B, Lu X, Orlov YL, Moreau D, et al. A genome-wide RNAi screen reveals determinants of human embryonic stem cell identity. Nature. 2010; 468: 316±320.https://doi.org/10. 1038/nature09531PMID:20953172
38. Wolf J, Dewi DL, Fredebohm J, MuÈller-Decker K, Flechtenmacher C, Hoheisel JD, et al. A mammo-sphere formation RNAi screen reveals that ATG4A promotes a breast cancer stem-like phenotype. Breast Cancer Res BCR. 2013; 15: R109.https://doi.org/10.1186/bcr3576PMID:24229464
39. Tai AW, Benita Y, Peng LF, Kim S-S, Sakamoto N, Xavier RJ, et al. A Functional Genomic Screen Iden-tifies Cellular Cofactors of Hepatitis C Virus Replication. Cell Host Microbe. 2009; 5: 298±307.https:// doi.org/10.1016/j.chom.2009.02.001PMID:19286138
40. Thomson JA, Itskovitz-Eldor J, Shapiro SS, Waknitz MA, Swiergiel JJ, Marshall VS, et al. Embryonic stem cell lines derived from human blastocysts. Science. 1998; 282: 1145±1147. PMID:9804556 41. NeÂron B, MeÂnager H, Maufrais C, Joly N, Maupetit J, Letort S, et al. Mobyle: a new full web
bioinformat-ics framework. Bioinforma Oxf Engl. 2009; 25: 3005±3011.https://doi.org/10.1093/bioinformatics/ btp493PMID:19689959
42. Boyer LA, Plath K, Zeitlinger J, Brambrink T, Medeiros LA, Lee TI, et al. Polycomb complexes repress developmental regulators in murine embryonic stem cells. Nature. 2006; 441: 349±353.https://doi.org/ 10.1038/nature04733PMID:16625203
43. Conway E, Healy E, Bracken AP. PRC2 mediated H3K27 methylations in cellular identity and cancer. Curr Opin Cell Biol. 2015; 37: 42±48.https://doi.org/10.1016/j.ceb.2015.10.003PMID:26497635 44. VizaÂn P, Beringer M, BallareÂC, Di Croce L. Role of PRC2-associated factors in stem cells and disease.
FEBS J. 2015; 282: 1723±1735.https://doi.org/10.1111/febs.13083PMID:25271128
45. Corda D, Kudo T, Zizza P, Iurisci C, Kawai E, Kato N, et al. The developmentally regulated osteoblast phosphodiesterase GDE3 is glycerophosphoinositol-specific and modulates cell growth. J Biol Chem. 2009; 284: 24848±24856.https://doi.org/10.1074/jbc.M109.035444PMID:19596859
46. Bard F, Casano L, Mallabiabarrena A, Wallace E, Saito K, Kitayama H, et al. Functional genomics reveals genes involved in protein secretion and Golgi organization. Nature. 2006; 439: 604±607.https:// doi.org/10.1038/nature04377PMID:16452979
47. Taguwa S, Okamoto T, Abe T, Mori Y, Suzuki T, Moriishi K, et al. Human butyrate-induced transcript 1 interacts with hepatitis C virus NS5A and regulates viral replication. J Virol. 2008; 82: 2631±2641.
https://doi.org/10.1128/JVI.02153-07PMID:18160438
48. Trotard M, Lepère-Douard C, ReÂgeard M, Piquet-Pellorce C, Lavillette D, Cosset F-L, et al. Kinases required in hepatitis C virus entry and replication highlighted by small interference RNA screening.
FASEB J Off Publ Fed Am Soc Exp Biol. 2009; 23: 3780±3789.https://doi.org/10.1096/fj.09-131920
PMID:19608626
49. Lu H, Li W, Noble WS, Payan D, Anderson DC. Riboproteomics of the hepatitis C virus internal ribo-somal entry site. J Proteome Res. 2004; 3: 949±957.https://doi.org/10.1021/pr0499592PMID:
15473682
50. Deguchi M, Kagita M, Yamashita N, Nakano T, Tahara K, Asari S, et al. [Comparison of eight screening tests for ant-HCV antibody]. Kansenshogaku Zasshi. 2002; 76: 711±720. PMID:12391674
51. De Giorgi V, Monaco A, Worchech A, Tornesello M, Izzo F, Buonaguro L, et al. Gene profiling, biomark-ers and pathways characterizing HCV-related hepatocellular carcinoma. J Transl Med. 2009; 7: 85.