HAL Id: hal-00920944
https://hal.archives-ouvertes.fr/hal-00920944
Submitted on 9 Jan 2014
HAL is a multi-disciplinary open access
archive for the deposit and dissemination of
sci-entific research documents, whether they are
pub-lished or not. The documents may come from
teaching and research institutions in France or
abroad, or from public or private research centers.
L’archive ouverte pluridisciplinaire HAL, est
destinée au dépôt et à la diffusion de documents
scientifiques de niveau recherche, publiés ou non,
émanant des établissements d’enseignement et de
recherche français ou étrangers, des laboratoires
publics ou privés.
Semantic Approach in Image Change Detection
Adrien Gressin, Nicole Vincent, Clément Mallet, Nicolas Paparoditis
To cite this version:
Adrien Gressin, Nicole Vincent, Clément Mallet, Nicolas Paparoditis. Semantic Approach in Image
Change Detection. Advanced Concepts for Intelligent Vision Systems, Oct 2013, Poznan, Poland.
pp.450–459. �hal-00920944�
Semantic approach in image change detection
Adrien Gressin1,2, Nicole Vincent2, Cl´ement Mallet1 and Nicolas Paparoditis1
1 IGN/SR, MATIS, 73 avenue de Paris, 94160 Saint-Mande, France,
2 LIPADE - SIP, Paris-Descartes University, 45 Rue des Saint-P`eres, Paris, France,
Abstract. Change detection is a main issue in various domains, and especially for remote sensing purposes. Indeed, plethora of geospatial images are available and can be used to update geographical databases. In this paper, we propose a classification-based method to detect changes between a database and a more recent image. It is based both on an efficient training point selection and a hierarchical decision process. This allows to take into account the intrinsic heterogeneity of the objects and themes composing a database while limiting false detection rates. The reliability of the designed framework method is first assessed on simulated data, and then successfully applied on very high resolution satellite images and two land-cover databases.
Keywords: change detection, updating, classification, image, database
1
Introduction
Geographic databases are nowadays almost complete in most developed coun-tries. However, their update remains challenging, even if spatial imagery allows to cover, in a cost-effective way, large areas with higher and higher resolutions. More generally, image change detection is a large subject of research, in various domain such as video surveillance, civil infrastructure or medical diagnostic [13]. A large body of literature about change detection exists : between image pairs [10, 11], time-series [14, 7, 12], using very-high-resolution images [1]. In the re-mote sensing field, very few papers study the discrepancies between a database and more recent images. For instance, [9] matches database objects with im-age saliencies. In fact, most methods are designed for very specific object types (road, building, etc.) [3], and manual photo-interpretation methods remain the most efficient tool [2].
In this paper, we propose a general framework for change detection, effective on various database types, by remaining independent of the object character-isation. Thereby, our method is able to deal with every kind of object (road, building, crop, forest ...). With a careful inspection of the database, our method provides a probability change map that allows to focus on change areas for sub-sequent and specific database update. In Section 2, we describe our hierarchical approach in the context of imagery. Then, we assess our method with several
experiments on simulated data (Section 3), and successfully apply it on real re-mote sensing data, namely very high resolution satellite images and geographic databases (Section 4). Finally, conclusions are drawn in Section 5.
2
Methodology
Geographic database are structured in a hierarchical manner : objects (namely 2D polygons) are grouped by themes (e.g., roads, forests, crops, etc.), themselves composing the database (DB, cf. Figure 1a). The objects of all the themes of a DB may not provide a full coverage of given area: the complementary part is called background. In order to detect changes, the whole database needs to be inspected and therefore the whole structure of the database. Thus, a hierarchical analysis is designed at three different levels: the object level, the theme level, and the database level (Figure 1b). At last, this database inspection allows to obtain a change probability map. Our approach is based on the Support Vector Machines (SVM) classifier because (1) it can handle a large number of features, (2) it has a high generalisation ability, and (3) it is fast enough to perform as many classifications as required (see below). A supervised approach is chosen since we consider that only minor changes exist between the DB and the image, meaning that the DB can be used to learn the appearance of the object and the themes that compose it (Figure 1).
Old database objects & new image
Probability images per object
...
Old database themes
A new labelling & Probability change map
Probability images per theme Database level Theme level Object level Objects Background Theme 1 Theme 2 Theme 3 (a) (b) Database structure :
Fig. 1.(a) Database covering part of the image. (b) General view of our hierarchical methodology (see text for more details).
2.1 Object level
The aim of the object level analysis is to learn the different appearances of a theme in the most recent image in order to consolidate the decision taken at
the theme level. This inspection is based on a supervised classification using features derived from the image, trained on a restricted but efficient subset of pixels. The selection of the training points is based on a two-step maximization of the classification recall [5]. Two selections are successively performed: one for the current object (foreground ) and another one for the rest of the DB (background ). First, a background subset is randomly drawn among pixels out of the cur-rent theme. Such pixels may correspond to any other theme of the DB or may belong to the DB background (Figure 1a). Several foreground subsets are then randomly retrieved among pixels composing the current object. A Gaussian ker-nel soft-margin SVM is trained for each foreground subset, coupled with the background subset, and applied on all object pixels. The subset maximizing the recall of the object is selected. Similarly, the background subset is chosen by randomly selecting several subsets of pixels out of the current theme.
The optimal training set is finally defined as the union of the two best back-ground and foreground subsets, and used to perform a classification of the full image. As for the subset selection step, a grid search method is applied to select the best hyper-parameters (C & γ) that maximize the cross-validation accu-racy. Finally, a probability estimate to belong to the current object theme [17] is obtained for each pixel.
2.2 Theme level
Probability images obtained for each object of a given theme are merged in order to obtain a single probability image per theme. This confidence map allows to define, for each pixel, the probability of this pixel to belong to the current theme. Various methods have been tested in order to fuse those probability results, such as minimum or maximum values. Finally, the mean of all the probability images for each object of one theme gives the most satisfactory results. In prac-tice, the mean value weighted by the size of each object is used in order to give more confidence on large objects that are less supposed to change.
2.3 Database level
The database level is composed of two steps. First, a fusion of all probability images per theme is performed. Secondly, a decision process allows to obtain a unified probability change map (for each pixel, its new label accompanied with a confidence measure ). Thereby, the label is obtained by keeping the theme with the maximum of probability computed at the theme level. Then, two measures of confidence are proposed and described below.
The maximum of probability provides a good absolute measure of how confi-dent we are on the labelling. However, if at least two theme probability measures have high values, then the maximum of probability is high but the confidence is low. Thus, another measure, called margin, is proposed.
The margin is defined as the difference between the two highest probability values. This measure allows to assess the superiority of one labelling on the second most important.
The final labels are then compared with the initial database, resulting in a map of changes. This map is weighted by the maximum of probability confidence measures in order to obtain a probability change map. Such image is a traditional useful asset for final manual correction and checking before irreversible database update.
3
Experiments on simulated data
Simulated data have been generated in order to study the behaviour of our proposed method, while remaining independent of the method used to charac-terize objects of the database on the image (i.e. features). Simulated data are first introduced. Then, three experiments are described and analyzed. The first one is performed on ideal data and the next ones are designed to analyze the robustness of the method with respect to three possible degradations, the low discrimination between themes, the lack of homogeneity in a theme and the blur that can be present in the data.
3.1 Simulated data description
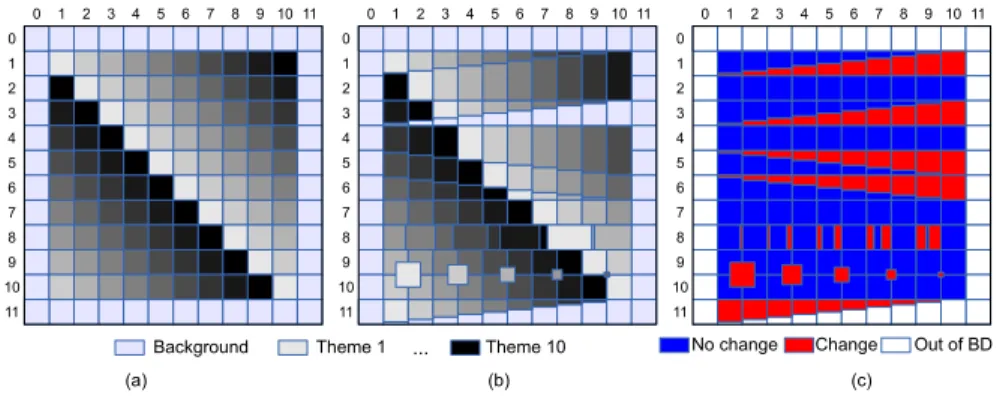
Our simulated data are composed of two parts, first of initial database (to be updated), secondly of the simulated image (used to update the database). For convenience of the presentation, the database is modelled by an image, figuring the labels and the objects associated with each label. Each object is coloured according to his theme. In the simulated image, each object has a single fea-ture, its gray-level, the same as in the database image (Figure 2a-b). The initial database is composed of one hundred objects, equally distributed in ten themes. Objects are dispatched on a regular grid (Figure 2a).
Light gray-blue areas surrounding the image (columns 0 & 11 and lines 0 & 11) model unlabelled areas that may exist. The simulated image is composed of one hundred and one objects of various sizes (Figure 2b). Several changes are introduced between the initial database and the simulated image (Figure 2c). Four objects disappear while fifteen appear. Objects of each line change in the same way in increasing proportion from 10% to 100%. Four experiments have been set up. The method is first applied to the simulated data, without any mod-ification, and provides a reference for the next experiments. Then, three different kinds of modifications are introduced on the simulated image to assess how the method is robust to: similar themes, inhomogeneous themes, and blurred data. 3.2 Ideal condition
The three levels of inspection described in Section 2 are first evaluated on the default configuration (Figure 2b).
11 11 0 0 1 2 3 4 5 6 7 8 9 10 1 2 3 4 5 6 7 8 9 10 0 0 11 11 1 2 3 4 5 6 7 8 9 10 1 2 3 4 5 6 7 8 9 10 0 0 11 11 1 2 3 4 5 6 7 8 9 10 1 2 3 4 5 6 7 8 9 10
Background Theme 1 ... Theme 10 No change Change Out of BD
(a) (b) (c)
Fig. 2.(a) Initial database (to be updated), (b) Simulated image (used to update the database) and (c) Ground truth change map. Each cell (i, j) is 100×100 pixels.
First, the object level inspection is performed on each object of each theme of the database. Recall and precision are measured for each object. Since each theme is represented by a single gray-level, recall is always equal to 1 in this case. However, precision may not be equal to 1. For instance, in case of object size decrease (e.g., any cell of line 1), there is a confusion between the current object theme and the substituting theme. It results in lower precision values, ranging from 0.21 to 0.6, depending on the global surface of the replacing theme (from 30% to less than 10%, respectively).
Then, theme level inspection is performed. Results of this step allow to cor-rectly classify each theme despite some confusion at the object level.
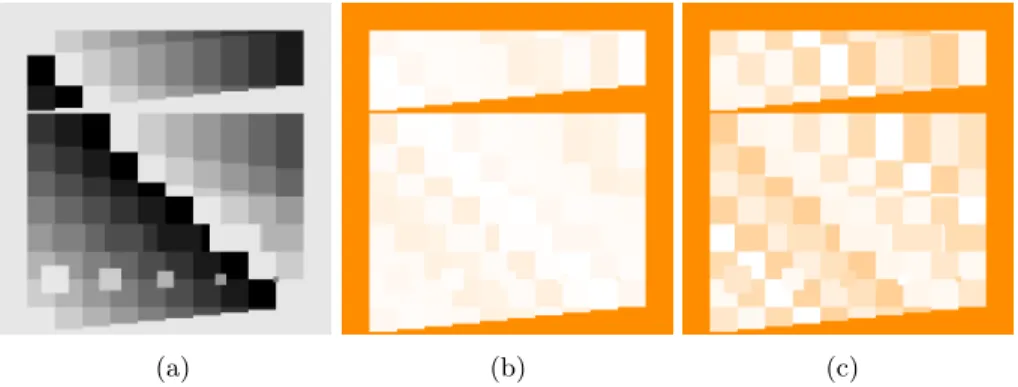
Next, the database level inspection is performed. Results are shown in Fig-ure 3. One can notice all themes are correctly retrieved. The background is merged with theme 1 since no background class is learned in our method and its gray-level is the closest of this theme. However, the two confidence measures (b) and (c) have low values in this area. Moreover, confidence measures show variation between different themes, enhancing their variable surfaces of change. Thus, our probability change map (Figure 4 a) allows to correctly separate true changes from less confident areas. An additional active learning step using man-ual inputs would allow to provide a binary map of changes [4].
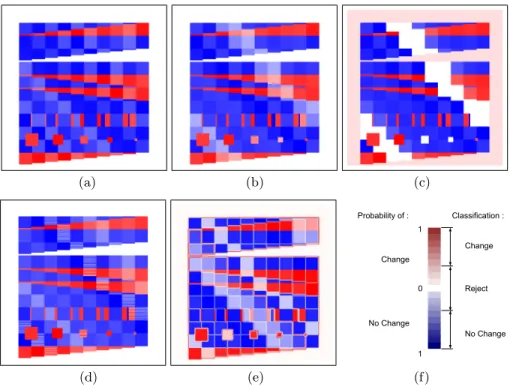
Finally, a precision metric is introduced in order to provide quantitative assessments. First, the probability change map is classified into three classes: change, no-change, and out of BD (Figure 5 f). The classification is simply retrieved by introducing two thresholds on the probability change value. In next experiments, the two thresholds have been arbitrary fixed to −0.2 and 0.2. Then, those classification is compared with the ground truth (Figure 2 c). Under these ideal conditions, the precision is equal to 100%.
(a) (b) (c)
Fig. 3. (a) Theme fusion (one gray-scale per theme), (b) Maximum of probabilities and (c) Margin (orange:0→white:1). Each pixel is correctly labelled (a), except in surrounding areas where the two confident measures (b & c) have low values.
3.3 Similar themes
This second experiment aims to study the ability of our method to separate two themes with almost similar appearance. For this purpose, three themes have been selected: themes 2, 3 and 4 whose gray-scale values are 204, 179 and 153, respectively. Then, the value of theme 3 is iteratively changed with values ranging from 169 to 153, so as to come closer to theme 4 (in this last case, themes 3 and 4 are identical).
The classification process manages to separate the two themes 3 and 4, except when they are equal. Figure 4 (b) shows the final probability change map result when theme 3 is close to theme 4 (gray-scale value:154) and (c) when themes 3 and 4 are identical. Results show that our method is able to deal with similar appearance themes, through the introduction of a confusion measure in addition to the supposed label. The precision is about 86% when themes 3 and 4 are identical, and of 100% otherwise.
3.4 Inhomogeneous theme
The purpose of the third experiment is to assess whether our method is sensitive to non homogeneous objects. Some objects may indeed have two or more distinct appearances. This often happens in geographical databases when an object may include several entities of varying characteristic. Thus, we select the same three themes as previously, and apply two different gray values to pixels of theme 3 objects.
Two different configurations have been tested: one with two gray values be-tween theme 2 and 4 (166 and 191), and one with two values out of these ranges (140 and 217). Then, proportion of the two colors ranges from 10 to 50%.
Results show that our training point selection method is able to efficiently deal with the inhomogeneity of the theme even if a few percent of the theme is dif-ferent of the rest of the theme. Moreover, the Gaussian kernel of the SVM allows to differentiate theme 3, even if not linearly separable from the other themes.
Finally, the probability change map (Figure 4d) allows to mostly discriminate changing / not changing areas (blue/red regions). The precision is about 99% for proportion of 10% in the two different configurations, and of 100% otherwise.
3.5 Blurred data
Since edge between objects are often unclear in remote sensing data, the last experimentation aims to assess our method on blurred data. Thus, a Gaussian filter, with a standard deviation (σ) ranging from 5 to 100 pixels, has been applied on the simulated image.
In this case, classification at the object level and fusion at theme level are both slightly confused. However, the training point selection method allows to minimize this effect. The probability change map for a σ of 10 pixels, shown on Figure 4 (e), allows anyway to determine the majority of real changes. Results precision range from 88% (σ = 100 pixels) to 98% (σ = 5 pixels), assessing the efficiency of the method.
(a) (b) (c) 0 1 1 Change No Change Probability of : Classification : Change No Change Reject (d) (e) (f)
Fig. 4.Probability change maps for the various experiments: (a) Ideal condition, (b) and (c) Similar theme, (d) Inhomogeneous theme and (e) Blurred data. Dark blue cells correspond to areas that are likely not to have changed, whereas red ones indicate the most probable changes. White areas show undefined decisions. (f) show the color map and the thresholds for change / no change classification and a reject class corresponding to area out of the database has been also added.
4
Application to geographical database update
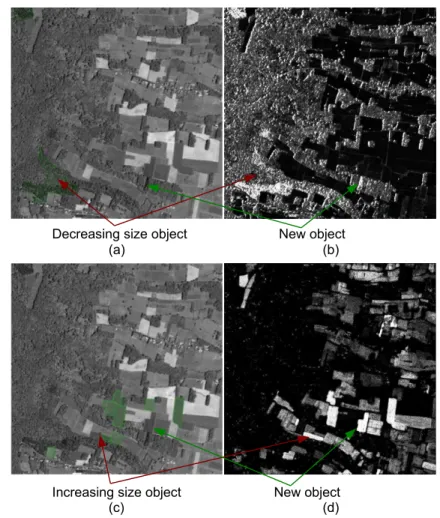
The hierarchical method is applied on remote sensing data in order to update two different land cover databases. Very high satellite imagery is used as input. Two databases are inspected in our study. First, the French Forestry Database is composed of about fifty themes. We focus here on the Theme Douglas fir closed forest. The second one describes the French agricultural crops (about thirty dif-ferent themes). The Theme bread wheat is studied here. These two themes have been selected since they are representative of land-cover classes that should at least yearly monitored. For forested areas, both private companies and national authorities are highly interested in biomass estimation, deforestation or in as-sessing the impact of meteorological events. In case of agricultural themes, ur-ban sprawl surveillance and crop diversity respect monitoring for sustainable development are among the main straightforward applications of such change detection work-flow. A very high resolution optical satellite image, acquired by the Pl´eiades sensor in August 2012, has been used to update those databases (Figure 5 a & c, South-West of France). Images are composed of four spectral bands (red, green, blue and near-infrared) with a 0.5 m resolution.
Classification is computed using four spectral features (the four channels) and two texture features, derived from the spectral ones : (1) the entropy of the histogram of gradient directions [16] and (2) a dense SIFT descriptor is computed, and the first three components of the principal component analysis (PCA) are kept [8].
The mean of the probability estimated for the Douglas fir closed forest theme are shown on Figure 5b, and the mean values for the bread wheat theme are depicted in Figure 5d. The forest theme is composed of two objects, so that results on this theme are more noisy than results on the crops theme (composed of 7 objects).
Nevertheless, our training point selection and hierarchical inspection have allowed to correctly discriminate those themes despite existing changes between initial databases and the image. Indeed, several objects have decreasing size, but do not compromise the classification result. Conversely, newer objects are correctly detected.
5
Conclusion
Since geographical databases need to be quickly and inexpensively updated, au-tomatic methods, efficient at large-scales, have to be developed. In this paper, we have proposed a hierarchical inspection method that allows to compute a change probability map from an old database using a new image at equivalent resolution. This method is based on a carefully designed per object training point selection and a generic decision fusion, that can be applied on various datasets. Our methodology was first assessed on simulated data. Finally, we successfully applied the method on real remote sensing data and land cover databases. Since our method remains independent to any characterisation procedure, it can be
straightforwardly applied on various databases and datasets. In addition, the proposed workflow offers a suitable basis for further extensions in geographical database analysis and processing. Therefore, in future works, we will work on the database update process and on transfer learning. This should allow to both deal with large datasets and propose land-cover classifications in countries where no database exists. Thereafter, our method is planned to be improved by intro-ducing a feature selection step at the object level step, allowing to automatically adapt the process to the nature of the classified objects.
Decreasing size object New object
(a) (b)
Increasing size object New object
(c) (d)
Fig. 5. Images (a) and (c) show the image used for change detection and the old database objects in green. Images (b) and (d) are giving the probability of the two themes Douglas and bread wheat respectively. The white part indicate a high prob-ability. From these maps and initials databases the changes can be deduced and are indicated with the arrows.
References
1. Bruzzone, L., Bovolo, F: A Novel Framework for the Design of Change-Detection Systems for Very-High-Resolution Remote Sensing Images. Proceedings of the IEEE 101(3), 609-630 (2013)
2. Buttner, G. et al.: Corine Land Cover update 2000. Technical guidelines. Copen-hagen, Denmark: European Environment Agency (2002)
3. Champion, N., Boldo, D., Pierrot-Deseilligny, M., Stamon, G.: 2D building change detection from high resolution satellite imagery: A two-step hierarchical method based on 3D invariant primitives. PRL 31(10), 1138-1147 (2010)
4. Demir, B., Minello, L., Bruzzone, L.: An Effective Strategy to Reduce the Labeling Cost in the Definition of Training Sets by Active Learning (2013)
5. Forman, G. : An extensive empirical study of feature selection metrics for text classification. JMLR 3, 1289-1305 (2003)
6. Gomez-Chova, L., et al.: A review of kernel methods in remote sensing data analysis. In Optical Remote Sensing (pp. 171-206). Springer Berlin Heidelberg (2011) 7. Goyette, N., Jodoin, P.-M., Porikli, F., Konrad, J., Ishwar, P.: changedetection.net:
A new change detection benchmark dataset, in Proc. IEEE Workshop on Change De-tection (CDW12) at CVPR12, Providence, RI, (2012) van de Sande, K.E.A., Gevers, T., Snoek, C.G.M.: Evaluating Color Descriptors for Object and Scene Recognition, IEEE Transactions on Pattern Analysis and Machine Intelligence, 32 (9), 1582-1596, (2010)
8. Le Bris, A.: Extraction of vineyards out of aerial ortho-image using texture informa-tion. ISPRS Annals of Photogrammetry, Remote Sensing and the Spatial Information Sciences, Melbourne, Australia (2012)
9. Marcal, A., Borges, J., Gomes, J., Pinto Da Costa, J.: Land cover update by super-vised classification of segmented ASTER images. IJRS 26(7), 1347-1362 (2005) 10. Miller, O., Pikaz, A., Averbuch, A.: Objects based change detection in a pair of
gray-level images. PR 38(11), 1976-1992 (2005)
11. Nemmour, H., CHIBANI, Y.: Change detector combination in remotely sensed imagery. In Advanced Concepts for Intelligent Vision Systems Conference, 31 August to 3 September (Brussels: ACIVS), 373-380 (2004)
12. Petitjean, F., Inglada, J., Ganarski, P.: Satellite image time series analysis under time warping. IEEE TGRS 50(8), 3081-3095 (2012)
13. Radke, R. J., Andra, S., Al-Kofahi, O., Roysam, B.: Image change detection algo-rithms: a systematic survey. IEEE TIP 14(3), 294-307 (2005)
14. Robin, A., Moisan, L., Hegarat-Mascle, S.: An a-contrario approach for subpixel change detection in satellite imagery. IEEE TPAMI 32(11), 1977-1993 (2010) 15. Sch¨olkopf, B., Smola, A. J.: Learning with kernels: support vector machines,
reg-ularization, optimization and beyond. the MIT Press (2002)
16. Trias-Sanz, R., Stamon, G., Louchet, J.: Using colour, texture, and hierarchical segmentation for high-resolution remote sensing. ISPRS Journal of Photogrammetry and remote sensing, 63(2), 156-168 (2008)
17. Wu, T. F., Lin, C. J., Weng, R. C.: Probability estimates for multi-class classifica-tion by pairwise coupling. JMLR 5, 975-1005 (2004)