HAL Id: hal-01672512
https://hal.archives-ouvertes.fr/hal-01672512
Submitted on 3 Jan 2018HAL is a multi-disciplinary open access
archive for the deposit and dissemination of sci-entific research documents, whether they are pub-lished or not. The documents may come from teaching and research institutions in France or abroad, or from public or private research centers.
L’archive ouverte pluridisciplinaire HAL, est destinée au dépôt et à la diffusion de documents scientifiques de niveau recherche, publiés ou non, émanant des établissements d’enseignement et de recherche français ou étrangers, des laboratoires publics ou privés.
Adsorption of nickel ions by oleate-modified magnetic
iron oxide nanoparticles
Cécilia Magnet, Claire Lomenech, Charlotte Hurel, Pierre Reilhac, Francoise
Giulieri, Anne-Marie Chaze, Jacques Persello, Pavel Kuzhir
To cite this version:
Cécilia Magnet, Claire Lomenech, Charlotte Hurel, Pierre Reilhac, Francoise Giulieri, et al.. Ad-sorption of nickel ions by oleate-modified magnetic iron oxide nanoparticles. Environmental Science and Pollution Research, Springer Verlag, 2017, 24 (8), pp.7423-7435. �10.1007/s11356-017-8391-0�. �hal-01672512�
Magnet, C., Lomenech, C., Hurel, C., Reilhac, P., Giulieri, F., Chaze, A. M., Persello J. & Kuzhir, P.
University of Côte d’Azur, CNRS UMR 7010 Institute of Physics of Nice, Parc Valrose 06108 Nice, France
Adsorption of nickel ions by oleate-modified magnetic iron oxide nanoparticles
Abstract
In this work, iron oxide magnetic nanoparticles (MNP) were synthesized, whose surface was recovered with an oleate double layer in order to investigate the ability of this material to adsorb nickel ions. First, the solution chemistry of oleate ions was investigated in order to determine the CMC value and the arrangements of ions above the CMC. Then, the synthesized oleate-modified MNP were characterized (TEM, DLS, XRD, FT-IR, zeta potential, magnetometry). Finally, adsorption experiments were carried out from pH 5 to pH 9, for nickel concentrations ranging from 10-6 to 2 10-4 mol/L, in 0.1 g/L suspensions of oleate-modified MNP.
The results show that the CMC of oleate ranges from 1 to 2.5 mmol/L. Above the CMC, arrangement of oleate ions as droplets, vesicles or micelles depends on pH and influences the average size and solution absorbance. Potentiometric titrations allowed determining a pKa value of 8.4 for sodium oleate. The high stability in aqueous suspensions and characterization of oleate-modified MNP confirm that oleate ions are arranged as a bilayer coating at the surface of MNP. Retention of nickel was found to be highly dependent on pH, with a maximum adsorption (90%) beginning from pH = 7.5. The sorption isotherms were well fitted with the Langmuir model and the maximum nickel adsorption capacities were found to be 44 and 80 mg/g for pH = 6.8 and 7.2, respectively. The efficient removal of nickel combined with the magnetic properties of the MNP make the oleate-modified MNP a new potential water purification tool.
Key-words
Superparamagnetic components, surface coating, sodium oleate, nickel adsorption, magnetic nanoparticles, water treatment
Introduction
Huge quantities of organic and inorganic compounds are released deliberately (but under control) or accidently yearly in the environment due to human activities {Jones, 1999 #14},{Kapusta, 2015 #15}. Discharge of effluents resulting of human activities (industrial, agriculture…) is the main source of pollution and thus represents a threat to environment and public heath due to the toxicity, persistence and possible bioaccumulation of the pollutants in living organisms {El-Shahawi, 2010 #18}, {Andreu, 2015 #20}, {Li, 2015 #16}, {Luna-Acosta, 2015 #17}. Trace metallic elements (TME) are widely present in the environment due to their natural geologic occurrence or due to anthropic activities {Keshavarzi, 2015 #19}. Some of these TME are considered as essential nutrients because they are metabolized after ingestion to promote the growth of plants and organisms, but some others can seriously affect living organism’s health because they are accumulated in internal organs, provoking serious diseases {Fatima, 2015 #21}. It is generally admitted that the beneficial or adverse effects of TME to organisms depends on the dose it is absorbed{Cobbina, 2015 #22}. Considering the worldwide occurrence of TME, investigations have been carried out to elaborate treatment methods able to reduce consistently the TME concentration in the environment, in accordance with the regulatory levels recommended by the World Health Organization (WHO).Efficiency of water or liquid effluents treatments is crucial since pollution can be easily spread during infiltration process of liquid phase through soils {Barbosa, 1999 #25}, {Kumar, 2013 #24}, {Maniquiz-Redillas, 2014 #23}. Various treatment techniques have been proposed to remove TME from liquids. These techniques are based on ion exchange {Ali, 2007 #27}, {Zhang, 2015 #26}, chemical precipitation/coprecipitation {Atanassova, 1998 #12}, reverse osmosis, concentration/evaporation, coagulation/flocculation, liquid-liquid extraction {Komjarova, 2006 #29}. These techniques offer satisfactorily extractions performances with limited amounts of effluent but revealed to be expensive especially when the use of solvents is required, long, with low recovery and sometimes unemployable when the volumes to be treated are large {Komjarova, 2006 #29}, {Das, 2012 #28}. Recently, solid-phase extractions (SPE) principles have been investigated to get a simple, low cost, rapid, efficient and renewable extraction technique involving limited volumes of solvents. This technique was initially devoted to preconcentration/purification method before chemical analysis {Camel, 2003 #3} but its use as a separation technique in liquid phase treatment has been investigated. Partition of the targeted element between a liquid (matrix) and a solid phase is based on adsorption or chelation or ion exchange processes, depending on the sorbent. The nature of the surface reactive groups from the porous material is then of crucial importance for a selective and efficient extraction. Functional groups containing N (amines, amides, nitriles…), O (carboxylic, hydroxyl, phenolic), and S (thiols, thiocarbamates) atoms present high chelating capacities for TME (which are mainly cations). “Hard” cations (alkaline and alkaline-earth metals) form weak outer sphere complexes with only hard oxygen ligands, “soft” cations (Cd2+ or Hg2+) present strong covalent bonds for N and S ligands, and “borderline” cations (Fe2+, Co2+, Ni2+, Cu2+, Zn2+, Pb2+, Mn2+) possess affinity with O, S, N ligands{Camel, 2003 #3}. In addition to the specificity of functional groups, the solid phase itself is important, even if its surface is not directly involved in chelation with TME. Silica (unmodified, loaded, functionalized, C18-SiO2 gel), TiO2 and Al2O3, ZrO2, MgO are among the most employed inorganic solid phase in SPE techniques {Giakisikli, 2013 #1}. Recently, SPE including a magnetic core (Fe3O4 or ϒ-Fe2O3) (MSPE) has aroused great interest because compared to the conventional techniques; separation of these superparamagnetic components is easily made by applying an
external magnetic field. Nevertheless, pure magnetic nanoparticles cannot be directly used because in aquatic media they can form large aggregates, limiting the extraction efficiency due to an increased surface area and a decreased adsorption capacity. For this reason, surface modifications (coating) have to be performed in order to maximize the quality, homogeneity and dispersibility of the magnetic nanoparticles suspension {White, 2009 #13},{Mashhadizadeh, 2011 #7}. After coating the magnetic core (with inorganic or organic components such as silica or surfactants) surface functionalization is often needed for analytical or removal purposes {Yantasee, 2007 #9}, {Huang, 2009 #11}, {Jang, 2010 #10}, {Sadeghi, 2012 #8}, {Cheng, 2012 #6}.
Nickel is one of the metallic pollutants that have been investigated for MSPE applications. Magnetic cores of ϒ-Fe2O3 or Fe3O4 {White, 2009 #13}, {Wang, 2010 #5}, coated with peptide {White, 2009 #13}, or functionalized with chelating agent {Chen, 2014 #30}, {Azizi, 2015 #4} have been investigated. Adsorption of nickel on Fe3O4 and ϒ-Fe2O3 was found to be pH-dependent, with a maximum of adsorption at pH> 4 for Fe3O4 {Wang, 2010 #5} and pH> 7 for ϒ-Fe2O3 {White, 2009 #13}. Maximum sorption capacity was determined by Langmuir isotherm modeling and was found to be equal to 0.0769 mmol/g at pH 6 for Fe3O4 {Wang, 2010 #5}, and 0.316 mmol/g at pH 7 for ϒ-Fe2O3. After coating of ϒ-Fe2O3 with poly-L-cysteine, adsorption of nickel remained pH dependent but reached 0.559 mmol/g compared to uncoated material (enrichment factor > 1.7) {White, 2009 #13}. In the case of Fe3O4 coated with EDTA, adsorption was also found to be pH dependent and at pH 6, the maximum adsorption capacity estimated with Langmuir model was found to be 0.703 mmol/g {Chen, 2014 #30}. This corresponds to an enrichment factor > 9 compared to Fe3O4 from Wang et al. {Wang, 2010 #5}. Nevertheless it has to be noticed that magnetite from Wang et al. was commercial and magnetite from Chen et al. was synthesized.
In this study, we investigated a synthesized composite adsorbent for the removal of nickel from aqueous solution. Oleate modified iron oxide magnetic nanoparticles (MNP) were synthesized. A double layer of surfactant (oleic acid – oleate) was coated at the surface of synthesized nanoparticles in order to get an homogeneous, stable and well-dispersed suspension thanks to the strong chemical bonds between the carboxylic acid and iron oxide nanoparticles {Wu, 2004 #31}. The oleate external layer provides carboxylic groups presenting affinities with “borderline” cations such as nickel {Camel, 2003 #3}. Oleate carboxylic groups being involved in nickel adsorption, we investigated their chemical reactivity in aqueous solution. Then, we studied adsorption of nickel on the synthesized magnetic material as a function of pH and initial nickel concentration.
1. Materials and methods 2.1 Reagents and chemicals
Sodium oleate( 82% fatty acids (as oleic acid) basis, Sigma Aldrich) was used for the preliminary study of the oleate system. Hydrochloric acid used to adjust the pH of the oleate solutions and perform the acid/base titration experiments was prepared from a VWR 0.1 N Normadose.
Iron(III) chloride hexahydrate ( 97%, Sigma-Aldrich), iron (II) sulfate heptahydrate ( 99%, Sigma-Aldrich), ammonium hydroxide (Fluka, 25% in water), oleic acid (extra pure, 65-88 %, Merck),
Nickel (II) chloride hexahydrate ( 98%, Sigma-Aldrich) was used for adsorption experiments. Hydrochloric acid (37%, Sigma Aldrich) and sodium hydroxide ( 99%,Riedel-de Haën) were used to prepare diluted solutions used to adjust the pH values. For the complexation of nickel before UV/Visible analyses, according to the experimental procedure described by G. Charlot {Charlot, 1974 #32}, dimethylglyoxime ( 99%, Fluka), sodium hydroxide ( 99%,Riedel-de Haën), and ammonium persulfate ( 98%,Sigma-Aldrich) were used.
2.2 Characterization of the oleate behavior in aqueous solution
All preparations of samples were carried out at room temperature (22°C 2°C). Ultrapure water was used for all experiments. Single-point pH measurements (including measurements performed in the other experimental sections) were carried out on a Mettler Toledo Seven Easy pH-meter with a combined Bioblock glass pH electrode. Calibrations were made using pH buffers (pH = 4, 7, 10) from Fisher Scientific.
Conductivity measurements were carried out with a CON 510 conductimeter (Eutech Instruments). For acid/base titrations, a Mettler Toledo G20 titrator was used, equipped with a combined glass electrode DGi115-SC from Mettler-Toledo. To an aqueous solution of 40 mL of sodium oleate (2.86∙ 10-3 M), incremental volumes of hydrochloric acid (10-2 M) were added (by steps of 0.2 mL) and a time interval of 2 minutes was set to measure the pH before the next acid addition. The titrations were repeated twice. Dynamic light scattering (DLS) and zeta potential measurements were carried out with a ZetaSizer Nano-ZS apparatus (Malvern Instruments) equipped with a 532 nm LASER, and detection was performed at 173° from the incident beam direction in a backscatter position in a thermostated sample holder (25°C). UV-Visible spectra were recorded at room temperature on a Perkin-Elmer Lambda 35 spectrophotometer.
2.3 Synthesis and characterization of the oleate-modified iron oxide MNP
Iron oxide nanoparticles covered by a double layer of oleic surfactant were synthesized, with an experimental procedure close to the one proposed by Wooding et al. {Wooding, 1991 #35} and later modified by Shen et al. {Shen, 1999 #34}. In a first step, iron oxide nanoparticles were synthesized by co-precipitation of Fe(II) and Fe(III) ions in an alkali medium. In a second step, oleic acid and oleate ions were added to the suspension in order to create a double layer of surfactant on the surface. Details on the experimental procedure are given below.
To prepare 4.4 g of oleate-modified MNP, an aqueous solution of Fe(III) chloride (10.2 g of Fe(III) chloride hexahydrate dissolved in 53.3 mL of water) was mixed with an aqueous solution of Fe(II) sulfate (6.5 g of Fe(II) sulfate heptahydrate in 70 mL of water). The mixture was then stirred (400 rpm) and ammonium hydroxide (36 mL, 25% in water) was added. The mixture was stirred vigorously (650 rpm) for 5 minutes after the addition of ammonia. A magnet was then placed under the beaker and the magnetite was left to settle. The supernatant was removed and replaced three times with 150 mL of water, until the pH reached a value of 9.5. The aqueous supernatant was then removed so that a concentrated magnetite suspension was left in the beaker. For the formation of the first layer of surfactant, the suspension was then heated to 80°C, and 3.3 g of oleic acid were added under constant manual stirring and the suspension was stirred further during a few minutes. The precipitate was washed twice with 40 mL of acetone, once with 40 mL of ethanol, twice with 40 mL of water, and once with 40 mL of a dilute solution of ammonium hydroxide (4.10-2 M) with a pH of
11. Before forming the second layer of surfactant, 40 mL of water were added to the precipitate, and the pH was set to 10 by adding a small volume of ammonium hydroxide if necessary. The suspension was then stirred (300 rpm) and heated to 60°C. Ammonium oleate was prepared by adding ammonium hydroxide (1.85 mL) to 5 g of oleic acid in 45 mL of water. 5 g of this solution were added dropwise to the heated suspension using a syringe under constant stirring at 60°C, the total time of addition not exceeding 10 minutes. The resulting concentrated suspension was then diluted for the sorption experiments.
Characterization of the oleate-covered nanoparticles was performed using FTIR spectroscopy, X-ray diffraction, transmission electron microscopy, vibrating sample magnetometry, dynamic light scattering and zeta potential measurements. Details on the experimental procedures are given below.
For FTIR and XRD analyses, samples were oven dried at 70°C during 1 day, then washed with acetone to remove the “free” surfactant molecules and then dried again at 70°C for 30 minutes. FTIR spectra were recorded on a Perkin-Elmer Paragon 1000 spectrometer. Nanoparticles were characterized by diffuse reflection infrared spectroscopy (DRIFT, minidiff plus diffuse reflectance acquired from Eurolabo). The powder mixed with KBr was placed directly in the cup and the background spectrum of KBr was subtracted. All transmittance spectra were taken at a resolution of 4 cm-1 for 16–64 scans from 4000 to 400 cm-1. XRD data were recorded at room temperature with a PANalyticalX’Pert PRO (MPD) using the Bragg–Brentano system/λCuKα. TEM photographs were obtained with a JEOL JEM 1400 microscope equipped with a SIS Morada digital camera, with x2.105 magnification. Photographs were then analysed using the ImageJ software to get the size distribution of the particles. Magnetization curves were obtained by vibrating sample magnetometry on a VSM 4500 instrument from EG&G Princeton Applied Research. Dynamic light scattering and zeta potential measurements were carried out as described in section 3.1.
2.4. Adsorption of nickel on the oleate-modified magnetite
Adsorption procedure
Sorption isotherms were obtained as a function of initial nickel concentrations ranging from 1∙10-6mol/L to 2∙10-4mol/L (which corresponds to 0.06 – 11.7 mg/L) for two different pH values, 6.8 and 7.2. Removal efficiency was also studied for a concentration of 1∙10-4mol/L (5.9 mg/L) as a function of pH, in the range 5.5-8.5, which was chosen to ensure the stability of the nanoparticle suspension.
Adsorption experiments were realized by mixing 10 mL of a nickel chloride solution (prepared from NiCl2.6H2O) and 10 mL of a nanoparticle suspension (0.1 g/L) in a closed reactor. pH values were adjusted using HCl and NaOH. The samples were then stirred on a reciprocating shaker with a speed of 125 back and forth movements per minute, for 45 h for the obtention of isotherms and, for practical reasons, for 1 week for the study as a function of pH. Equilibrium was achieved before 45 h, as no change in the removal efficiency was observed between 45 h and 1 week. After stirring, the mixture was centrifugated at 16000 rpm to separate the supernatant from the nanoparticles the concentration of nickel left in the supernatant was then measured either by UV-visible
spectrophotometry (initial nickel concentration above 2.5∙10-5 mol/L) or by ICP-AES for the weakest initial nickel concentrations (below 5∙10-5mol/L). Blank experiments were carried out in order to check if there was any precipitation of nickel in the conditions of the sorption experiments, by mixing 10 mL of a nickel solution (10-4mol/L) with 10 mL of the supernatant of a nanoparticle suspension (0.1 g/L). After centrifugation, the nickel concentration in the solution was measured and no precipitate was observed up to pH = 8.2.
Nickel analysis
UV-visible spectra were recorded on a Jenway 7310 apparatus. The absorbance was measured at 460 nm. The spectra were recorded after complexation of nickel with dimethylglyoxime. Complexation was achieved with the experimental procedure reported by Charlot {Charlot, 1974 #32} by mixing 15 mL of the supernatant acidified in HCl 0.5 M, 2 mL of dimethylglyoxime (2.5% in NaOH 1 M), 1 mL of NaOH (10 M) and 0.3 mL of ammonium persulfate (10% in water).The solution was then left 10 minutes to equilibrate, and ultrapure water was then added to get a final volume of 25 mL. UV-Visible spectra were collected between 30 minutes and 1h after the sample preparation, after a calibration curve with one blank and four nickel samples in the range 10-5 – 2.10-4 M prepared with the same experimental procedure.
ICP-AES measurements were carried out using a Perkin-Elmer Optima 7300 spectrometer. The selected wavelengths for Ni were 231 and 221 nm. The calibration standards were prepared using SCP Science standard solutions certified by supplier. For each series of measurements, one blank solution and five calibration standards were used to build the calibration curve. The concentration of samples was automatically measured three times.
Presentation of results and modeling
The removal efficiency Θ was calculated as the percentage of adsorbed nickel using the following equation:
𝛩 =(𝐶𝑖− 𝐶𝑒𝑞) 𝐶𝑖
where 𝐶𝑖 and 𝐶𝑒𝑞 are the initial and equilibrium concentrations of Ni2+ in solution (mg.L-1).
The concentration of adsorbed nickel was calculated using the equation: 𝐶𝑎𝑑𝑠 =
(𝐶𝑖− 𝐶𝑒𝑞) × 𝑉
𝑚
where 𝐶𝑎𝑑𝑠 is the equilibrium concentration of Ni2+ adsorbed on the nanoparticles (mg.g-1), 𝐶𝑖 and
𝐶𝑒𝑞 are the initial and equilibrium concentrations of Ni2+ in solution (mg.L-1), 𝑉 is the volume of
solution (L) and 𝑚 is the mass of nanoparticles in the suspension (g).
𝐶𝑎𝑑𝑠 was plotted versus 𝐶𝑒𝑞 to obtain the sorption isotherms. They were modeled using the
Langmuir model {Langmuir, 1918 #33}, which can be expressed as follows: 𝐶𝑎𝑑𝑠= 𝐶𝑚𝑎𝑥
𝐾𝐿𝐶𝑒𝑞
1 + 𝐾𝐿𝐶𝑒𝑞
where 𝐶𝑎𝑑𝑠is the equilibrium concentration of Ni2+ adsorbed on the nanoparticles (mg.g-1), 𝐾𝐿 is the
Langmuir constant (expressed here in g.mg-1), 𝐶𝑚𝑎𝑥 is the maximum adsorption capacity (mg.g-1) and
2. Results and discussion
2.1. Sodium oleate behavior in aqueous solution
The chemical reactivity of oleate-modified magnetic nanoparticles towards nickel ions is expected to be governed by the surface reactive groups provided by oleate. In this study, the synthesis of oleate-modified magnetite was performed in order that oleate was arranged as a double surface layer around the magnetic nanoparticles. To study the reactivity of this specific interface, experiments were carried out in aqueous solutions of oleate with concentrations superior to the measured CMC value. First CMC value was determined according to conductivity and pH measurements, the latter allowing the determination of hydrolysis rate and apparent hydrolysis constant. Then, potentiometric titration of oleate solution as well as absorbance, DLS and zeta potential measurements, were carried out at concentration superior to the CMC previously determined, in order ensure a molecular organization of surfactants as close as possible to the structure they may adopt at the oleate-modified MNP interface with the solution.
Conductivity and pH of sodium oleate solutions (NaOL) prepared in deionized water were measured, with concentrations ranging from 10-4 to 10-2mol/L. Figure 1(a) represents the conductivity of NaOL aqueous solutions as a function of NaOL initial concentration. Two linear segments are observed, the first one corresponding to the lowest concentrations of NaOL corresponds to the pre-CMC region, and the second corresponding to the highest NaOL concentrations corresponds to the post-CMC region. Intercept of the two linear segments corresponds to CMC of NaOL. From these results, CMC value was calculated equal to 1.3∙10-3mol/L. The pre-CMC linear equation is κ(µS/cm) = 70465 C(M) + 2.79, and is very closed to the one obtained by {El Kadi, 2003 #45} (κ(µS/cm) = 64555 C(M) + 1.1619). From this equation, the extrapolated specific conductivity (κextrap) can be calculated in order to represent Δκ = κ - κextrap as a function of NaOL concentration (Figure 1(b)). This representation proposed by {Miura, 1972 #52} shows significant changes at the CMC value, and was presented by the authors as an accurate determination method for CMC. From this determination, CMC value is estimated at 1,0∙10-3mol/L.
0,0 2,0x10⁻³ 4,0x10⁻³ 6,0x10⁻³ 8,0x10⁻³ 1,0x10⁻² 1,2x10⁻² 0 100 200 300 400 (a) K (µ S/ cm) [NaOL] (mol/L) 0,0 2,0x10⁻³ 4,0x10⁻³ 6,0x10⁻³ 8,0x10⁻³ 1,0x10⁻² -300 -250 -200 -150 -100 -50 0 K-K e xtr a p (µ S/ cm) [NaOL] (mol/L) (b)
Figure 1 : Conductivity (µS/cm) (a) and Δκ (µS/cm) (b) as a function of NaOL concentration (mol/L) Figure 2(a) represents pH versus log C of NaOL solutions. The obtained curve presents the typical shape of hydrolysable surfactants presenting an increased pH value of aqueous carboxylate soap solution when the initial concentration is increased {Lucassen, 1966 #46}. The linear trend obtained for pH = f(Log[NaOL]) has a slope equal to 1.76. According to Lucassen, a limiting slope of 1 + 2 α has to be expected for a NaOL : HOL ratio of α. From the slope of the linear trend, α was estimated equal to 0.38, meaning that NaOL and oleic acid (HOL) coexist in solution, but NaOL remains predominant. Considering the concentration range studied, no slope break is observed, meaning according to Lucassen that no precipitation of solid occurred.
-4,0 -3,5 -3,0 -2,5 -2,0 -1,5 6,0 6,5 7,0 7,5 8,0 8,5 9,0 9,5 10,0 10,5 11,0 pH Log [NaOL] (a) 0,00 0,02 0,04 0,06 0,08 0,10 0,12 0,14 0,16 0,18 0,20 0,22 0,24 0 1 2 3 4 5 b ê ta (% ) [NaOL]1/2 This study
From Tamamushi et al. (1957) (b)
10-4 10-3 10-2 10-1 0,0 2,0x10⁻⁶ 4,0x10⁻⁶ 6,0x10⁻⁶ 8,0x10⁻⁶ 1,0x10⁻⁵ 1,2x10⁻⁵ Kh (mo l/L ) [NaOL] (mol/L) (c)
Figure 2 : Variation of pH of NaOL solutions at various concentrations (mol/L) (a), evolution of hydrolysis rate (%) of NaOL as a function of NaOL initial concentration ([NaOL]1/2) (b) and of the apparent hydrolysis constant of NaOL as a function of NaOL concentration (mol/L) (c)
From pH measurements, hydrolysis rate of NaOL ( %) can be calculated as proposed by Stainsby and Alexander {Stainsby, 1949 #60}. The hydrolysis rate corresponds to the ratio of the concentration of hydroxyl ion generated by hydrolysis to that of total soap concentration. Evolution of hydrolysis rate of NaOL as a function of [NaOL]1/2 is presented on Figure 2(b), and is compared to the results obtained by Tamamushi et al. {Tamamushi, 1958 #59}. As shown in Figure 2(b), at low NaOL concentrations, the value of decreased with increasing concentrations. Then it raised and reached a maximum near the CMC. Beyond CMC, it decreased gradually. Evolution of as a function of [NaOL]1/2 has been linked to the micelle formation by Stainsby et al. {Stainsby, 1949 #60}, and Cook {Cook, 1951 #61}. These authors have proposed that submicelles (i.e. at least two molecules or ions per particules) could be formed below the CMC. The free oleic acid produced by hydrolysis will condense to submicelles and accordingly, hydrolysis will go on further. With further increase in salt concentration, the counter ion association will take place and the micelle will be formed. From hydrolysis rate, the CMC value is estimated equal to 2.5∙10-3mol/L and is closed to the CMC value estimated by Tamamushi et al. for NaOL (2∙10-3mol/L).
From pH measurements, formation of aggregates can be determined by representing the apparent hydrolysis constant (Kh = [OH-]²/([NaOL]-[OH-]) vs log C (Figure 2(c)){El Kadi, 2003 #45}. At concentrations under CMC Kh vs log C is a straight line whereas a curve is obtained when micelles form. From Figure 2(c), CMC value is estimated at 1.5∙10-3mol/L.
Table 1 : Comparison of CMC values obtained from this study and data from the literature Source CMC (mmol/L)
(this study)
CMC (mmol/L) from literature κ(C) 1.3 2.15 {Akhter, 1997 #48} Δκ(C) 1.0 0.56 {El Kadi, 2003 #45}
Kh (logC) 1.5 0.3 - 0.47 {El Kadi, 2003 #45}
(C1/2) 2.5 2 {Tamamushi, 1958 #59}
other 1 - 2.3 {Hildebrand, 2004 #47}
1 {Xin, 2008 #49}
According to literature data (Table 1), CMC of NaOL in water ranges from 0.3 to 2.3 mmol/L. Various determination methods were investigated in this study to determine the CMC of NaOL. These CMC values ranged from 1 to 2.5 mmol/L and are closed to the range values found in the literature. Potentiometric titration experiments were carried out on a solution prepared from NaOL with a concentration above the CMC (2.86∙10-3mol/L) (Figure 3). For the same initial concentration of NaOL, average size and absorbance at 400 nm were measured as a function of pH (Figure 4).
0 5 10 15 20 2 3 4 5 6 7 8 9 10 11 pH Volume (mL)
Figure 3: Potentiometric titration curve (pH as a function of the volume of acid added). Conditions: Coleate=2.86∙10-3
mol/L, Voleate = 35 mL, CHCl = 0.01 mol/L. The regions for the formation of micelles, vesicles and droplets are proposed based on the first inflexion point and the discussion in Morigaki and Walde{Morigaki, 2007 #51}. 3 4 5 6 7 8 9 10 0,0 0,1 0,2 0,3 0,4 0,5 0,6 0,7 0,8 Absorbance average size pH Ab so rb a n ce (a rb itra ry u n it) 100 150 200 250 300 350 a ve ra g e si ze (n m)
Figure 4 : Evolution of absorbance at 400 nm and average size of NaOL (2.86∙10-3mol/L) as a function of pH
From Figure 3 and Figure 4 three distinct zones appear. The potentiometric titration curve (Figure 3) exhibits two inflexion points: the first inflexion one is obtained for Vacid = 4 mL and pH = 8.9, and the second one for Vacid = 10 mL and pH = 6.1, corresponding to the neutralization endpoint of the titration, when all the oleate ions have been transformed into oleic acid.Compared to the schematic titration curve presented by Kanicky and Shah {Kanicky, 2002 #62}, we do not observe any inflexion point above the neutralization endpoint, which would have occurred with higher amounts of acid
Micelles
titrant and would correspond to a crystallization/precipitation of the oleic acid.From Figure 4 absorbance increases from pH 4 to pH 8 then it abruptly decreases from pH 8 to pH 9, finally it slightly decreases from pH 9 to pH 10.
These evolutions of pH and absorbance in three regions are intimately linked to oleate molecules arrangement in solution. In the pH range from 10 to 8, the first inflexion point of the titration curve on Figure 3 (pH = 8.9) is tricky but it was also observed by Morigaki and Walde {Morigaki, 2007 #51}. A closer look on the organization of the oleate ions above the CMC may help to understand its presence. Morigaki and Walde proposed that a transformation from oleate micelles to oleate/oleic acid vesicles occurs between pH = 7 and 9.The transition from micelles to vesicles has also been reported to occur at pH values around 9 by Rendon et al and can explain the absorbance evolution observed in the pH range from 8 to 10 (Figure 4){Rendon, 2012 #50}. This transition from micelles to vesicles has also been modeled to occur as the protonation state of oleate increases {Janke, 2014 #53}.
The titration curve allows the determination of the pKa value of oleate as the pH at half the neutralization endpoint, which leads to a value of 8.4. This value is somewhat lower than the value determined by Kanicky and Shah {Kanicky, 2002 #62} (9.85) and closer to the one obtained by Mattson and Volpenhein{Mattson, 1966 #63} (about 9). It can be assumed that this difference in the pKa value could come from the difference in the concentrations chosen to perform the potentiometric titration (0.35 mol/L for Kanicky and Shah, not indicated for Mattson and Volpenhein) which can lead to a different organization of the oleate aggregates in solution. Above pKa, oleate predominates but absorbance varies depending on oleate molecules arrangement (as vesicles at pH
pKa ({Morigaki, 2007 #51}); or as micelles at pH>pKa ({Rendon, 2012 #50}). This is confirmed by the DLS average size measurements presented in Figure 4. From pH 8 to pH 10, the average size decreases and is consistent with conversion of vesicles to micelles observed by cryo-TEM ({Rendon, 2012 #50}).
Zeta potential of oleate solution (1.5∙10-3mol/L) was measured as a function of pH (Figure 5). Results show that at pH value above pKa, zeta potential is strongly negative (inferior to -50 mV) whereas it is slightly negative to neutral at acidic pH value. Evolution of zeta potential depending on pH value can be linked to the predominance of oleate or oleic acid. Indeed, at low pH values (<pKa - 1), oleic acid predominates provoking aggregation of protonated (and neutral) molecules as droplets or oil phase. At basic pH values (>pKa + 1), deprotonated (negative charge) oleate molecules aggregate as vesicles or micelles depending on pH {Janke, 2014 #53}. This value of the zeta potential will be compared in the next section with the value measured for oleate-modified MNP.
3 4 5 6 7 8 9 10 -100 -80 -60 -40 -20 0 zeta potential ze ta p o te n tia l (mV) pH
Figure 5: Zeta potential of NaOL solution (1.5∙10-3mol/L) as a function of pH
2.2. Characterization of the synthesized oleate-modified nanoparticles
Oleate-modified MNP were obtained as stable suspensions in water. Their magnetic properties were first characterized, followed by a study of their size and morphology (TEM and DLS), crystal structure (XRD and FT-IR) and molecular arrangement at the interface (FT-IR and zeta potential measurements).
The magnetization curve of the nanoparticles is presented on Figure 6. There is no hysteresis, the particle remnant magnetization being undetectable. Using this curve, the particle saturation magnetization was obtained by extrapolation of M vs 1/H to zero value of 1/H in the range of high values H/M {Rosensweig, 1985 #42}. The particle saturation magnetization was determined to be 387 kA/m. This value is lower than the saturation magnetization of bulk magnetite (480<MS<520 kA) and is similar to the saturation magnetization of bulk maghemite (380-400 kA/m) {Svoboda, 2004 #43}. However, the saturation magnetization is lower for nanoscale particles than for bulk materials {Vuong, 2012 #44}. As a consequence, the somewhat low saturation magnetization compared to bulk magnetite does not exclude magnetite as one of the main phases present in the oleate-modified nanoparticles.
Figure 6: Magnetization curve of the oleate-modified nanoparticles
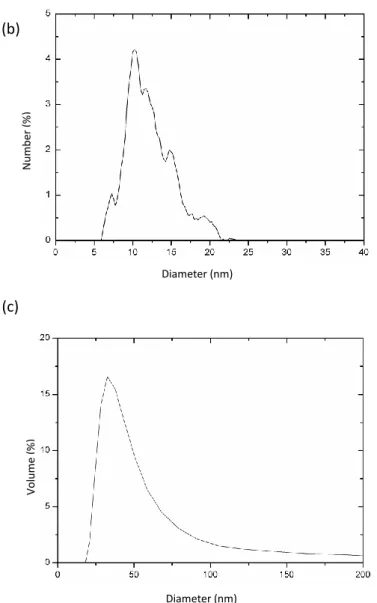
A TEM photograph of the synthesized nanoparticles is shown on Figure 7(a). As can be seen, the morphology of the sample consists in nanoclusters of a size around 50 nm composed of nanoparticles with a diameter around 10 nm.
Figure 7: Size and morphology of the oleate-modified nanoparticles: TEM photograph (a), nanoparticle size distribution obtained from TEM (b) and DLS (c)
This size distribution is confirmed by the analysis of TEM data (Figure 7(b)) and DLS measurements (Figure 7(c)). The TEM data show a distribution from 6 to 22 nm with an average number mean diameter of 12 nm (15 nm converted in volume mean diameter). DLS results give a volume mean particle diameter of 35 nm, which corresponds to the size of the nanocluster aggregates. Such an aggregation of oleic acid-coated nanoparticles has already been reported {Bica, 2007 #40} but its origin is still not completely clear. The aggregation of the particles in nanoclusters is probably due to uncontrolled kinetics of the adsorption of the second surfactant layer onto the nanoparticles during the synthesis. It is indeed possible that, because of hydrophobic interactions, the particles bearing the first layer of surfactant aggregate and that subsequently the second layer is formed on the aggregate and not on the isolated nanoparticles. The presence of the nanoclusters does not affect the ferrofluid stability and there is no sedimentation during at least three months. More, this structuration in nanoclusters has turned out to give remarkable properties in terms of magnetic capture {Magnet, 2012 #41} by a combination with micrometer-sized magnetic particles.
Diameter (nm) N um be r ( %) Diameter (nm) Vo lum e ( %) (b) (c)
The XRD diagram of the nanoparticles is shown on Figure 8. The position and intensity of the peaks match well with standard diffraction data of magnetite (JCPDS file 19-0629) or maghemite (JCPDS file 39-1346). Indeed, diffraction data are very close for these two iron oxides. The XRD diagram is noisy, maybe indicating that there is an amorphous phase present in the sample together with the well-crystallized magnetite/maghemite. FTIR data may help to differentiate the two solids {Hu, 2011 #36} and to characterize the oleate ions adsorbed on the synthesized particles.
20 40 60 80 100 1000 1100 1200 1300 1400 1500 1600 1700 1800 (0 44 ) (1 15 ) (0 04 ) (1 13 ) In te n si ty (a .u .) 2deg) (0 22 )
Figure 8 : XRD diagram of oleate-modified magnetite nanoparticles.
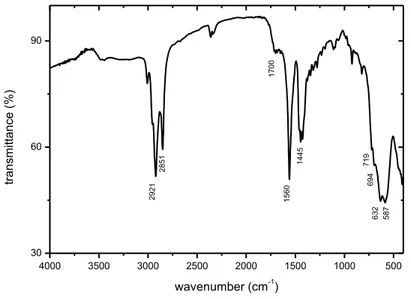
Figure 9 presents the FT-IR spectrum of the oleate-modified nanoparticles. Three series of bands can be observed.The last series, on the right of the spectrum, characterizes the iron oxide. The presence of a large band centered on 580-590 cm-1 is characteristic of magnetite {Raman, 1991 #39}. The series of peaks at 718, 694, 632 and 587 cm-1 can be attributed to maghemite {Jarlbring, 2005 #38}. These results, combined with XRD data, tend to show that the two phases magnetite and maghemite coexist in our “magnetite” nanoparticles. The first two series, on the left and the middle, corresponds to the bands of oleate adsorbed on the surface of the iron oxide ({Roonasi, 2010 #64} ; {Yang, 2010 #68}): asymmetric (2921 cm-1) and symmetric (2851 cm-1) stretching of the CH2 moiety, stretching of the C=O bond (1700 cm-1), asymmetric (1560 cm-1) and symmetric (1445 cm-1) stretching of the C-O-O- group.
4000 3500 3000 2500 2000 1500 1000 500 30 60 90 wavenumber (cm-1) tra n smi tta n ce (% ) 2921 2851 1700 1560 1445 719 694 632 587
Figure 9:FT-IR spectrum of oleate-modified magnetite nanoparticles.
According to Yang et al, the presence of a band at 1710 cm-1 is characteristic of the presence of an oleate bilayer on the surface of magnetite ; our value even if slightly different would be then in agreement with the formation of such a bilayer. This hypothesis is corroborated by the stability of the suspensions of this study in aqueous medium ({Yang, 2010 #68}). These bilayer-coated nanoparticles could then be compared to a kind of oleate/magnetite “vesicles” as those which have been identified in solution in part 3.1 of this study, where the water molecules present in the center of the vesicle would be replaced by the iron oxide particles, as represented on Figure 10. Hence, the results of part 3.1 should help to better understand the surface chemistry of our oleate-coated magnetite particles. The solution chemistry of oleate vesicles (which are supposed to form at pH around 8), especially their acid/base properties, could then be transposed to the oleate bilayer on the surface of the particles.
Figure 10 : Schematic representation of the similarity between vesicles in solution (a) and the oleate bilayer adsorbed on the iron oxide particles (b)
Last, as part of the characterization of our material, the zeta potential was measured for two volumic fractions of the suspensions, 5∙10-3 and 0.16 (pH9) and found to be, respectively, -56 and -53 mV.This value is close to the ones obtained for basic pH values for oleate ions in solution (inferior to -50 mV).It isconsistent with a negatively charged surface of the nanoparticles bearing the second layer of anionic surfactant. This confirms that the electrophoretic mobility and surface reactivity of the synthesized material is governed by the oleate double layer formed at the interface.
2.3. Adsorption of nickel on the oleate-modified MNP
Adsorption of nickel was conducted as a function of pH (from 5.5 to 9) (Figure 11), and as a function of Ni initial concentration at two different pH values (6.8 and 7.2)(Figure 12).
water
iron
oxide
5,0 5,5 6,0 6,5 7,0 7,5 8,0 8,5 9,0 9,5 10,0 0 20 40 60 80 100 R e mo va l e ffi ci e n cy pH
Figure 11 : Adsorption of nickel (10-4mol/L) on oleate-modified MNP (0.1 g/L) as a function of pH (line is only plotted to guide the eyes).
0 2 4 6 8 10 0 20 40 60 80 pH=7,2 pH=6,8 fit Langmuir Ad so rb e d N i 2+ co n ce n tra tio n , c ads , mg /g Ni2+
concentration in solution, csol, mg/L
Figure 12: Adsorption isotherms of nickel on oleate-modified MNP and pH 7.2 and pH 6.8, in 0.1 g/L suspension.
From Figure 11, the shape of the curve depicts the typical adsorption process of cationic specie, i.e. adsorption increases when pH increases.This strong pH – dependency adsorption indicates that adsorption of Ni on oleate-modified MNP is ion-exchange or chemisorption process and is favored by electrostatic interactions. The study of the solution chemistry of oleate performed in part 3.1 helps to understand the evolution of the retention of nickel with pH. Indeed, the carboxylic groups of the
“vesicle-like” oleate-modified MNP surface govern the global acid-base reactivity. At acidic pH values the surface is protonated. In these conditions electrostatic attraction between carboxylic groups and nickel ions is not favored; this explains the low adsorption rate of nickel at acidic pH values. At near to neutral to basic pH values, surface is deprotonated, and negatively charged. In these conditions, electrostatic attraction of nickel towards the surface is maximum and then adsorption (ion-exchange or chemisorption) occurs. The maximum adsorption for nickel (90%) begins from pH 7.5, which is close to the pKa value determined for oleate vesicles in solution.
When initial concentration of nickel is increased, adsorption isotherms reach a plateau, meaning that oleate-modified MNP surface is saturated (Figure 12). Adsorption isotherms are satisfactorily described with Langmuir isotherms and this is in good accordance with others studies from the literature (Table 2). The maximum adsorption capacity for nickel depends on pH and is lower at acidic pH values due to surface protonation. This low adsorption at acidic pH values indicates that oleate-MNP can be regenerated by elution with a strong acid solution. According to the literature data from Table 2, after surface modification of magnetic materials with various chelating agents, adsorption of Ni is more or less significantly enhanced compared with results obtained on naked material. Surface modification of MNP with oleate allowed reaching an enhancement factor for nickel from 4 to 130, depending on pH. Adsorption capacity for Ni2+is comparable with the ones obtained from the literature with modified magnetic materials and is closed to EDTA-, tea waste- and alginate-Fe3O4. Moreover, these surface modifications exhibit higher adsorption capacities than Amino-PAA-Fe3O4 and DMG/SDS-Alumina coated Fe3O4.
Table 2: Comparison of Langmuir parameters obtained in this study and for other surface-modified iron oxides in the literature
Adsorbent pH Langmuir maximum
adsorption capacity for Ni(Qmax)(mg/g) Langmuir constant (b) (L/mg) Reference Synthetic Fe3O4 / ϒ-Fe2O3 (MNP) - 11.53 0.228 {Sharma, 2010 #56}
Commercial Fe3O4 6 4.5 0.109 {Wang, 2010 #5}
Alginate- ϒ-Fe2O3 5.3 30.5 0.545 {Ngomsik, 2006 #54}
tea waste-Fe3O4 - 38.3 0.085 {Panneerselvam, 2011 #55}
EDTA-Fe3O4 6 41.3 0.184 {Chen, 2014 #30}
DMG/SDS-Alumina coated-Fe3O4
8 9.72 - {Karimi, 2013 #58}
Oleate-MNP 7.2 80 2.56 This study
Oleate-MNP 6.8 44 0.544 This study
3.4. Conclusion
This study has combined an investigation of the solution chemistry and the surface behavior of oleate ions in interaction with iron oxide magnetic nanoparticles, followed by an evaluation of the retention properties of the oleate-modified nanoparticles towards nickel ions. As part of the study of the oleate solution properties, the CMC was determined and found to be 1-2.5 mmol/L.
Potentiometric titrations and absorbance measurements were then carried above the CMC and showed the presence of several types of molecular arrangement of oleate ions in solution as micelles, vesicles or droplets. The structuration in vesicles was compared to the structure of oleate adsorbed on the MNP, which form a bilayer coating as shown by FT-IR analyses, zeta potential measurements and the stability of the suspensions in aqueous medium (no sedimentation for at least three months). Last, the adsorption of nickel ions on the MNP was studied and showed a high pH-dependency with a maximum retention at pH values above 7.5. This can directly be linked to the acid/base properties of the oleate on the surface of the MNP, with a pKa value of 8.4 as determined for the vesicles in solution. Removal of nickel has shown to be efficient compared with other surface-modified iron oxide in the literature, with a Langmuir maximum adsorption capacity of 44 and 80 mg/g for pH = 6.8 and 7.2, respectively. These results, in combination with the magnetic properties of the NMP, allow to propose the use of this system as a possible new effective water purification tool.

![Figure 2 : Variation of pH of NaOL solutions at various concentrations (mol/L) (a), evolution of hydrolysis rate (%) of NaOL as a function of NaOL initial concentration ([NaOL] 1/2 ) (b) and of the apparent hydrolysis cons](https://thumb-eu.123doks.com/thumbv2/123doknet/13549300.419297/11.892.211.638.133.440/variation-solutions-concentrations-evolution-hydrolysis-function-concentration-hydrolysis.webp)